Choosing between Interactive Brokers Group (NASDAQ:IBKR) and S&P Global (NYSE:SPGI) requires understanding how these financial giants generate wealth. You must decide which business model offers the better path for your portfolio.
Interactive Brokers serves as a technology-first gateway to global markets, while S&P Global provides the essential data and credit ratings that the world’s capital markets depend upon for daily operations. This comparison explores their financial health, growth rates, and valuation multiples to help you determine which stock is the superior buy today.
The case for Interactive Brokers Group
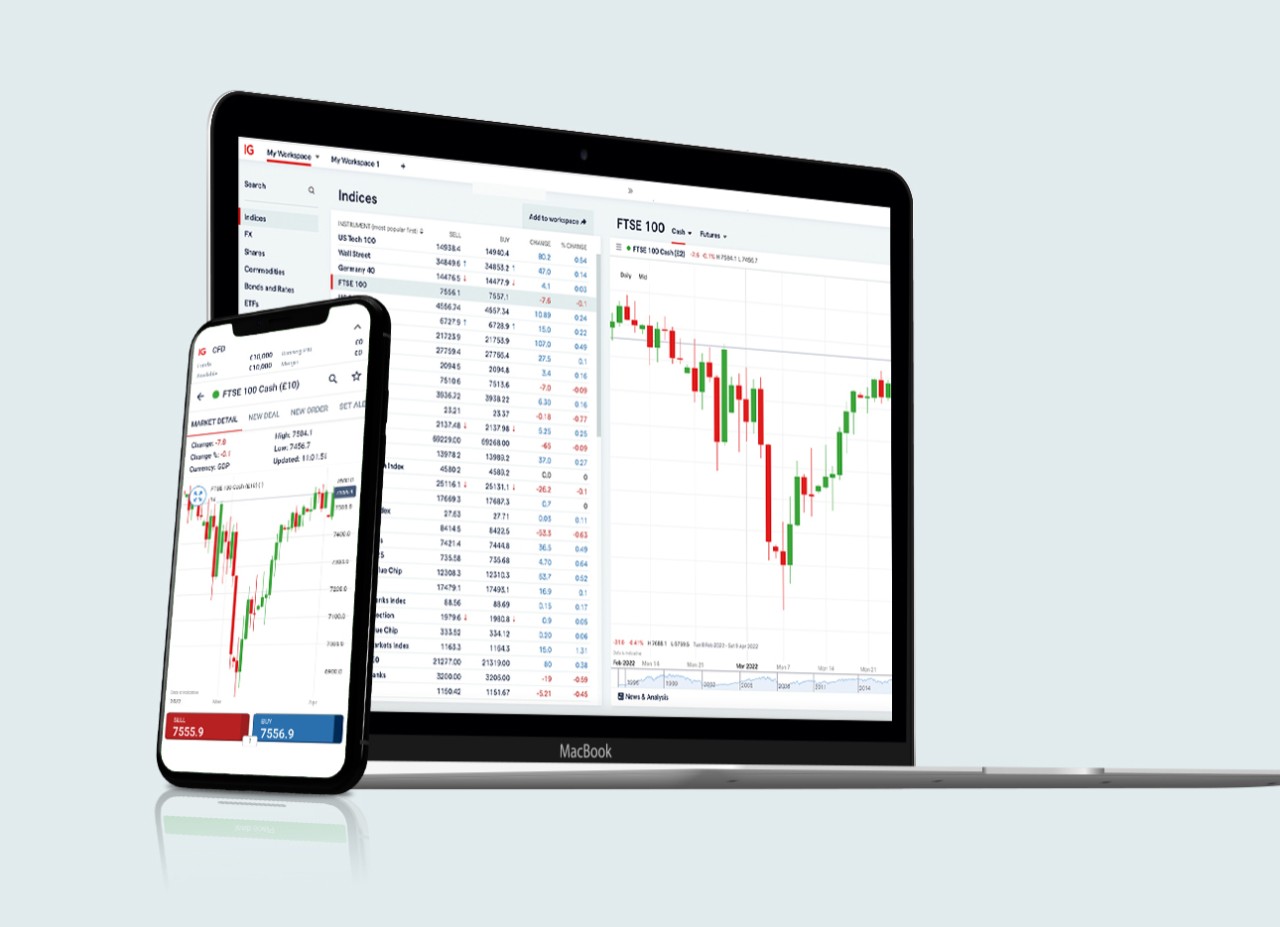
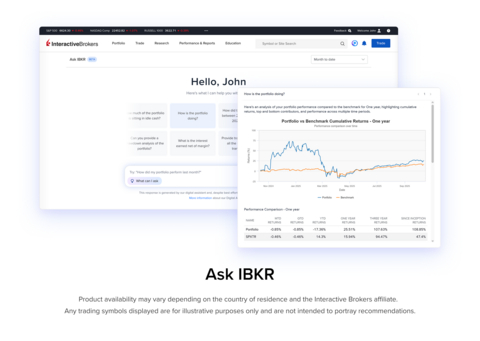
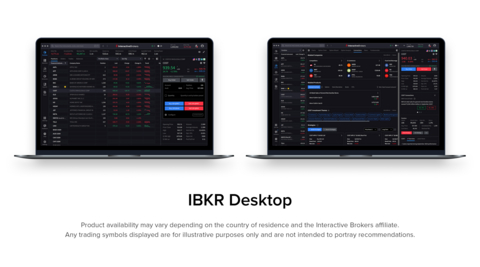
Interactive Brokers operates as a highly automated global broker, providing direct-access execution and clearing services across more than 175 markets. The company operates within the broader universe of financial stocks, offering clients the ability to trade in roughly 29 different currencies. Its client base includes hedge funds, proprietary trading firms, and over 4.4 million individual investors, with no single customer accounting for more than approximately 2% of commissions.
Reliable recent quarterly figures for at least one of these companies aren’t available, so this comparison uses each company’s latest full fiscal year. In the fiscal year ended Dec. 31, 2025, revenue reached nearly $6.2 billion, reflecting growth of roughly 19.7%. This expansion helped Interactive Brokers achieve net income of close to $984 million, supported by a healthy net margin of approximately 15.9%.
As of its December 2025 balance sheet, the company demonstrates a conservative financial structure. The debt-to-equity ratio, a metric showing the relationship between total debt and the equity shareholders have in the business, was approximately 0. Free cash flow, which is the cash a company generates from its operations minus its capital spending, reached nearly $15.7 billion, while the current ratio of roughly 1.1 indicates Interactive Brokers has sufficient short-term assets to cover its immediate obligations.
The case for S&P Global
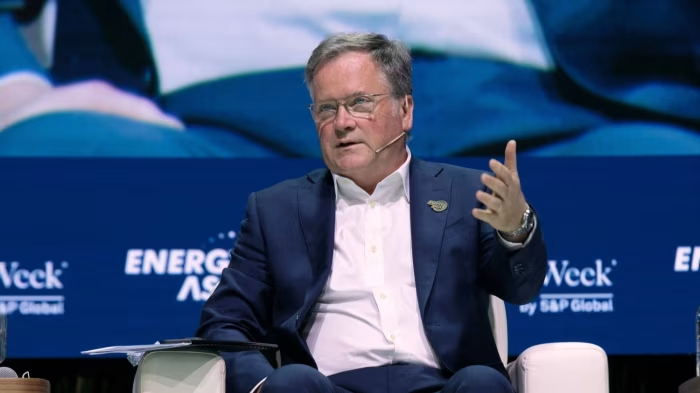
S&P Global provides critical intelligence through its credit ratings, benchmarks, and data analytics used by governments and corporations worldwide. The company is a key player in global commodity and energy markets, with nearly 44,500 employees across 43 countries helping to maintain its market-leading positions. Its revenue streams are highly diversified, catering to asset managers, institutional investors, and investment banks that rely on its proprietary workflow solutions.
During the fiscal year ended Dec. 31, 2025, the company generated revenue of approximately $15.3 billion, an increase of nearly 7.9% over the prior year. Profitability remains a core strength for the business, as evidenced by net income of nearly $4.5 billion. This resulted in a robust net margin of roughly 29.2%, showcasing the high profitability inherent in its data-driven business model.
Based on its December 2025 balance sheet, S&P Global manages a balanced capital structure. Its debt-to-equity ratio, which measures total debt relative to shareholders’ equity, is approximately 0.5. The current ratio, a liquidity measure that compares short-term assets to short-term liabilities, reached nearly 0.8, while the business generated nearly $5.5 billion in free cash flow, providing significant capital for reinvestment or shareholder returns.
Risk profile comparison
Interactive Brokers faces intense competition from established prime brokers and newer zero-commission online platforms. The company is subject to complex international regulatory requirements, including potential changes in laws that govern prediction markets and brokerage activities. Furthermore, its heavy reliance on proprietary technology means that system failures, cyberattacks, or data privacy breaches could disrupt operations. Shareholders should also note that the founder maintains majority voting control, which could lead to potential conflicts of interest.
S&P Global faces high cybersecurity risks due to its central role in the global financial infrastructure and the massive scale of its digital operations. The company must constantly innovate to keep pace with new artificial intelligence technologies that could change how financial data is consumed. It also carries significant legal and regulatory exposure related to its ratings and indexes businesses. Additionally, the company relies on third-party providers like Amazon (NASDAQ:AMZN) for cloud services.
Valuation comparison
S&P Global appears more conservatively valued based on its lower multiple of future earnings estimates, while Interactive Brokers trades at a higher price for its faster growth.
Valuation metrics include sourcing from Financial Modeling Prep (FMP) and may differ from other data providers.
Which stock would I buy for 2027?
These two companies are pretty evenly matched. Interactive Brokers and S&P Global have nearly identical market caps, as well as similar dividend yields. The trading specialist’s revenue is growing faster, while S&P’s net margin is stronger.
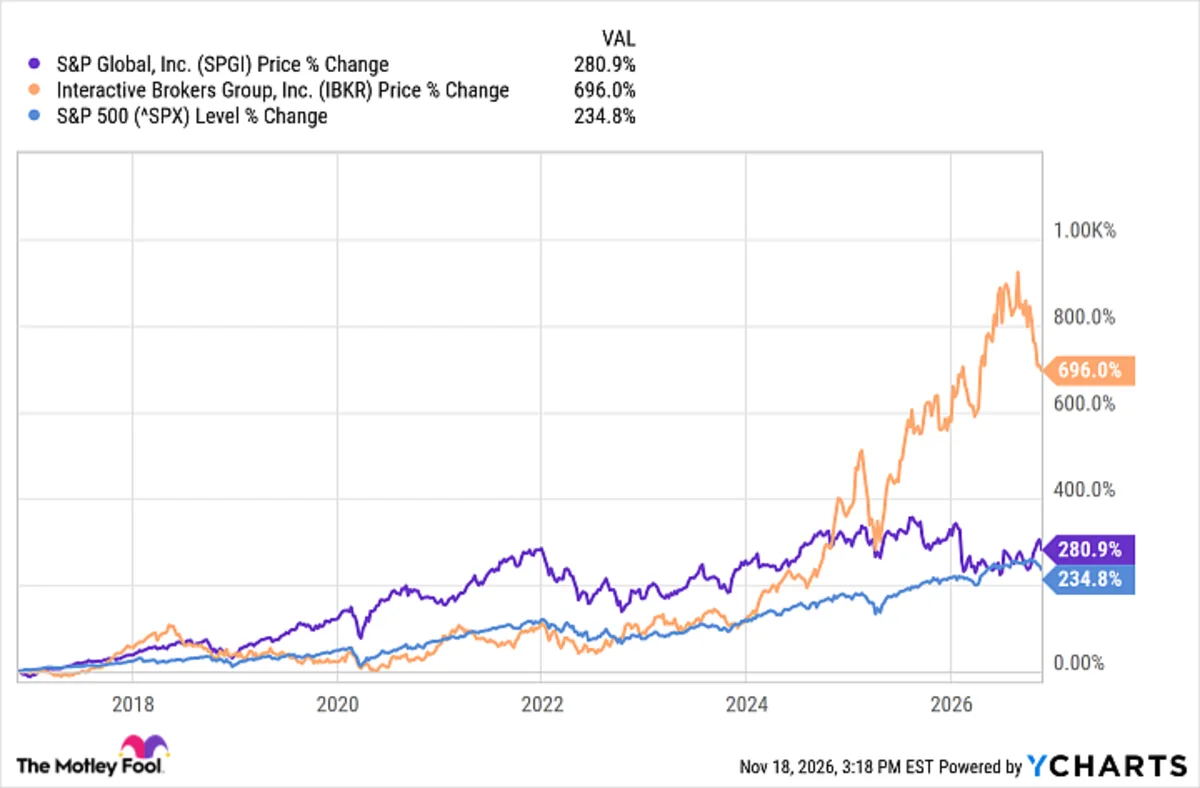
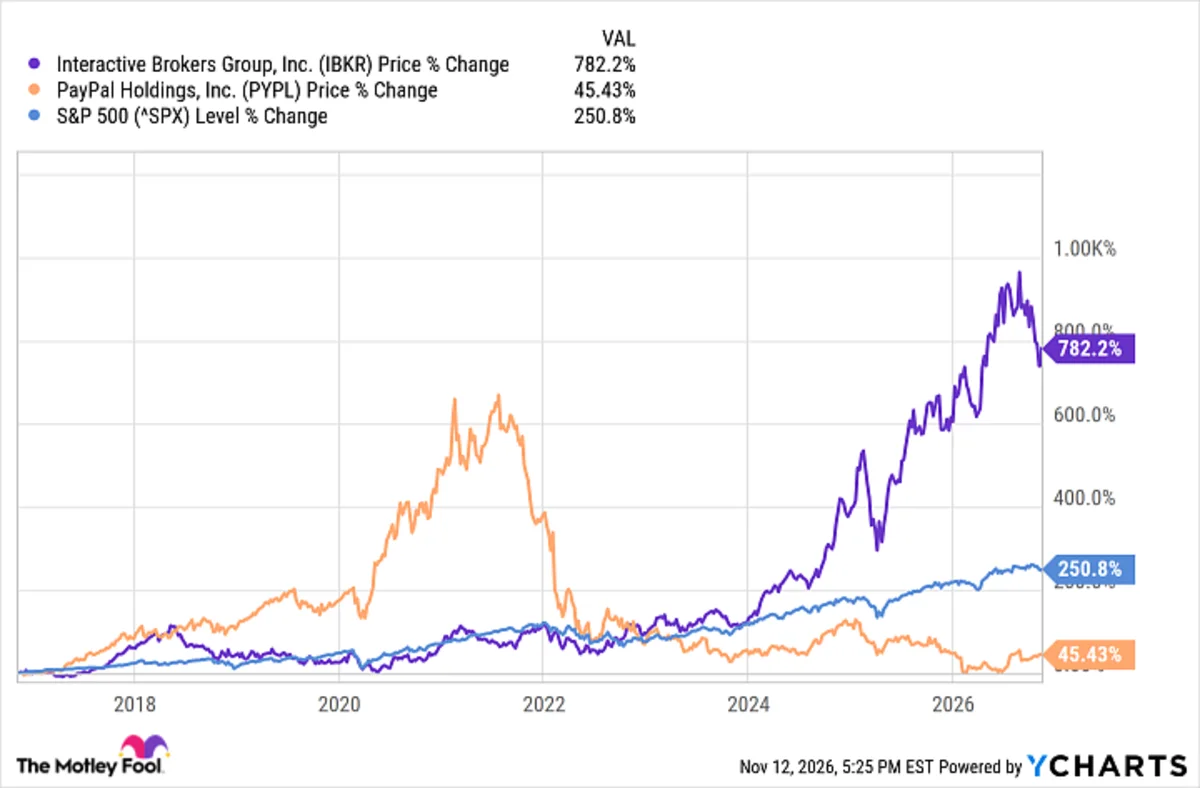
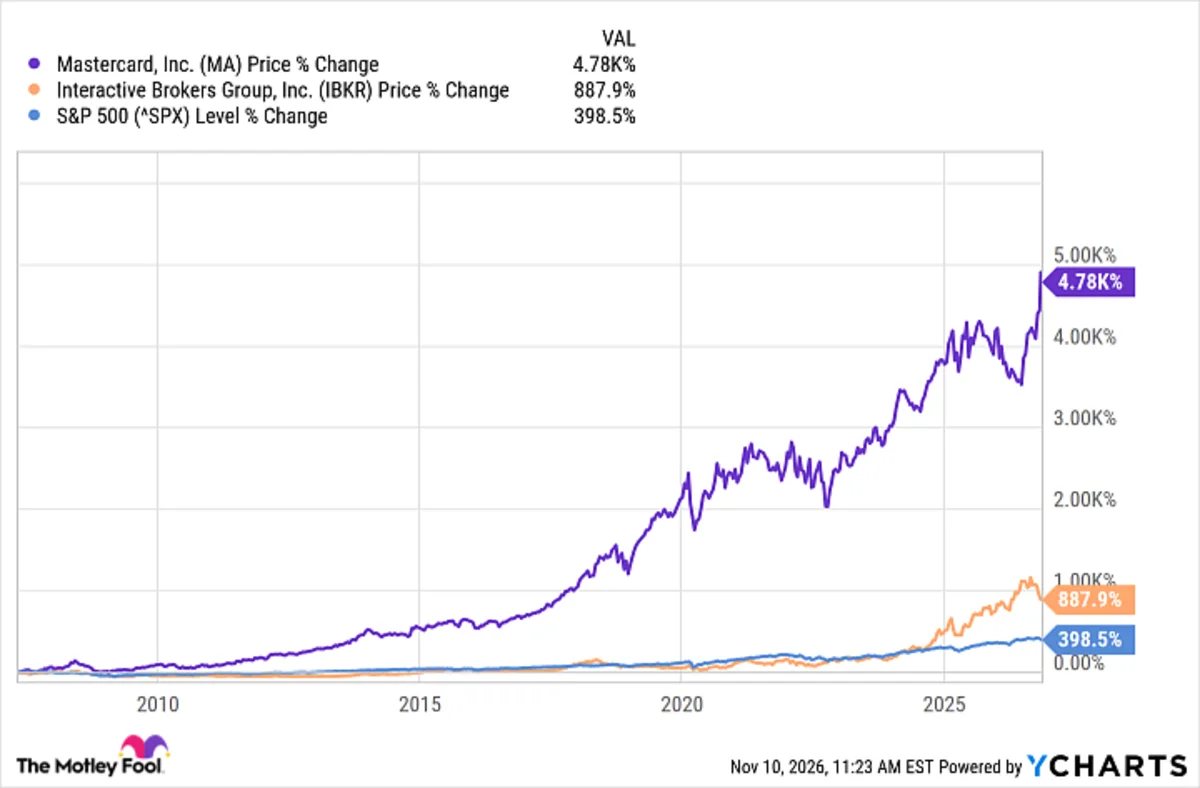
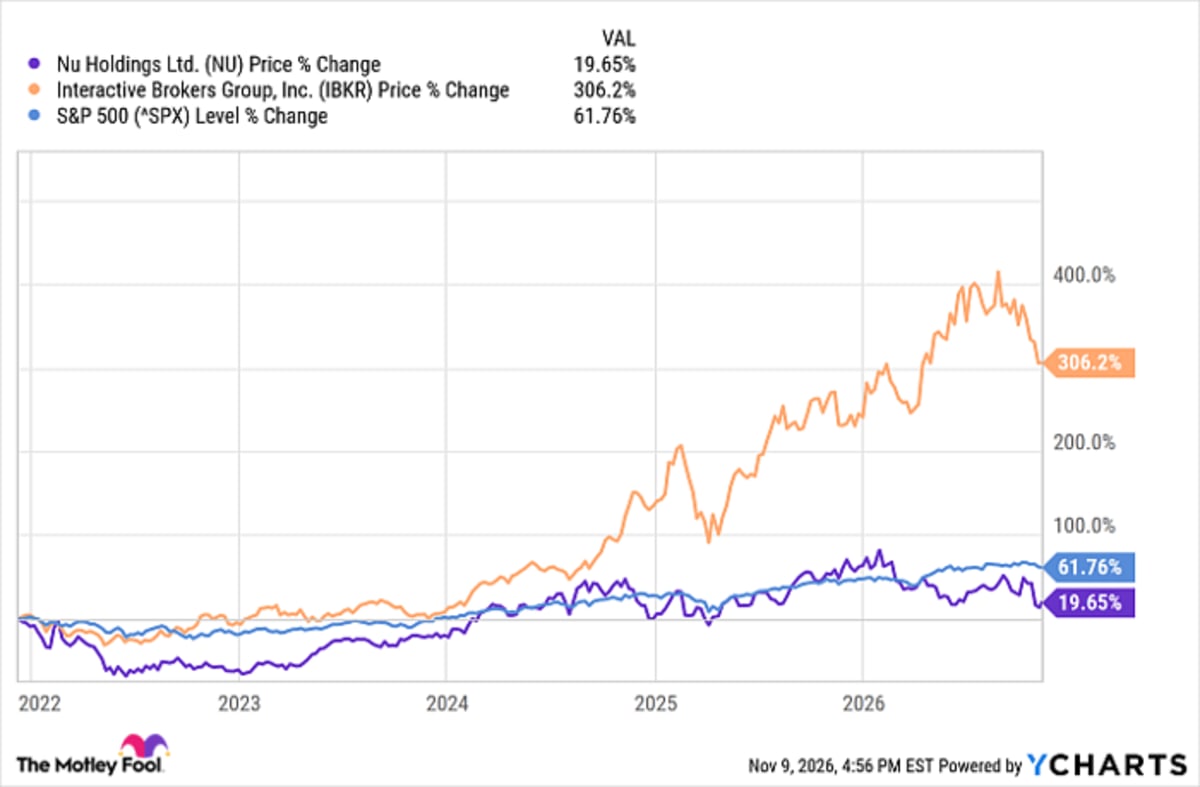
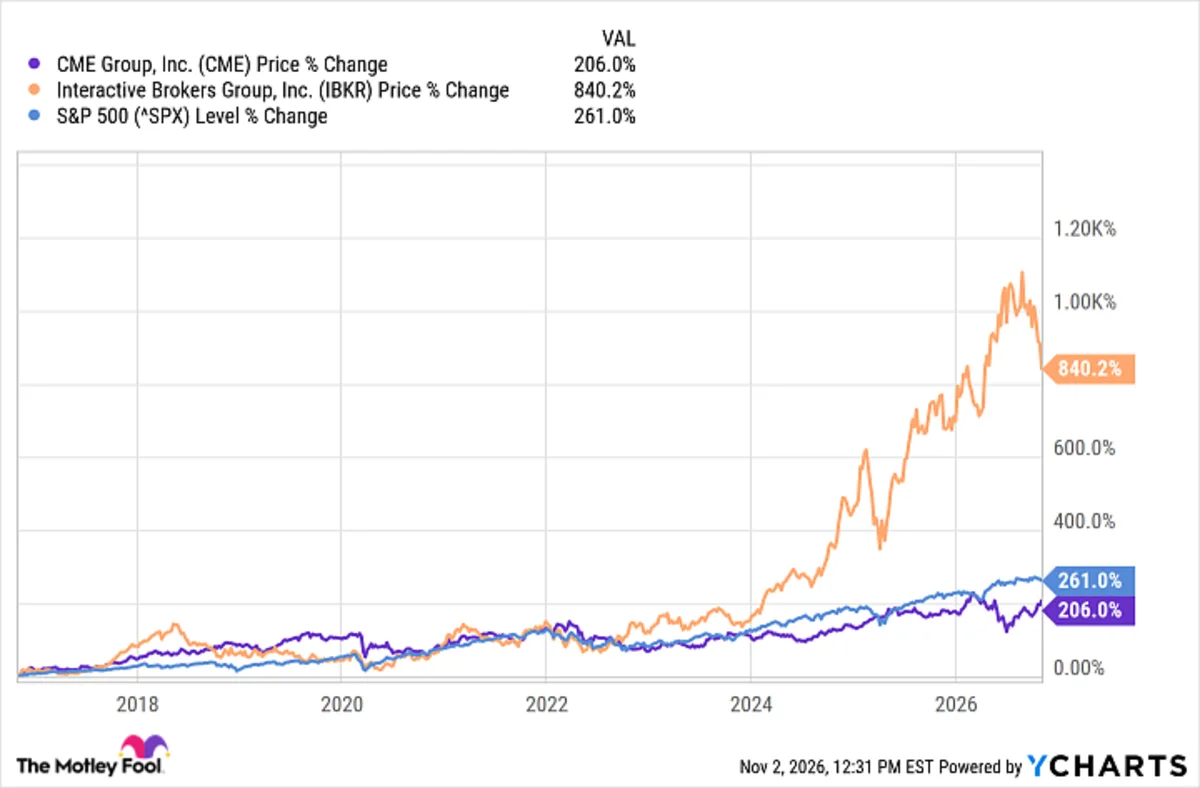
S&P Global has outpaced the market over the past 10 years, beating the S&P 500 (SNPINDEX:^GSPC) by more than 40 percentage points. Meanwhile, Interactive Brokers has blown both of them out of the water with a nearly 700% gain. Of course, past performance is no guarantee of future results.
It’s true Interactive Brokers’ shares are slightly more expensive than S&P Global’s on a forward-looking basis. Still, as investor and economist Benjamin Graham said, “Price is what you pay. Value is what you get.” I think Interactive Brokers’ stock looks like the better buy for 2027 and beyond.
Should you buy stock in Interactive Brokers Group right now?
Before you buy stock in Interactive Brokers Group, consider this:
The Motley Fool Stock Advisor analyst team just identified what they believe are the 10 best stocks for investors to buy now… and Interactive Brokers Group wasn’t one of them. The 10 stocks that made the cut could produce monster returns in the coming years.
Consider when Netflix made this list on December 17, 2004… if you invested $1,000 at the time of our recommendation, you’d have $321,850!* Or when Nvidia made this list on April 15, 2005… if you invested $1,000 at the time of our recommendation, you’d have $955,232!*
Now, it’s worth noting Stock Advisor’s total average return is 793% — a market-crushing outperformance compared to 203% for the S&P 500. Don’t miss the latest top 10 list, available with Stock Advisor, and join an investing community built by individual investors for individual investors.
Erin Kennedy has no position in any of the stocks mentioned. The Motley Fool has positions in and recommends Amazon, Interactive Brokers Group, and S&P Global. The Motley Fool recommends the following options: long January 2027 $43.75 calls on Interactive Brokers Group and short January 2027 $46.25 calls on Interactive Brokers Group. The Motley Fool has a disclosure policy.