The shift toward digital trading has created a fierce rivalry between established players and agile newcomers. Deciding between Robinhood Markets (NASDAQ:HOOD) and Interactive Brokers Group (NASDAQ:IBKR) requires balancing rapid growth against global stability.
Robinhood focuses on accessible, user-friendly mobile trading for retail audiences, whereas Interactive Brokers targets professional traders with sophisticated tools and access to global markets. As both companies expand their offerings into new asset classes, investors must determine which business model is best positioned to capture market share in the evolving financial landscape.
The case for Robinhood Markets
Robinhood Markets operates as a multifaceted financial services platform offering retail brokerage, cryptocurrency trading, and digital banking services. In its latest annual report, filed for the fiscal year ended December 2025, the company highlighted a customer base of nearly 28.7 million funded accounts. The acquisition of Bitstamp in 2025 allowed the firm to begin serving institutional customers with services like on-exchange lending and perpetual futures for Bitcoin (CRYPTO:BTC).
In FY 2025, revenue reached nearly $4.5 billion, representing a significant increase of approximately 51.6% over the previous year. The company reported a net income of roughly $1.9 billion for the period, resulting in a net margin of about 42.1%. This performance indicates a substantial turnaround from the net loss reported in FY 2023, showing much stronger bottom-line results for the business.
As of its December 2025 balance sheet, the debt-to-equity ratio was approximately 1.3x. This ratio, which measures total debt against shareholder equity, suggests the company uses a moderate amount of leverage to fund its fintech stocks operations. Robinhood also reported a current ratio of roughly 1.3x, which measures its ability to cover short-term obligations, and generated nearly $1.6 billion in free cash flow. Free cash flow represents the cash remaining after subtracting capital expenditures from operating cash.
The case for Interactive Brokers Group
Interactive Brokers Group provides direct-access trade execution and clearing services across approximately 175 market centers globally. The company serves a diverse client base including individual investors, hedge funds, and registered investment advisors. Its primary value proposition lies in low-cost execution and a platform capable of handling multiple currencies and asset classes simultaneously.
For FY 2025, the company reported revenue of close to $10.2 billion, which was a growth of nearly 9.8% compared to the prior year. Net income for the period was approximately $984 million, reflecting a net margin of roughly 9.6%. Interactive Brokers has shown a consistent trend of increasing net income over the last three fiscal years as it scales its global footprint and account numbers.
According to its December 2025 balance sheet, the company maintained a debt-to-equity ratio of nearly 0.0x. This indicates that Interactive Brokers carries very little debt relative to its shareholder equity. The firm also reported a current ratio of approximately 1.1x and generated an impressive $15.7 billion in free cash flow, defined as cash from operations minus capital expenditures, providing significant liquidity for its global operations.
Risk profile comparison
Robinhood Markets faces significant regulatory and legislative scrutiny regarding its payment for order flow and cryptocurrency practices. The company also deals with risks from rapid operational expansion and its heavy reliance on third-party liquidity providers. Furthermore, significant litigation exposure and market systemic risks could impact trading volumes on its platform, specifically regarding the Robinhood 24 Hour Market.
Interactive Brokers Group operates in a highly competitive industry where research-driven firms like Morningstar (NASDAQ:MORN) and other electronic brokerages put constant pressure on commission-based revenue. The firm is exposed to clearing and execution risks, including potential credit losses from customer margin loans and counterparty defaults. Additionally, the company relies heavily on proprietary technology, making it vulnerable to system failures or cybersecurity threats that could disrupt its global trading services.
Valuation comparison
Interactive Brokers Group offers a lower Forward P/E, which measures market price against future earnings estimates, while Robinhood Markets carries a higher P/S ratio. The P/S ratio evaluates market capitalization relative to sales over the past twelve months.
Valuation metrics include sourcing from Financial Modeling Prep (FMP) and may differ from other data providers.
Which stock would I buy for 2027?
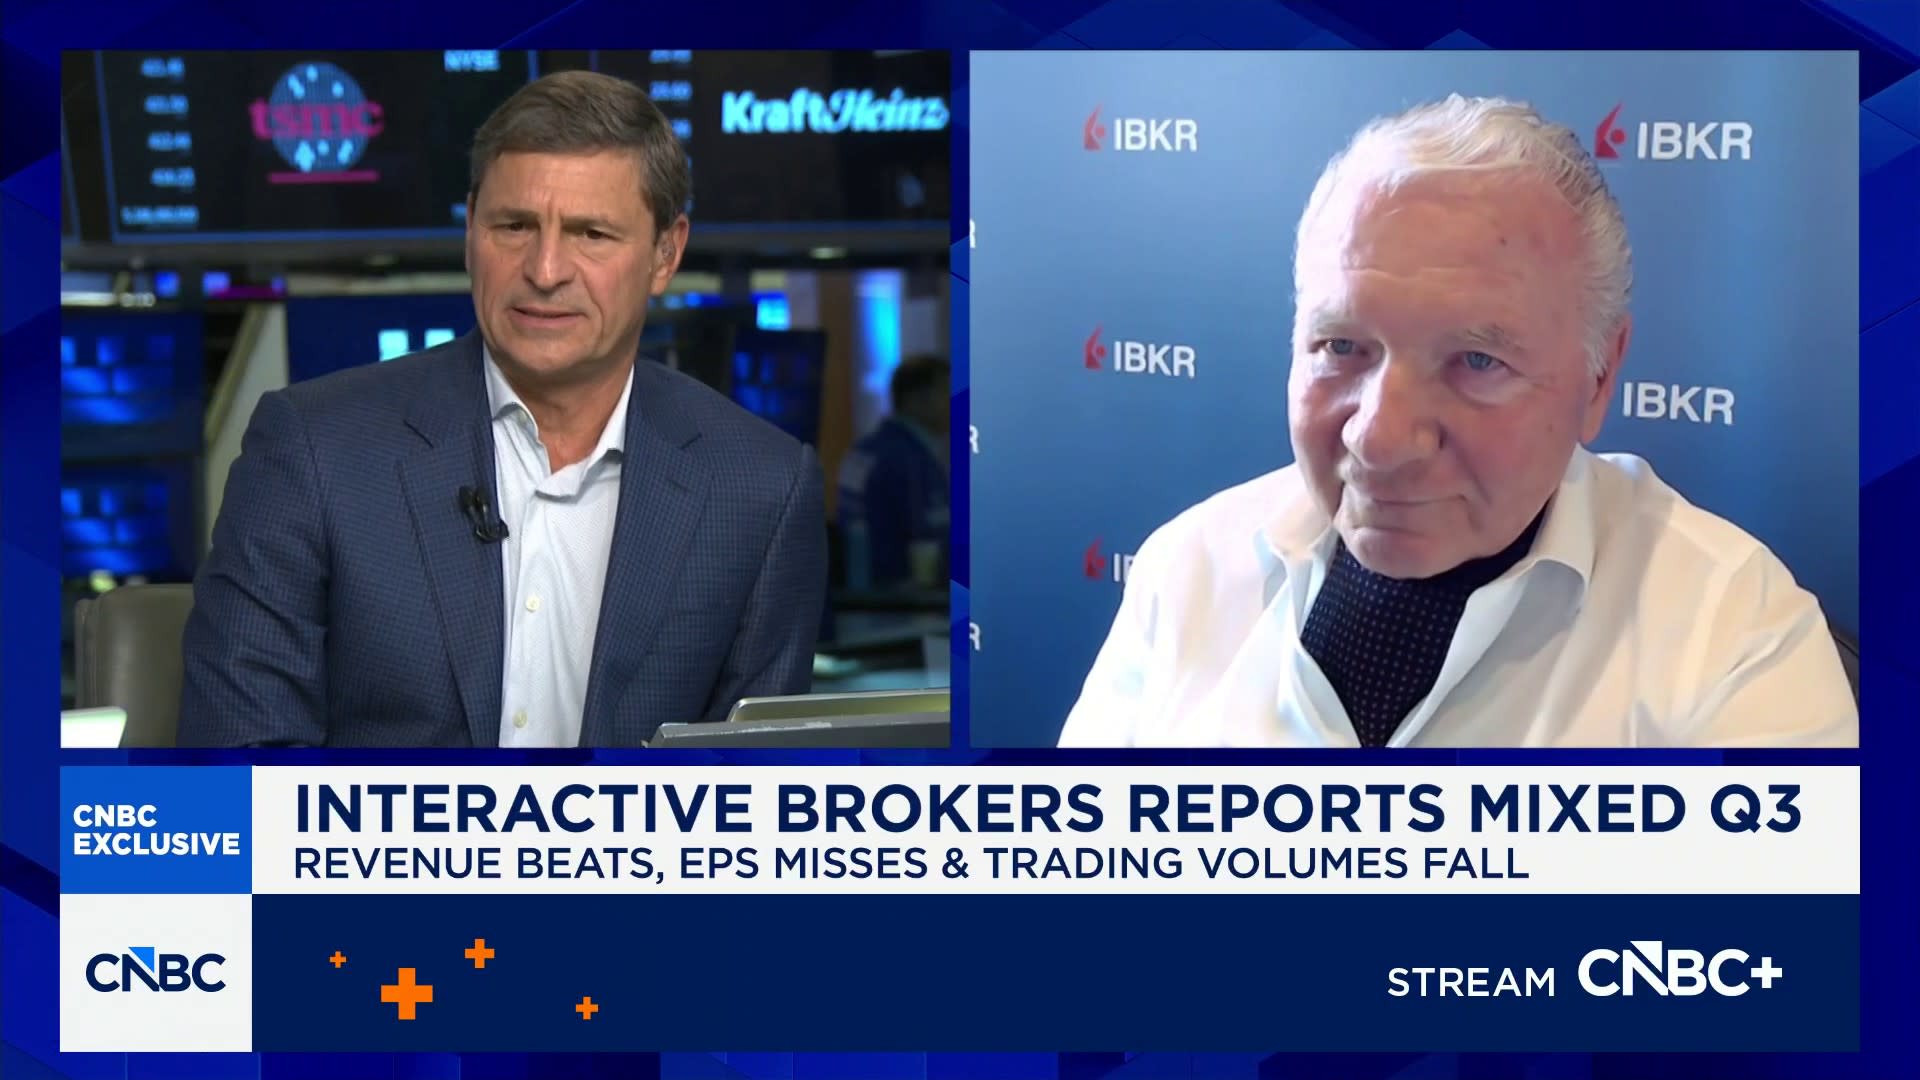
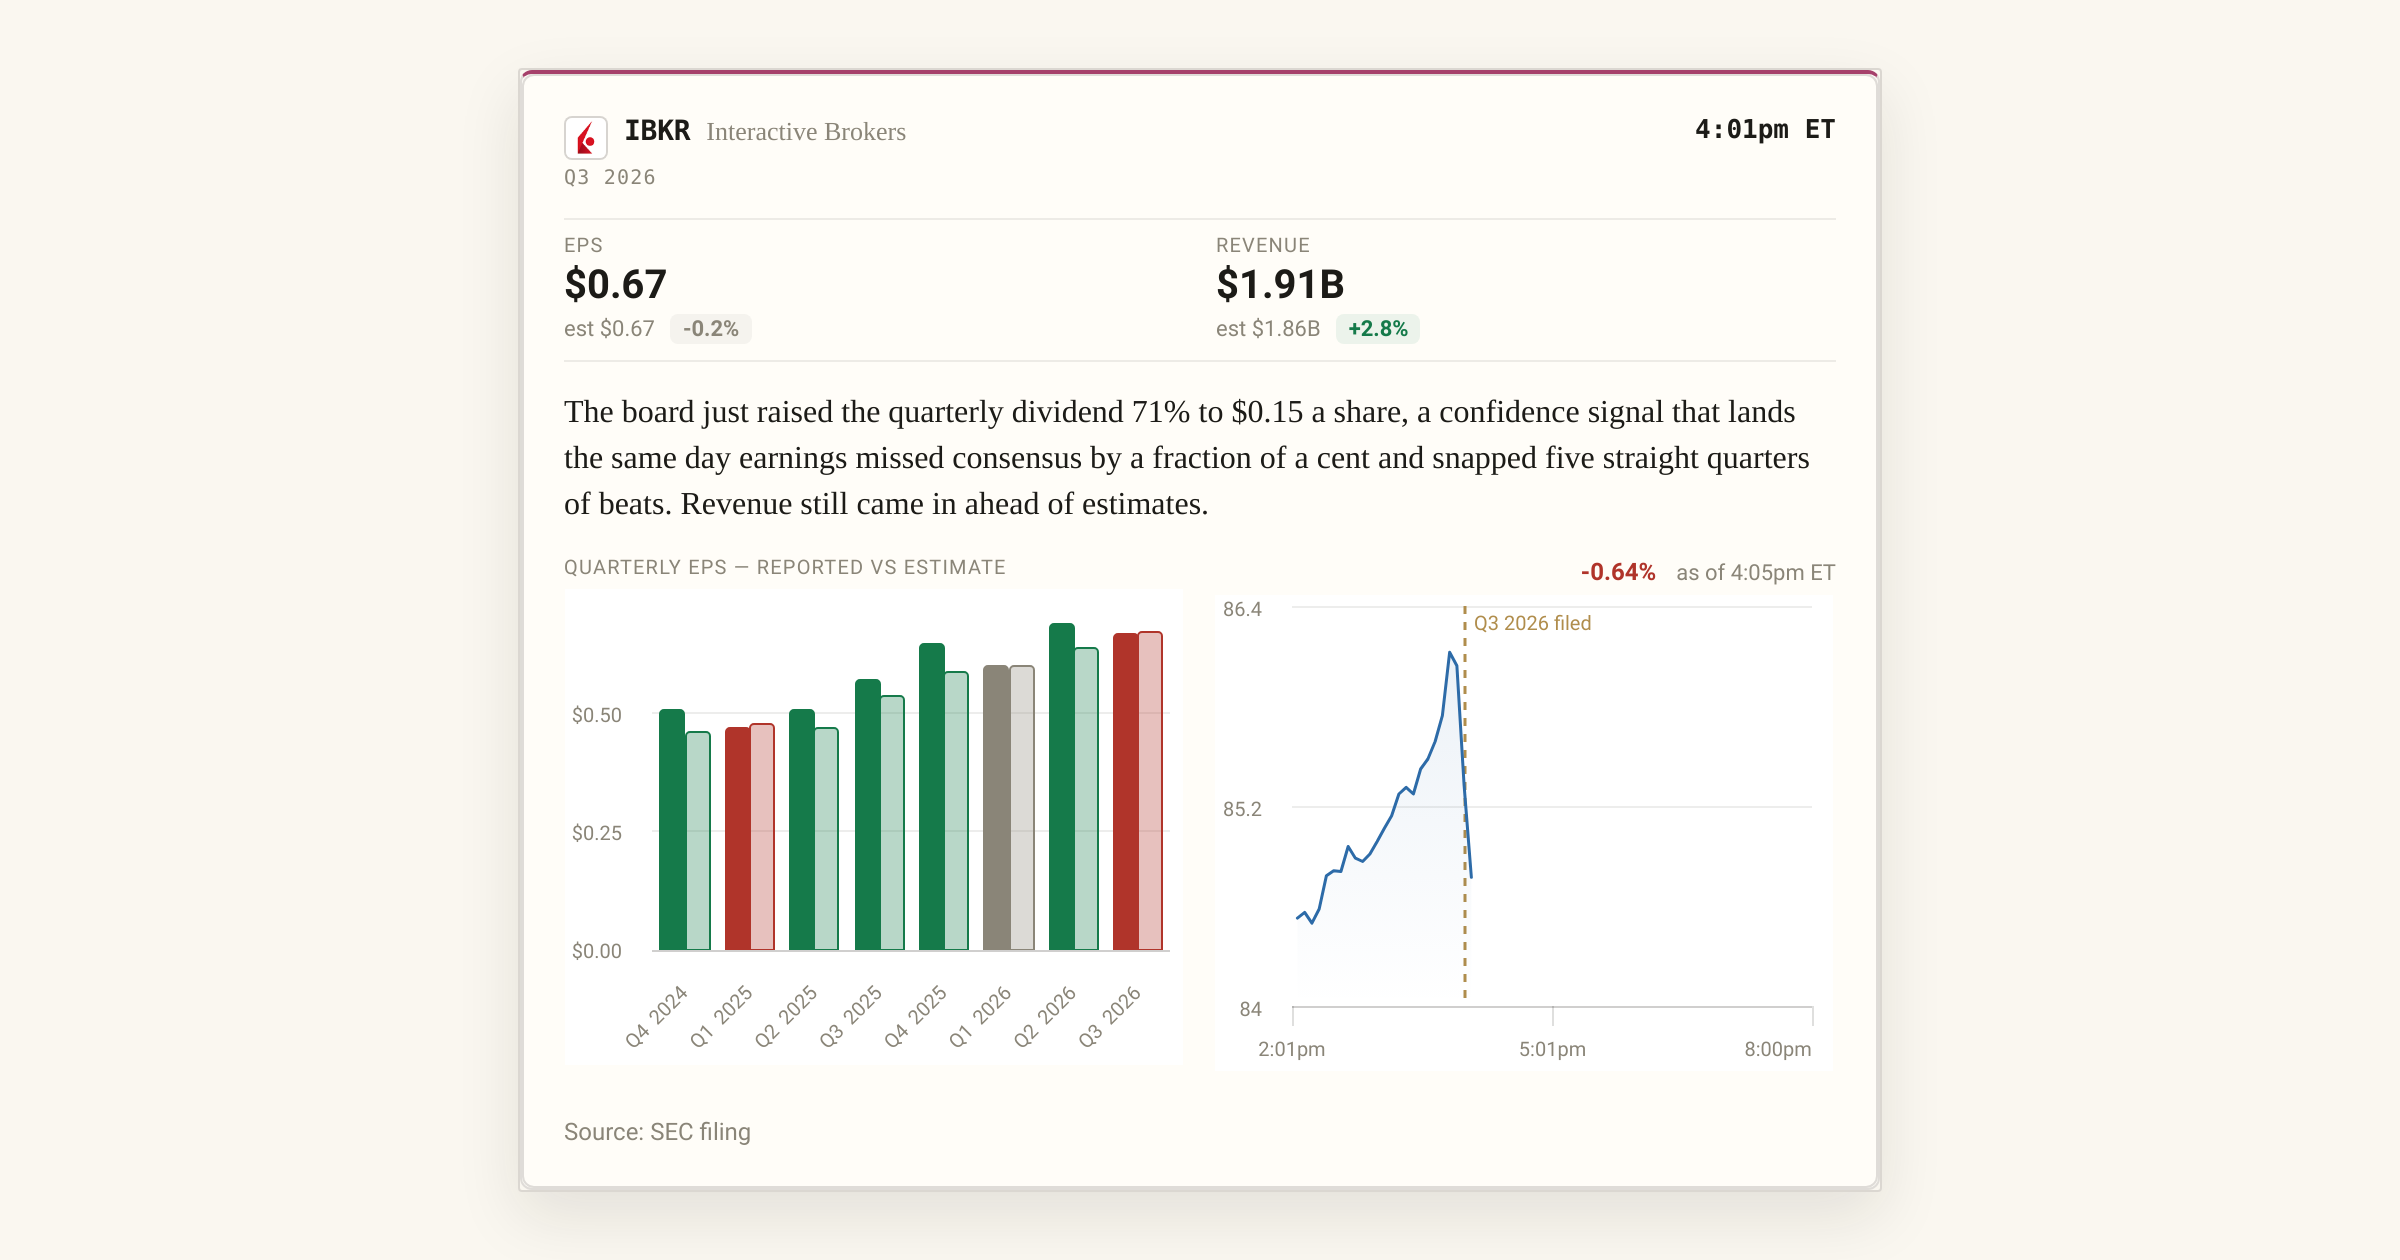
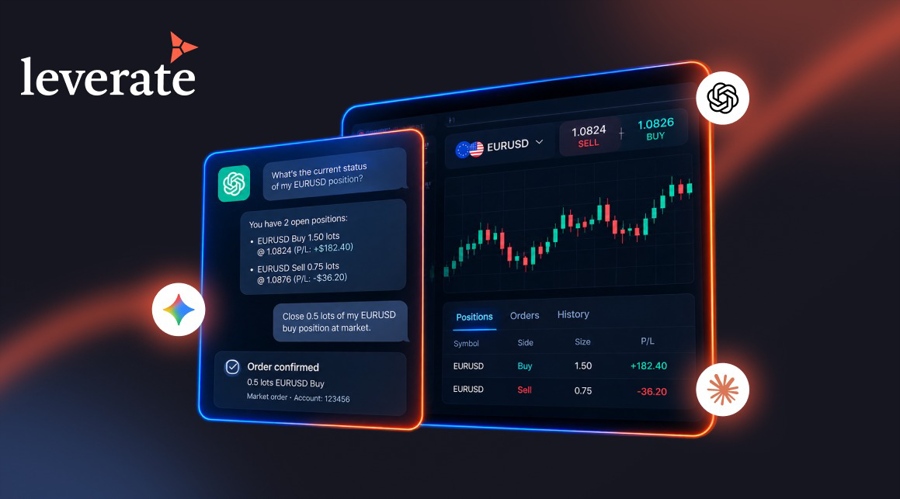
I’d go with Interactive Brokers. What tipped it for me is that it is adding customer accounts faster than Robinhood while keeping far more of its revenue as profit, a good balance of growth and stability. In Q3 2026, Interactive Brokers posted record pretax income at a 78% margin, and customer accounts grew 35% from a year earlier. It also raised its dividend and is testing AI agents that can trade on a customer’s behalf.
To give Robinhood its due, its offerings continue to grow. Q3 2026 revenue hit a record as prediction markets and banking caught on with customers. But crypto revenue fell by more than half and earnings per share declined, which weighed on the stock.
For investors thinking in years rather than quarters, a broker that continues to add customers while remaining profitable has room to reward shareholders for a long time. With no debt to repay, Interactive Brokers is built to keep doing that even when markets turn rough.
Should you buy stock in Robinhood Markets right now?
Before you buy stock in Robinhood Markets, consider this:
The Motley Fool Stock Advisor analyst team just identified what they believe are the 10 best stocks for investors to buy now… and Robinhood Markets wasn’t one of them. The 10 stocks that made the cut could produce monster returns in the coming years.
Consider when Netflix made this list on December 17, 2004… if you invested $1,000 at the time of our recommendation, you’d have $334,793!* Or when Nvidia made this list on April 15, 2005… if you invested $1,000 at the time of our recommendation, you’d have $1,257,420!*
Now, it’s worth noting Stock Advisor’s total average return is 874% — a market-crushing outperformance compared to 209% for the S&P 500. Don’t miss the latest top 10 list, available with Stock Advisor, and join an investing community built by individual investors for individual investors.
See the 10 stocks »
*Stock Advisor returns as of November 2, 2026.
Sara Appino has no position in any of the stocks mentioned. The Motley Fool has positions in and recommends Interactive Brokers Group. The Motley Fool recommends Robinhood Markets and recommends the following options: long January 2027 $43.75 calls on Interactive Brokers Group and short January 2027 $46.25 calls on Interactive Brokers Group. The Motley Fool has a disclosure policy.
Robinhood Markets vs. Interactive Brokers: Which Financial Stock Is a Better Buy for 2027? was originally published by The Motley Fool