Investors often weigh the benefits of specialized financial platforms against broad consumer networks. Comparing Interactive Brokers Group (NASDAQ:IBKR) and PayPal (NASDAQ:PYPL) offers a clear look at two distinct paths for potential long-term growth.
Interactive Brokers serves professional traders and institutions with a high-tech, low-cost execution model. PayPal dominates the consumer wallet and merchant checkout space globally. While both operate as fintech platforms, they cater to different corners of the economy, making the choice a matter of prioritizing trading volume or payment velocity.
The case for Interactive Brokers Group
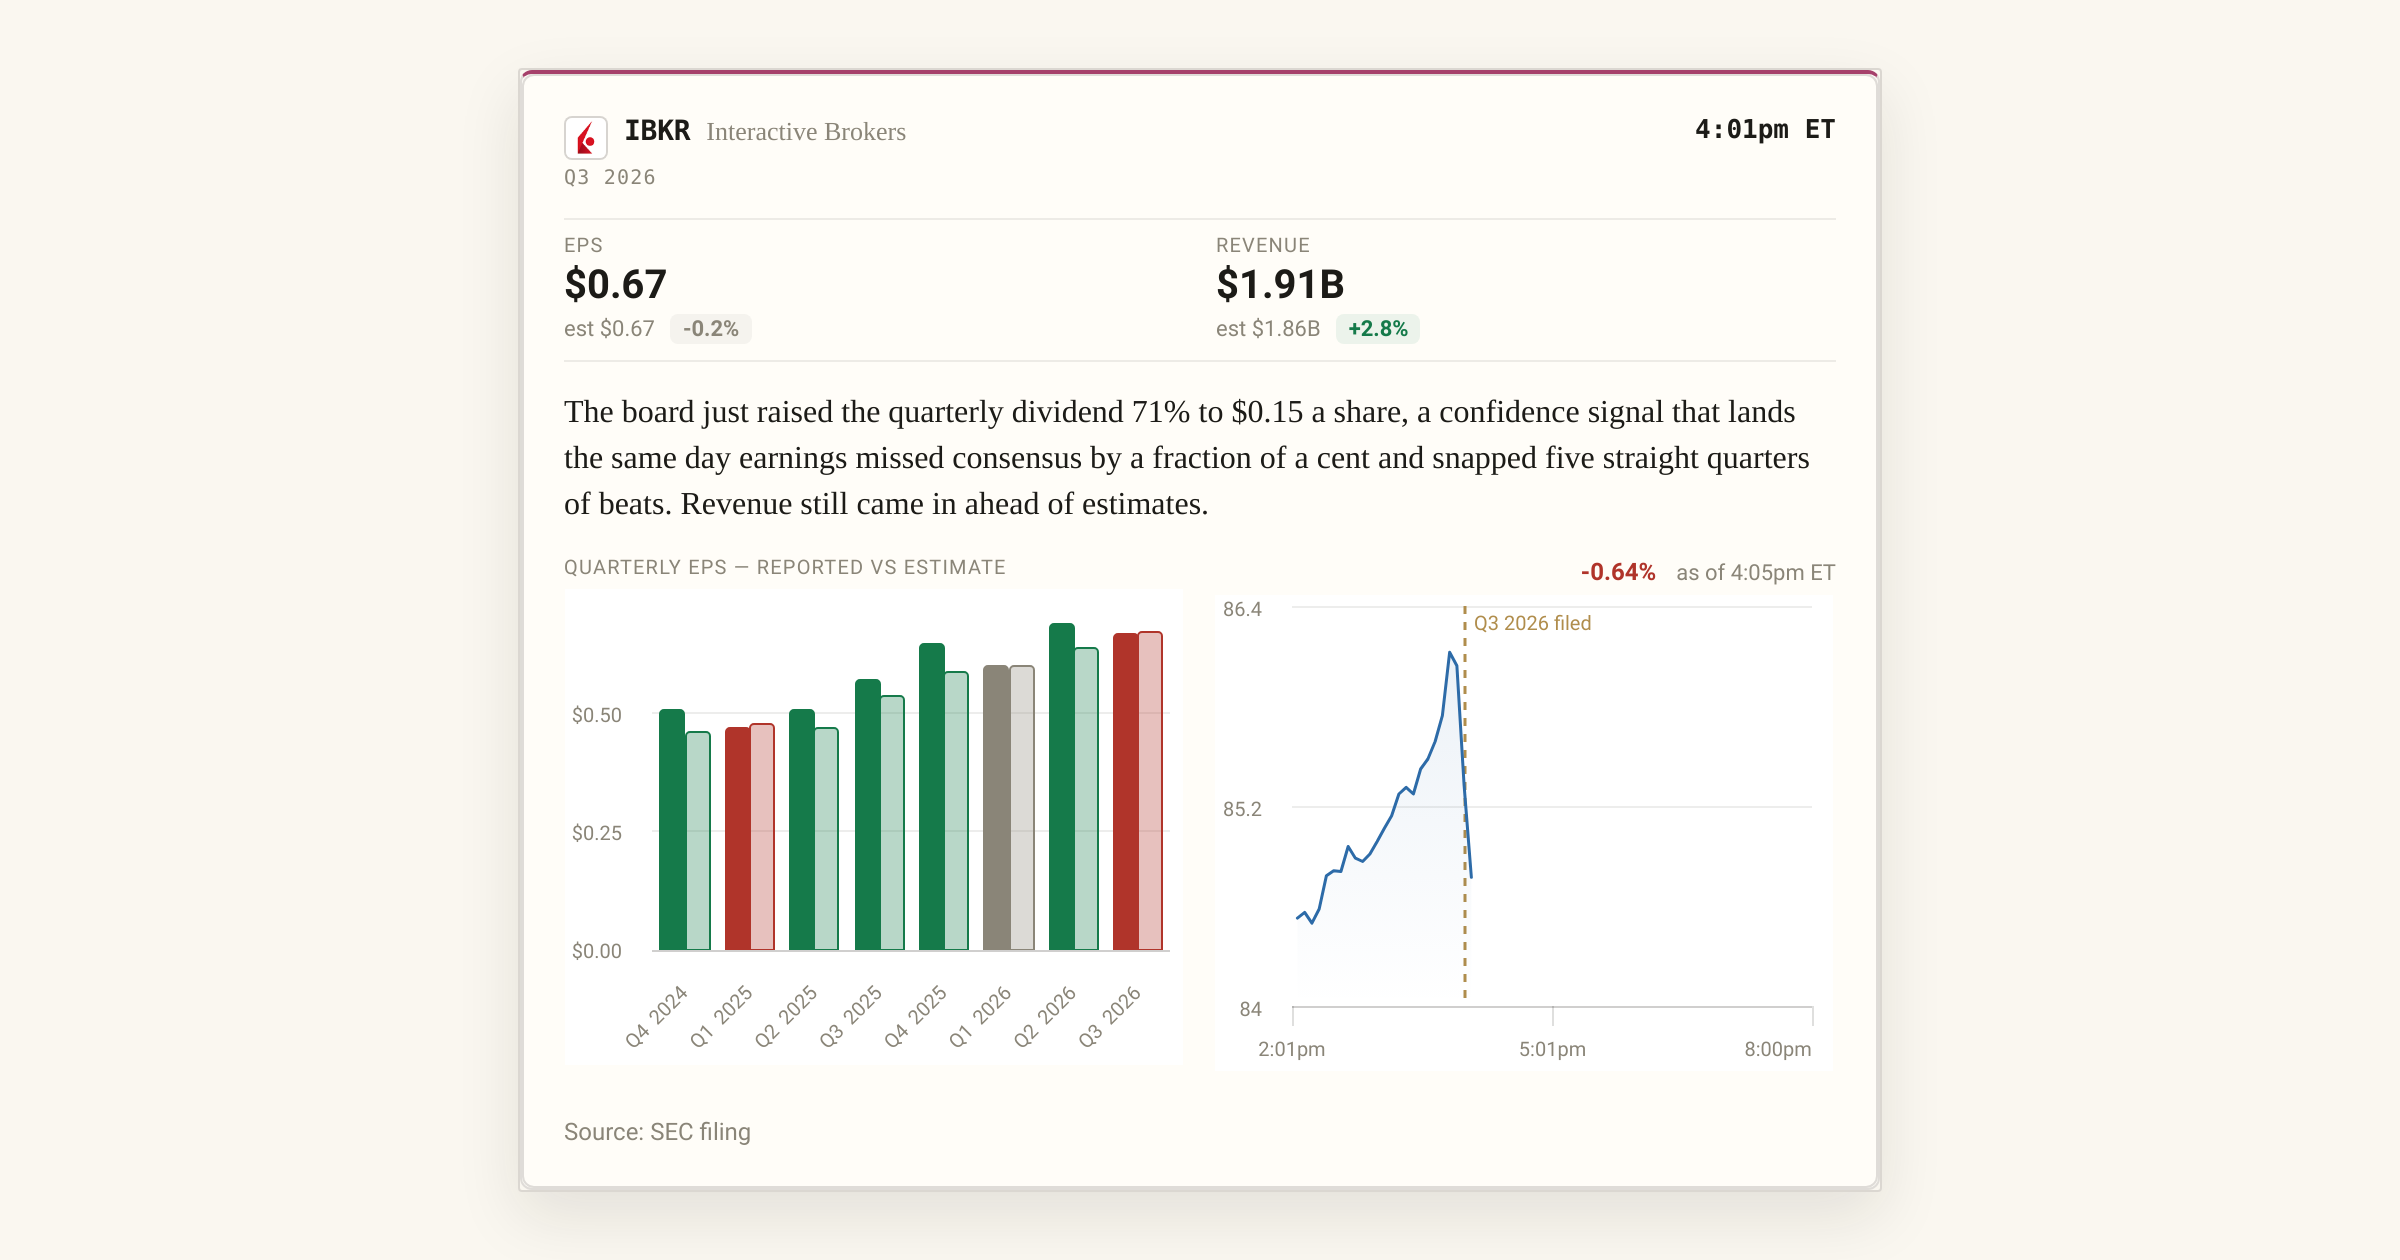
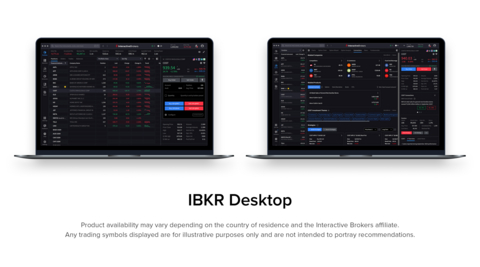
Interactive Brokers Group occupies a specific high-tech niche among financial stocks by focusing on automated trade execution and clearing. It provides a global brokerage platform that supports assets in more than 200 countries and territories. Key customers include hedge funds, proprietary trading groups, and individual investors who require advanced tools to manage portfolios in 29 different currencies.
In its latest annual report, filed for fiscal 2025, revenue reached nearly $6.2 billion, representing growth of roughly 19.7% over the previous year. This expansion helped generate net income of close to $984 million. The company reported a net margin of approximately 15.9%, benefiting from its highly scalable technology infrastructure.
As of Interactive Brokers’ December 2025 balance sheet, the debt-to-equity ratio is 0, meaning the company carries no total debt. The current ratio, which measures a company’s ability to cover short-term liabilities with short-term assets, is roughly 1.1. Free cash flow, or cash from operations minus capital expenditures, reached nearly $15.7 billion in fiscal 2025.
The case for PayPal
PayPal operates as a massive global digital payment platform for consumers and merchants alike. It manages a two-sided network with roughly 439 million active accounts across approximately 200 global markets as of December 2025. The company provides everything from branded checkout solutions to merchant financing for businesses of all sizes, including specialized products like PayPal Working Capital.
For fiscal 2025, revenue reached nearly $33.2 billion, reflecting growth of roughly 4.3% over the prior year. Net income for the year was close to $5.2 billion. During this time frame, PayPal achieved a net margin of approximately 15.8%, driven by transaction fees and a variety of value-added services for its merchant partners.
As of its December 2025 balance sheet, the debt-to-equity ratio was approximately 0.5. PayPal reported a current ratio of roughly 1.3 and generated nearly $5.6 billion in free cash flow during fiscal 2025.
Risk profile comparison
Interactive Brokers Group faces risks from market volatility and its heavy reliance on proprietary trading software. Any system failure could lead to significant trading losses or damage its reputation with institutional clients. The company also competes with large financial institutions and zero-commission brokers in a crowded market that subjects it to ongoing pricing pressure.
PayPal faces intense competition in the global payments industry from established banking institutions and newer fintech platforms. It must navigate complex global regulations regarding lending and data privacy, which can impose significant compliance costs. The company also depends on third-party card networks, which could increase transaction fees or change rules that negatively impact financial performance.
Valuation comparison
PayPal appears to be the more value-oriented choice because its forward P/E ratio, which compares price to future earnings estimates, is significantly lower than its peer’s.
Valuation metrics include sourcing from Financial Modeling Prep (FMP) and may differ from other data providers.
Which stock would I buy for 2027?
It’s evident based on PayPal’s forward P/E that investors do not have especially high hopes for the company’s future growth. Indeed, its single-digit revenue growth last year compares unfavorably with Interactive Brokers’ nearly 20% gain.
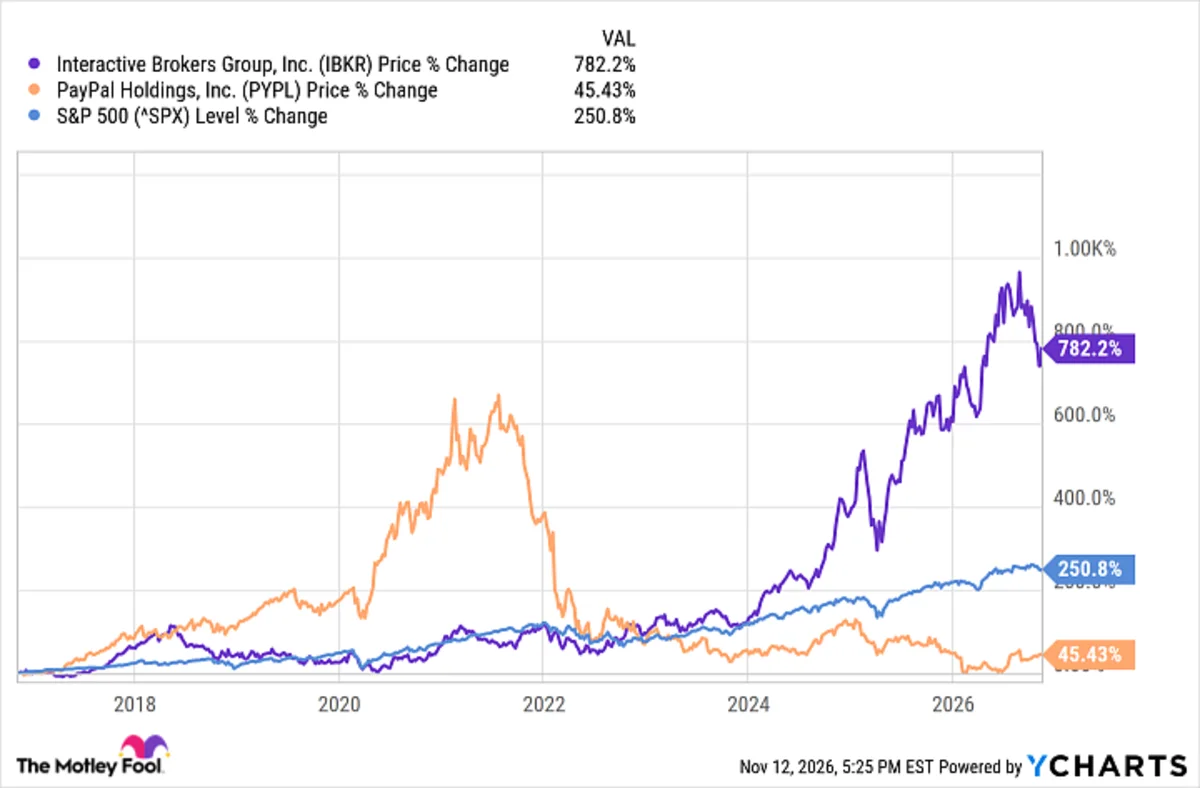
Now, let’s look at these stocks’ historical performance:
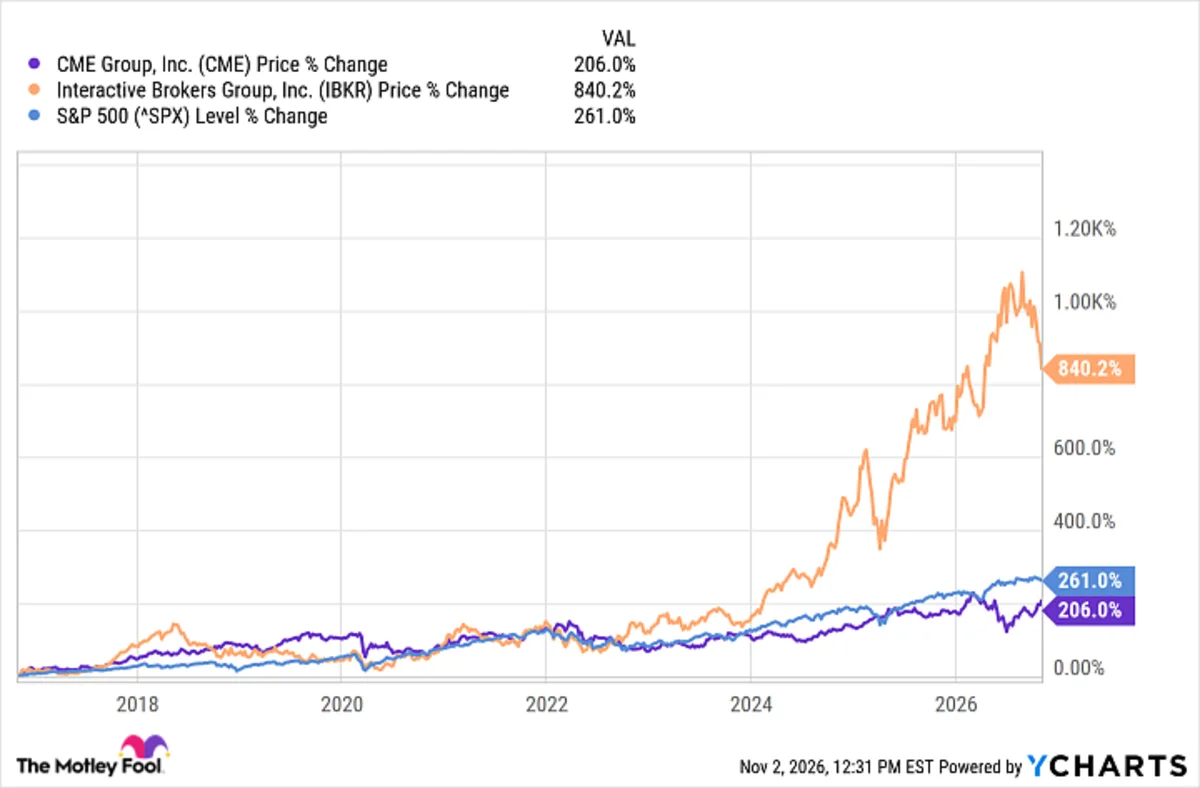
Over the past 10 years, apart from a sharp spike in 2021, PayPal’s stock has barely kept pace with inflation, much less the S&P 500. Interactive Brokers’ shares gained over 700 percentage points more than those of the digital payments specialist.
Investors know past performance is no guarantee of future results; PayPal’s next decade might look very different. But there doesn’t seem to be an obvious catalyst or tailwind that will propel the stock higher. I don’t have a crystal ball, but I think Interactive Brokers looks like the better bet for 2027 and beyond.
Should you buy stock in Interactive Brokers Group right now?
Before you buy stock in Interactive Brokers Group, consider this:
The Motley Fool Stock Advisor analyst team just identified what they believe are the 10 best stocks for investors to buy now… and Interactive Brokers Group wasn’t one of them. The 10 stocks that made the cut could produce monster returns in the coming years.
Consider when Netflix made this list on December 17, 2004… if you invested $1,000 at the time of our recommendation, you’d have $348,060!* Or when Nvidia made this list on April 15, 2005… if you invested $1,000 at the time of our recommendation, you’d have $1,067,492!*
Now, it’s worth noting Stock Advisor’s total average return is 849% — a market-crushing outperformance compared to 210% for the S&P 500. Don’t miss the latest top 10 list, available with Stock Advisor, and join an investing community built by individual investors for individual investors.
Erin Kennedy has no position in any of the stocks mentioned. The Motley Fool has positions in and recommends Interactive Brokers Group and PayPal. The Motley Fool recommends the following options: long January 2027 $43.75 calls on Interactive Brokers Group, short December 2026 $62.50 calls on PayPal, and short January 2027 $46.25 calls on Interactive Brokers Group. The Motley Fool has a disclosure policy.