
Margin borrowing provided the stronger financial signal. Client margin loans climbed to $105.2 billion, up 36% from a year earlier and 4% from August, while client credit balances rose 20% annually to $186.2 billion. The figures continue the pattern seen in Interactive Brokers’ August brokerage metrics, when accounts were also rising considerably faster than trading activity.
Are New Accounts Trading Less Frequently?
Interactive Brokers reported 159 annualized average cleared DARTs per client account in September, down from 168 in August. That decline matters because headline account growth alone does not show how intensively those customers use the platform.
The firm added roughly 116,000 accounts during September, taking the total from 5.460 million to 5.576 million. Client equity, however, increased only slightly from August’s $962.8 billion, meaning assets did not grow at the same pace as the account base during the month.
The divergence does not necessarily indicate weaker customer quality. New accounts generally take time to fund and become active, while monthly DARTs are affected by volatility and the number of trading days. But the trend makes trading activity per account increasingly important as Interactive Brokers scales beyond five million customers.
Earlier in 2026, the broker was showing stronger alignment between assets and trading. FinanceFeeds reported that April client equity rose 48% year over year, while DARTs increased 11% and accounts expanded 31%.
Investor Takeaway
Interactive Brokers continues to acquire customers rapidly, but account growth is currently running well ahead of transaction growth. Investors should watch whether those newer accounts become more active or whether the platform increasingly shifts toward a larger but less transaction-intensive client mix.
Why Does the $105 Billion Margin Loan Balance Matter?
Client margin loans reached a new $105.2 billion level after increasing from $101.5 billion in August. The 36% annual increase also exceeded the 27% rise in client equity and the 20% growth in credit balances.
That matters because Interactive Brokers earns interest from money lent to customers, making margin balances an important component of its revenue mix. In the first quarter, net interest income rose 17% to $904 million, supported partly by higher average customer margin loans and credit balances.
September therefore shows two different forces working through the brokerage model. Transaction activity softened from August, potentially limiting commission growth sequentially, while the balance of interest-generating margin loans continued to expand.
The increase also raises leverage exposure. Margin loans represented roughly 10.9% of client equity at the end of September, compared with about 10.5% in August. That remains only one measure of customer leverage, but the direction shows borrowing rising faster than the asset base during the month.
Investor Takeaway
Margin lending is becoming a larger part of the September story than trading growth. Higher borrowing can support interest income, but faster loan growth also makes client balances more sensitive to market declines, margin requirements and changes in borrowing demand.
What Do September’s Trading Costs Show?
Interactive Brokers reported an average commission of $2.57 per cleared commissionable order, including exchange, clearing and regulatory charges. Stock orders averaged $1.94 on 656 shares, equity options averaged $3.67 on 6.2 contracts, and futures averaged $4.36 on 3.1 contracts.
For IBKR Pro customers trading U.S. Reg NMS stocks, the all-in cost of execution and clearing was approximately 1.2 basis points of trade value against a daily VWAP benchmark, down from 2.1 basis points in August. The rolling 12-month average remained 2.5 basis points.
Maintaining competitive execution costs is particularly relevant as Interactive Brokers broadens the range of products available to its growing customer base. The firm has recently expanded beyond its traditional multi-asset offering, including a unified prediction-market interface spanning Kalshi, CME Group and ForecastEx.
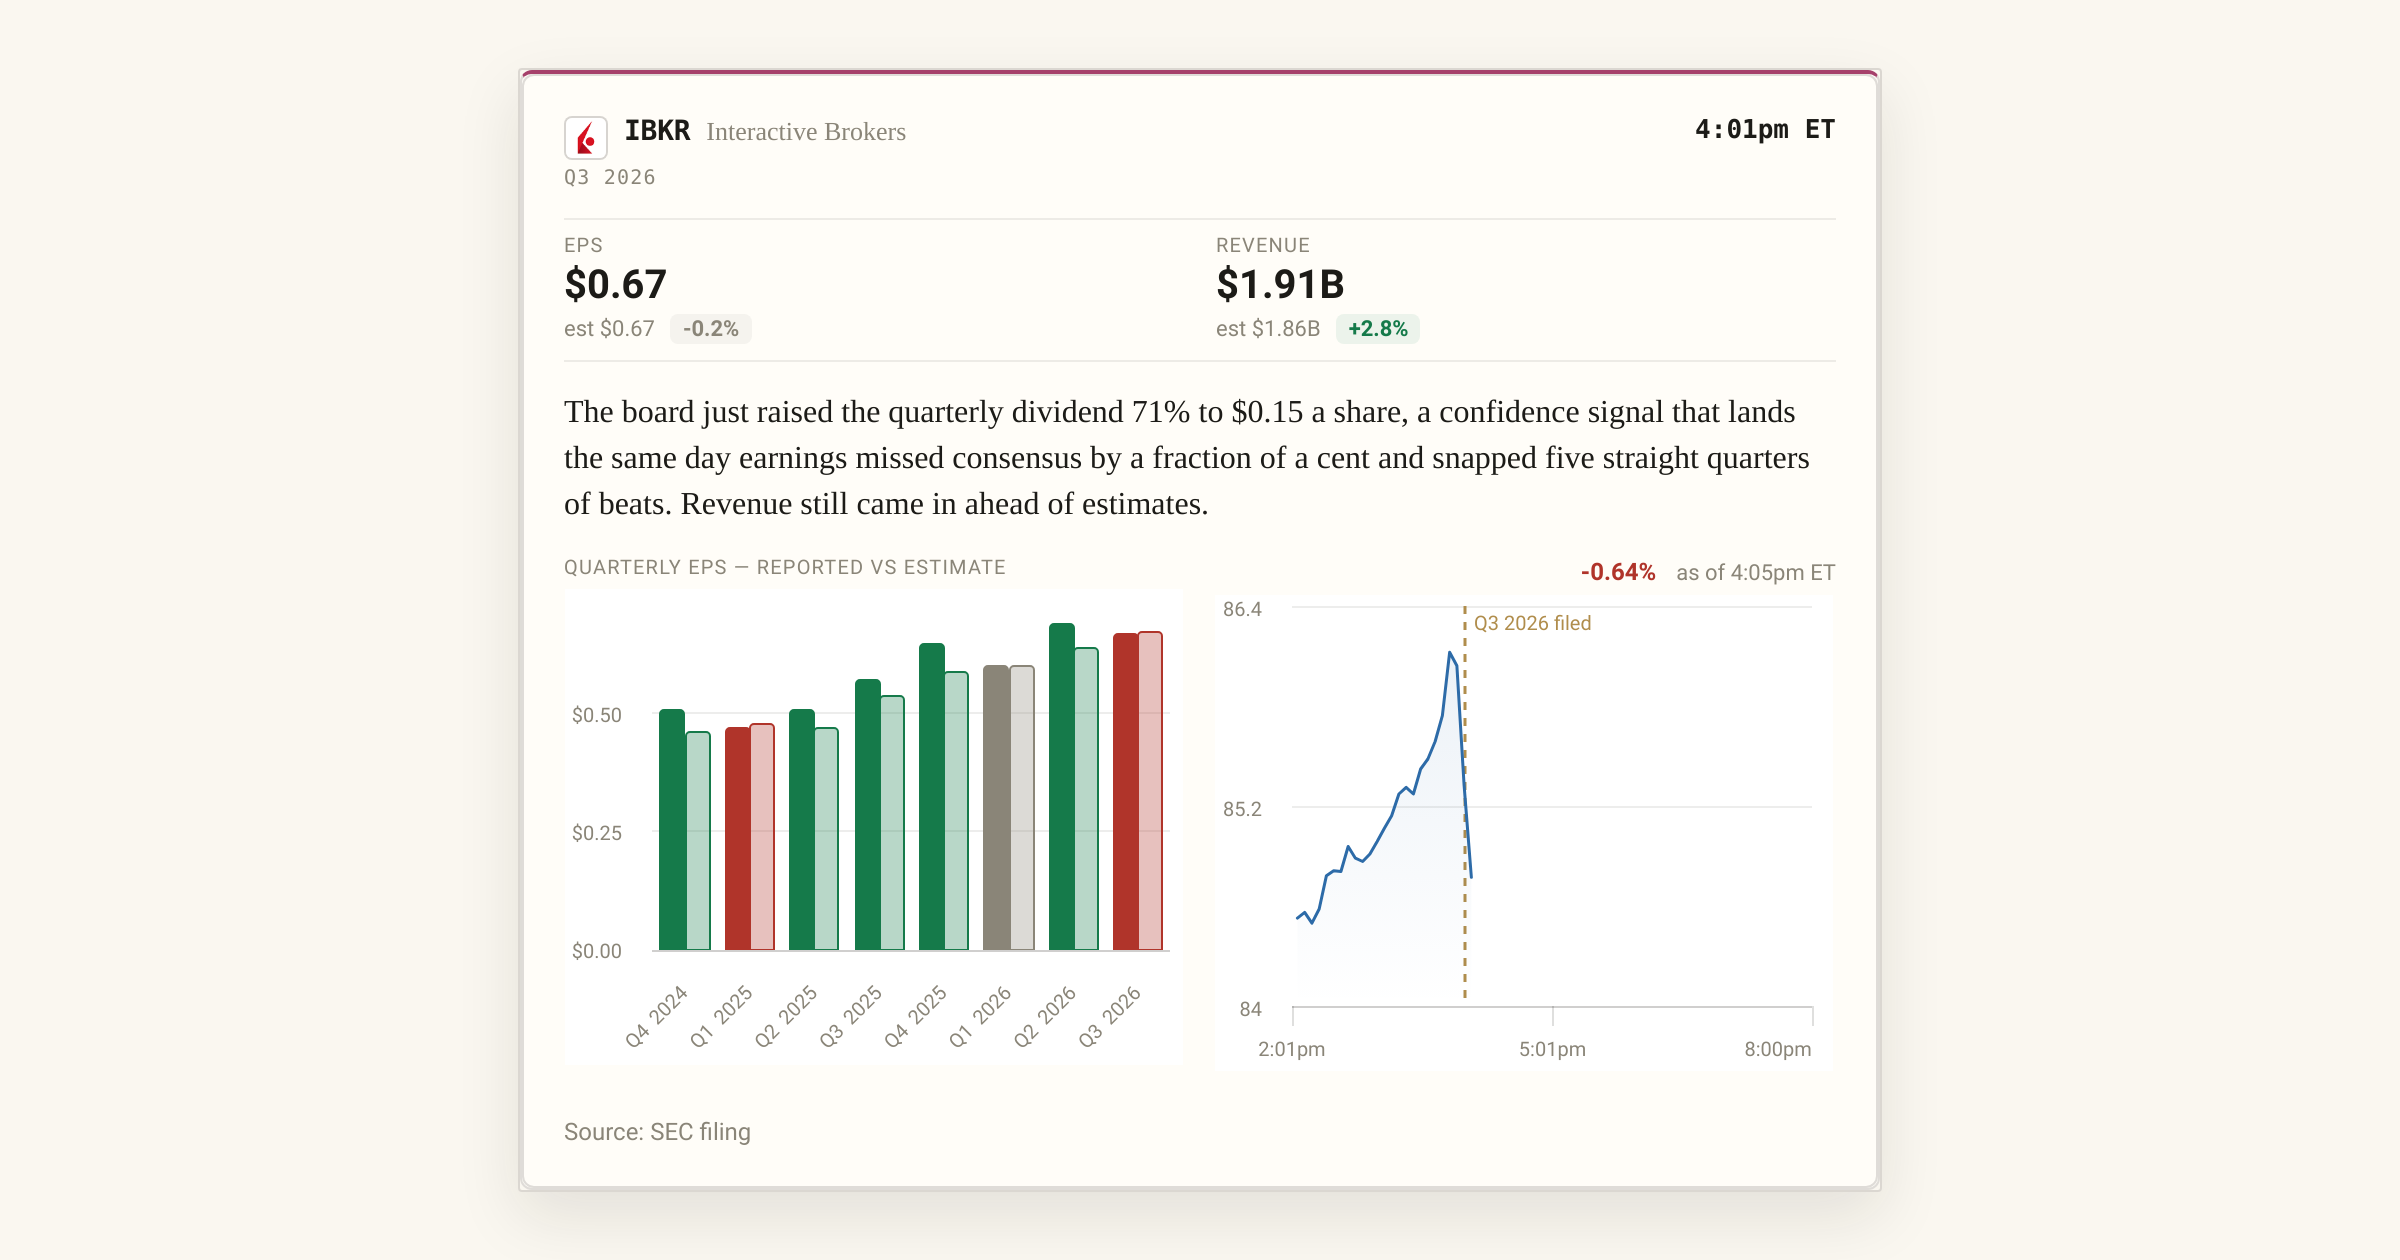
The next fuller test comes with third-quarter earnings on Oct. 15. September’s operating data point to continued customer and balance-sheet growth, but the earnings release should show how weaker sequential trading activity and higher margin borrowing translated into commissions and net interest income across the quarter.
Investor Takeaway
The September numbers reinforce Interactive Brokers’ two-engine revenue model: trading generates commissions, while large client cash and margin balances support interest income. Q3 results will show whether faster balance-sheet growth was enough to offset the moderation in trading activity entering quarter-end.