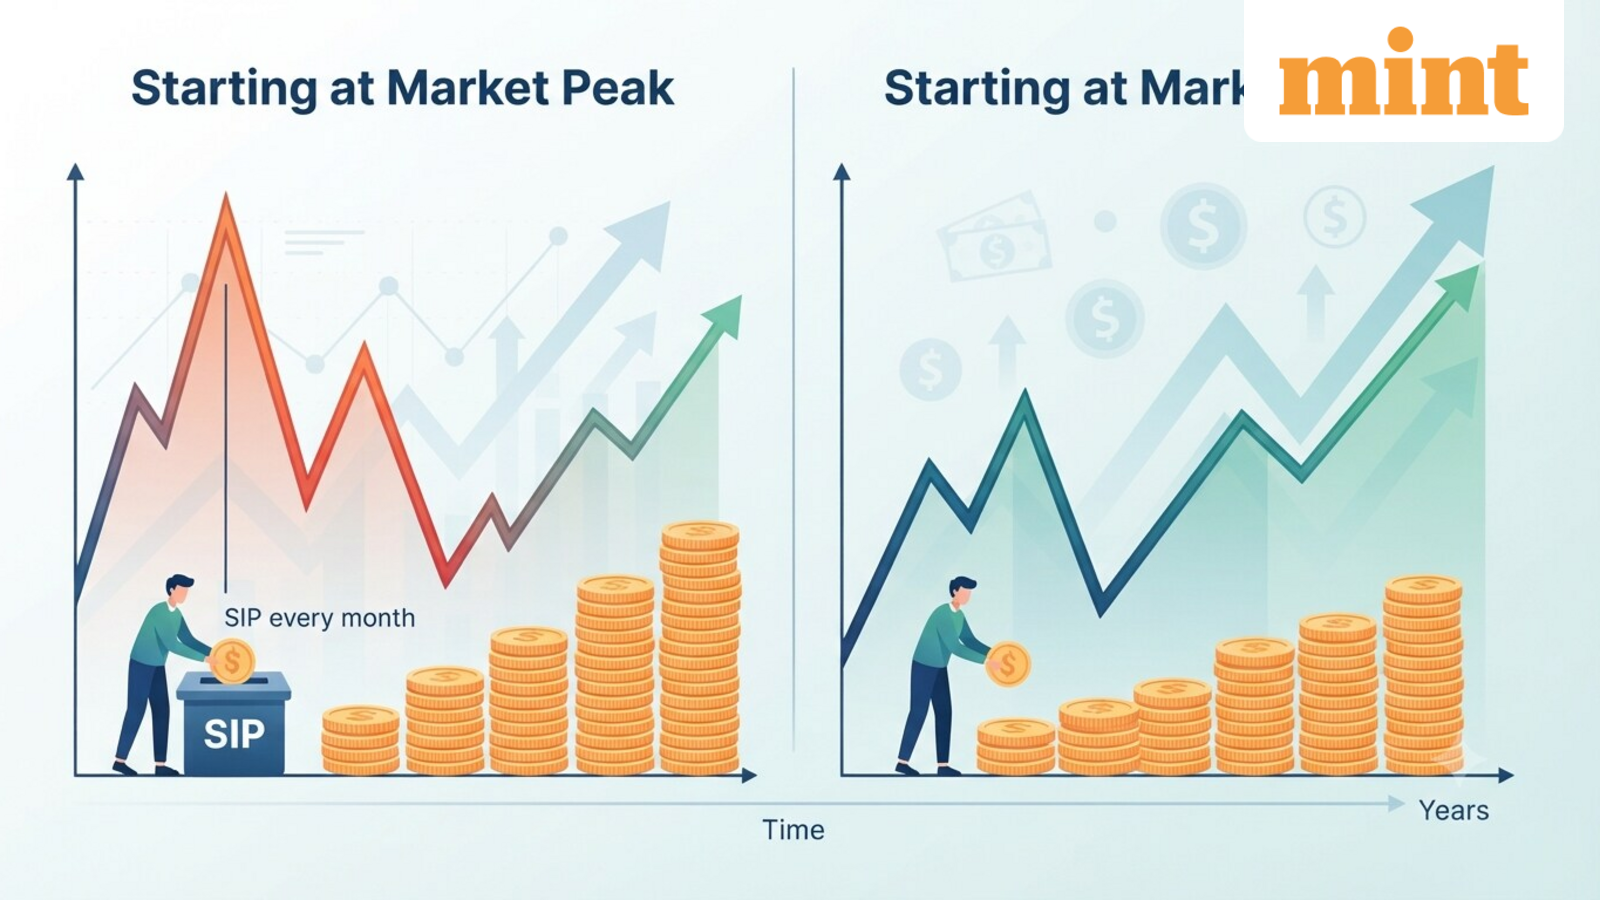
Starting a mutual fund systematic investment plan (SIP) when markets are falling may seem like the ideal way to maximise returns. Investors often wait for a correction before committing money to equities, hoping to buy more units at lower prices. But waiting for the market to bottom can also mean missing months or years of potential investment growth.
A November 2026 analysis by WhiteOak Capital Mutual Fund, based on more than 29 years of BSE Sensex total return index (TRI) data, examines whether investors who begin SIPs at market bottoms actually gain an advantage over those who start at market peaks.
The analysis suggests that while investors starting at market bottoms may earn marginally higher annualised returns in some periods, those who start earlier can accumulate a larger corpus because they invest for longer.
Do SIPs started at market bottoms deliver better returns?
WhiteOak examined nine market correction cycles in which the Sensex fell more than 20% from its peak. It compared two hypothetical investors who started a monthly SIP of ₹10,000, one at the market peak and the other at the subsequent bottom. Their investments were tracked until 31 October 2026.
The comparison shows that the investor who started at the bottom did not necessarily build a larger corpus, even when the annualised return was marginally higher.
The January 2008 peak and March 2009 bottom example illustrates this. The investor who began a ₹10,000 monthly SIP in January 2008 had invested ₹22.60 lakh by October 2026. The investment was worth ₹72.30 lakh, delivering an XIRR of 11.19%.
The investor who waited until March 2009 to start the same SIP had invested ₹21.20 lakh. The portfolio value stood at ₹62.12 lakh, with an XIRR of 11.12%.
|
Particulars |
January 2008 peak |
March 2009 bottom |
| Monthly SIP | ₹10,000 | ₹10,000 |
| Amount invested | ₹22.60 lakh | ₹21.20 lakh |
| Value as on 31 Oct 2026 | ₹72.30 lakh | ₹62.12 lakh |
| XIRR | 11.19% | 11.12% |
| Source: WhiteOak Capital Mutual Fund. Based on BSE Sensex TRI data. | ||
The investor who started earlier accumulated ₹10.17 lakh more, despite the later investor entering after a market correction. The difference in annualised returns was just 0.07 percentage points.
What happened across other market cycles?
The report’s comparison of all nine correction cycles shows that the investor starting at the bottom generally earned a marginally higher XIRR. However, the investor who started at the peak had a higher final portfolio value in several of the longer-duration comparisons.
The following examples show how the outcomes differed across market cycles.
|
Market cycle |
SIP started at peak |
SIP started at bottom |
Difference in final value |
| September 1996 to December 1996 | ₹396.10 lakh | ₹383.82 lakh | ₹12.28 lakh |
| August 1997 to October 1998 | ₹357.43 lakh | ₹312.68 lakh | ₹44.75 lakh |
| February 2000 to September 2001 | ₹264.42 lakh | ₹215.04 lakh | ₹49.39 lakh |
| January 2008 to March 2009 | ₹72.30 lakh | ₹62.12 lakh | ₹10.17 lakh |
| January 2020 to March 2020 | ₹10.75 lakh | ₹10.41 lakh | ₹0.34 lakh |
| All values are in lakh and represent portfolio valuations as on 31 October 2026. Each investor started a ₹10,000 monthly SIP at the respective market-cycle point. | |||
All values are in lakh and represent portfolio valuations as on 31 October 2026. Each investor started a ₹10,000 monthly SIP at the respective market-cycle point. Figures are from selected cycles in WhiteOak’s analysis.
The January 2020 and March 2020 comparison is particularly revealing. The investor who started at the January 2020 peak earned an XIRR of 7.88%, compared with 7.91% for the investor who began at the March 2020 bottom. The difference in returns was only 0.03 percentage points, while the difference in final portfolio value was ₹34,000.
What is the cost of waiting for a market correction?
The report highlights that investors who wait for a correction risk losing valuable investment time. The longer the market takes to reach a bottom, the more SIP instalments an investor may miss.
This matters because an SIP spreads investments across different market levels. Investors do not need to identify the exact bottom to benefit from investing regularly through market cycles.
WhiteOak’s analysis also notes that the difference in annualised returns between investors who started at market peaks and those who started at bottoms narrowed across several longer-term comparisons. Its central finding is that the cost of delaying investments can be significant over time.
The analysis does not suggest that market valuations or corrections are irrelevant to investment decisions. However, it highlights the difficulty of consistently identifying market peaks and bottoms.
For investors who have already decided to allocate money to equity mutual funds for long-term goals, waiting indefinitely for the perfect entry point can come at a cost.