Two mutual funds may belong to the same category and have similar long-term returns, yet their portfolios can look very different in terms of valuation. One way to gauge this difference is through the price-to-earnings (P/E) ratio.
The metric provides a view of how the market is valuing the companies held by a fund at a given point in time. While it is not a measure of future performance, it can help investors put a fund’s portfolio into context and compare it with peers.
Let us understand it in detail.
What is the P/E ratio of a mutual fund?
Unlike a company, a mutual fund does not generate earnings of its own. Its P/E ratio is therefore derived from the earnings of the companies it holds in its portfolio. The metric is calculated as the weighted average P/E ratio of all the stocks owned by the fund, with larger holdings having a greater influence on the final figure.
For example, a mutual fund with a portfolio P/E ratio of 30 indicates that its underlying holdings are collectively trading at 30 times their earnings. In other words, investors are paying ₹30 for every ₹1 of earnings generated by the companies in the portfolio.
The ratio provides an indication of the valuation level of a fund’s holdings at a given point in time. Funds with higher P/E ratios tend to hold stocks that command higher market valuations relative to their earnings, while funds with lower P/E ratios generally own stocks trading at lower earnings multiples.
A high P/E isn’t automatically “bad” and a low P/E isn’t automatically “good.” It reflects the investing style and the kind of companies the fund holds.
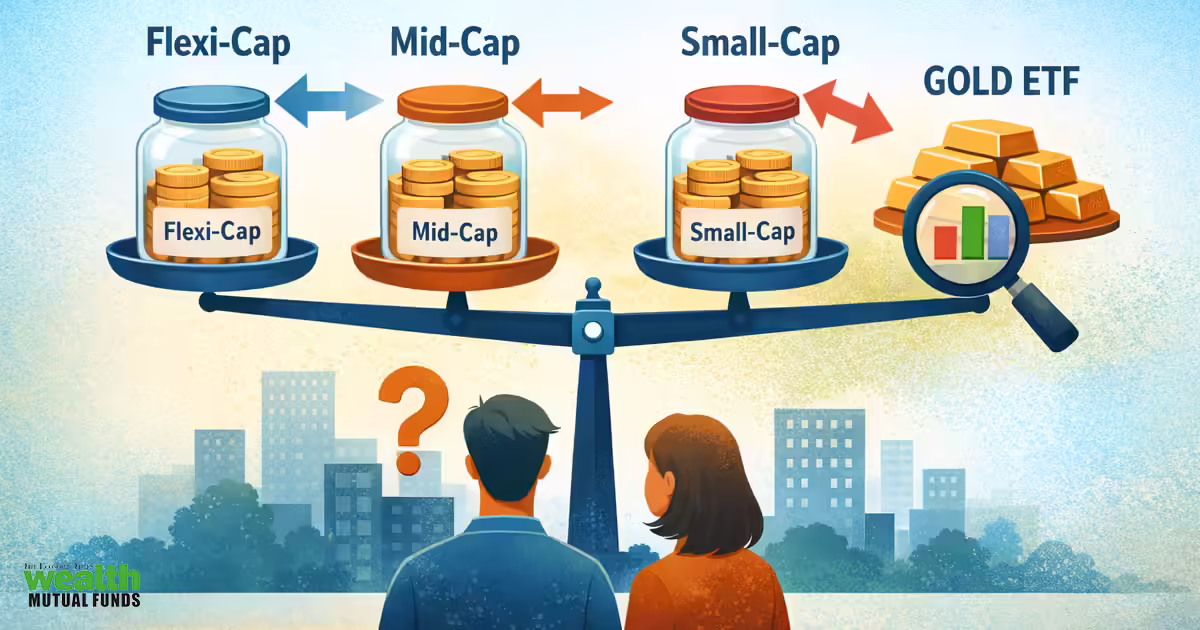
What do P/E ratios of popular mutual funds look like?
P/E ratios of large-cap funds
Among large-cap funds, Invesco India Large Cap Fund has the highest portfolio P/E ratio at 31.6, while LIC MF Large Cap Fund has the lowest at 17.85. The gap between the highest and lowest P/E funds in the category stood at 13.75 points.
|
Highest P/E funds |
P/E Ratio |
Lowest P/E funds |
P/E Ratio |
| Invesco India Large Cap Fund | 31.60 | LIC MF Large Cap Fund | 17.85 |
| Bajaj Finserv Large Cap Fund | 27.44 | DSP Large Cap Fund | 19.66 |
| SBI Large Cap Fund | 26.85 | UTI Large Cap Fund | 19.97 |
| Axis Large Cap Fund | 26.30 | Motilal Oswal Large Cap Fund | 21.08 |
| Franklin India Large Cap Fund | 25.90 | Kotak Large Cap Fund | 21.33 |
| Source: Tickertape | |||
Large-cap funds generally showed a narrower range of valuations compared with mid-cap, small-cap and flexi-cap categories.
P/E ratios of small-cap funds
The small-cap category recorded one of the widest valuation spreads. PGIM India Small Cap Fund topped the list with a P/E ratio of 48.63, while Bandhan Small Cap Fund had the lowest P/E ratio at 18.58.
|
Highest P/E funds |
P/E Ratio |
Lowest P/E funds |
P/E Ratio |
| PGIM India Small Cap Fund | 48.63 | Bandhan Small Cap Fund | 18.58 |
| Invesco India Small Cap Fund | 44.60 | HDFC Small Cap Fund | 21.35 |
| Helios Small Cap Fund | 43.81 | ICICI Pru Small Cap Fund | 23.99 |
| TRUSTMF Small Cap Fund | 42.67 | Mahindra Manulife Small Cap Fund | 25.70 |
| Union Small Cap Fund | 39.88 | Abakkus Small Cap Fund | 26.75 |
| Source: Tickertape | |||
The difference between the highest and lowest P/E ratios in the category exceeded 30 points.
P/E ratios of mid-cap funds
Mid-cap funds featured some of the highest P/E ratios among diversified equity categories. Invesco India Mid Cap Fund reported the highest P/E ratio at 49.39, followed by Bandhan Mid Cap Fund and Helios Mid Cap Fund, both above 45.
|
Highest P/E funds |
P/E Ratio |
Lowest P/E funds |
P/E Ratio |
| Invesco India Mid Cap Fund | 49.39 | HDFC Mid Cap Fund | 25.90 |
| Bandhan Mid Cap Fund | 45.73 | Kotak Mid Cap Fund | 28.15 |
| Helios Mid Cap Fund | 45.54 | ITI Mid Cap Fund | 28.15 |
| Motilal Oswal Mid Cap Fund | 44.92 | DSP Mid Cap Fund | 28.68 |
| SBI Mid Cap Fund | 39.93 | Baroda BNP Paribas Mid Cap Fund | 28.93 |
| Source: Tickertape | |||
At the other end, HDFC Mid Cap Fund had the lowest P/E ratio at 25.9. The gap between the highest and lowest P/E funds in the category stood at more than 23 points.
P/E ratios of flexi-cap funds
Among flexi-cap funds, Motilal Oswal Flexi Cap Fund had the highest portfolio P/E ratio at 44.56, followed by Invesco India Flexi Cap Fund at 40.13.
|
Highest P/E funds |
P/E Ratio |
Lowest P/E funds |
P/E Ratio |
| Motilal Oswal Flexi Cap Fund | 44.56 | SBI Flexi Cap Fund | 20.12 |
| Invesco India Flexi Cap Fund | 40.13 | JioBlackRock Flexi Cap Fund | 20.16 |
| UTI Flexi Cap Fund | 35.97 | JM Flexi Cap Fund | 21.07 |
| Quant Flexi Cap Fund | 35.44 | DSP Flexi Cap Fund | 21.18 |
| ICICI Pru Flexi Cap Fund | 33.62 | Bandhan Flexi Cap Fund | 22.32 |
| Source: Tickertape | |||
On the lower end, SBI Flexi Cap Fund and JioBlackRock Flexi Cap Fund had P/E ratios close to 20. The difference between the highest and lowest P/E funds in the category was about 24 points.
Should investors look at the P/E ratio of mutual funds?
Experts say the P/E ratio can be useful for understanding the valuation of a mutual fund’s underlying portfolio, but it should not be viewed in isolation.
Manish Gadhvi, CEO, FundsIndia Partner, said a fund’s P/E ratio reflects the average valuation of the stocks it holds and can indicate whether the portfolio is tilted towards relatively expensive or inexpensive businesses compared with its benchmark or category peers. However, he noted that a higher P/E does not automatically mean a fund is overvalued, while a lower P/E does not necessarily make it a bargain.
According to Gadhvi, factors such as a fund’s investment style, sector allocation, earnings growth potential, portfolio quality and the fund manager’s strategy are also important when evaluating a scheme.
Kaustubh Belapurkar, Director, Morningstar Investment Research India, said investors can use the P/E ratio to compare a fund with its benchmark and peer group. He added that the metric should also be viewed in the context of a fund’s investment style. For instance, quality- and growth-oriented funds tend to have higher P/E ratios, while value-oriented funds generally have lower P/E ratios.
Belapurkar added that investors should focus on asset allocation and prudent fund selection based on the quality of the investment team and investment process, which drive long-term portfolio outcomes. Gadhvi similarly said investment decisions should be aligned with an investor’s financial goals, risk appetite and asset allocation rather than being based solely on a single valuation metric.
As experts point out, comparisons with peers and benchmarks can make the P/E ratio a more meaningful measure for investors.