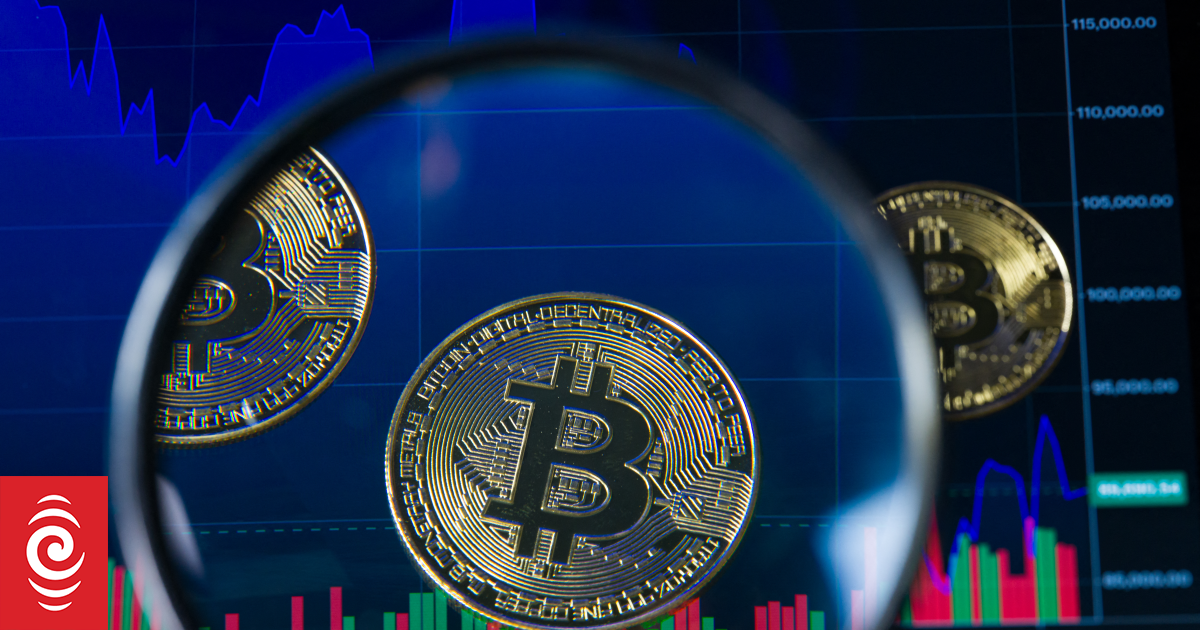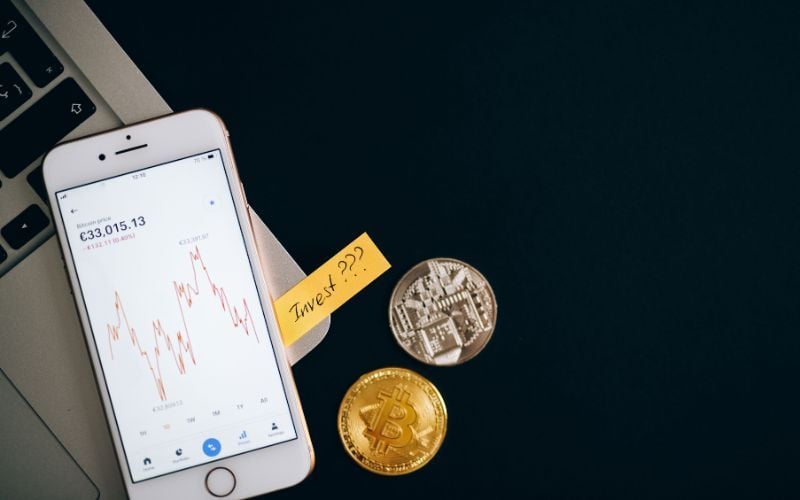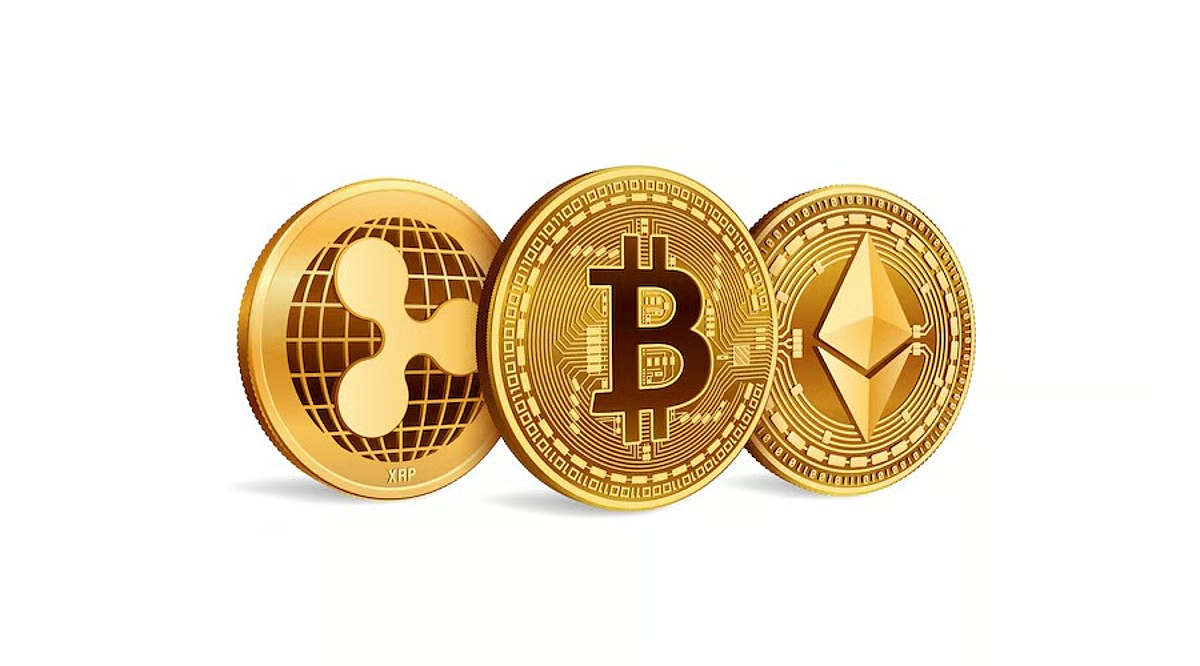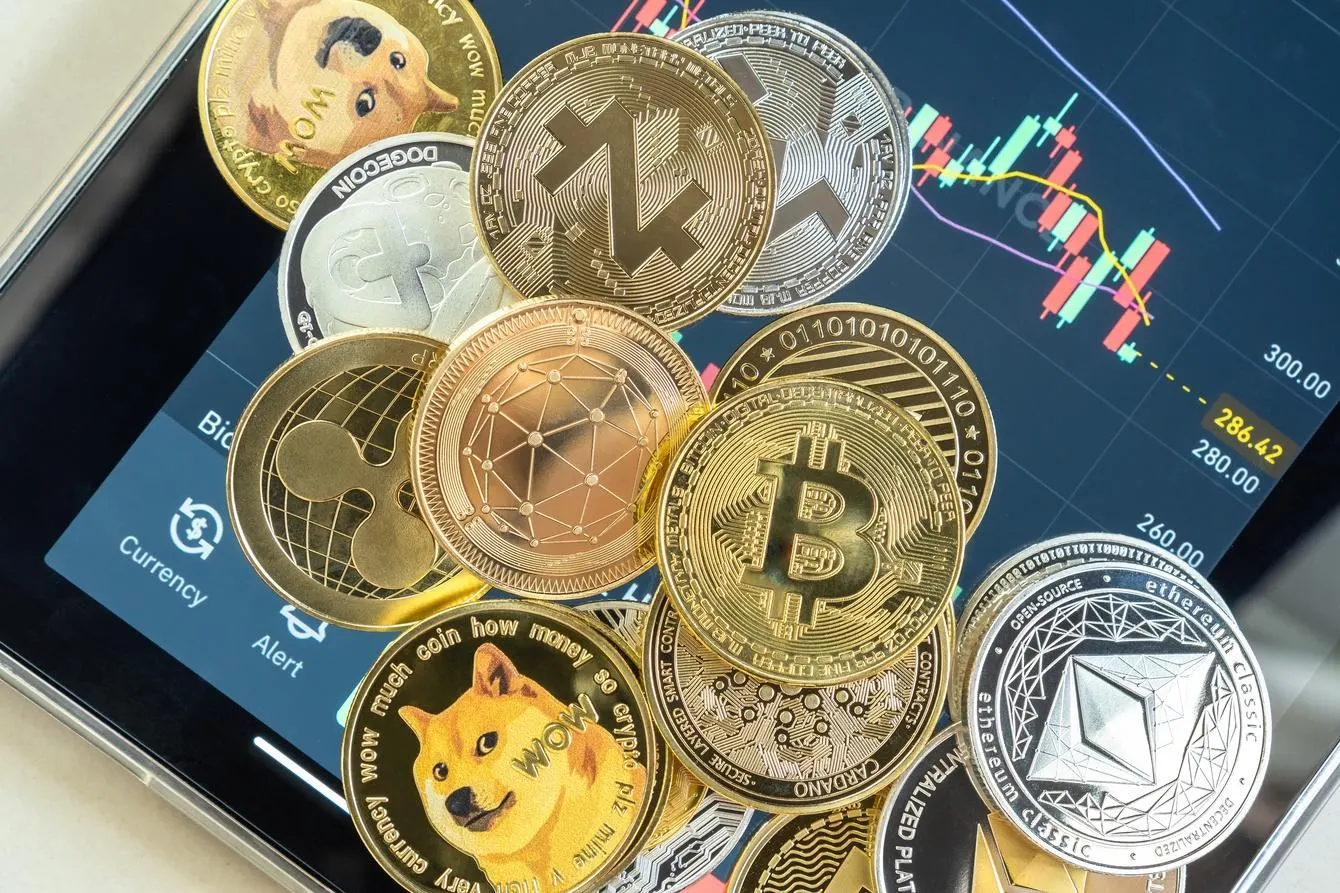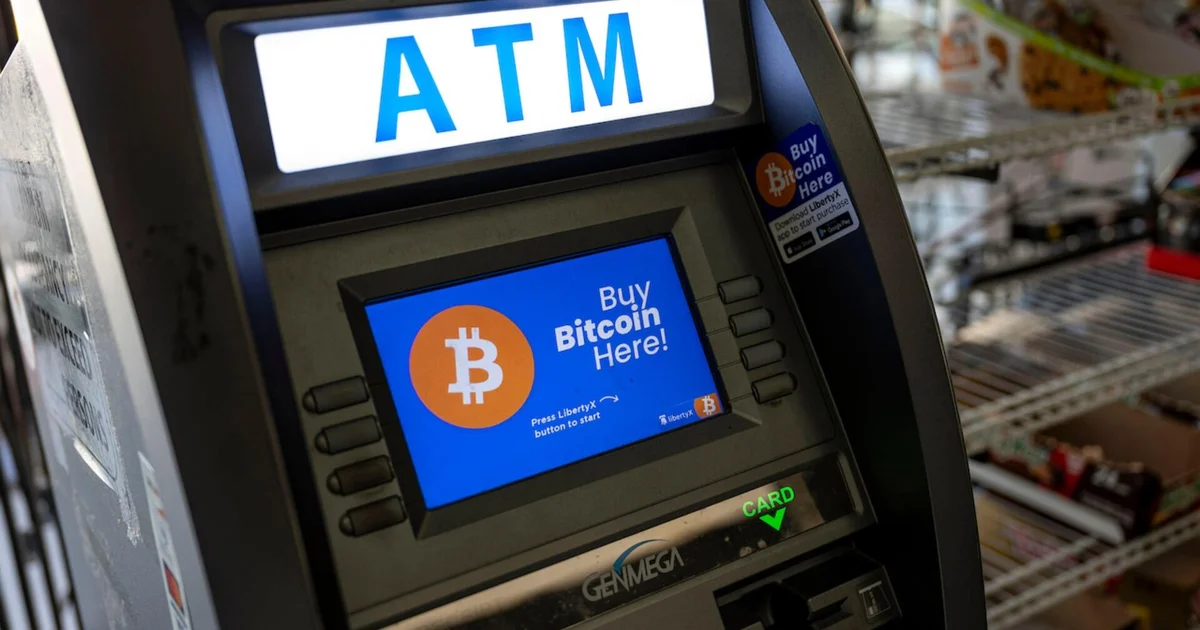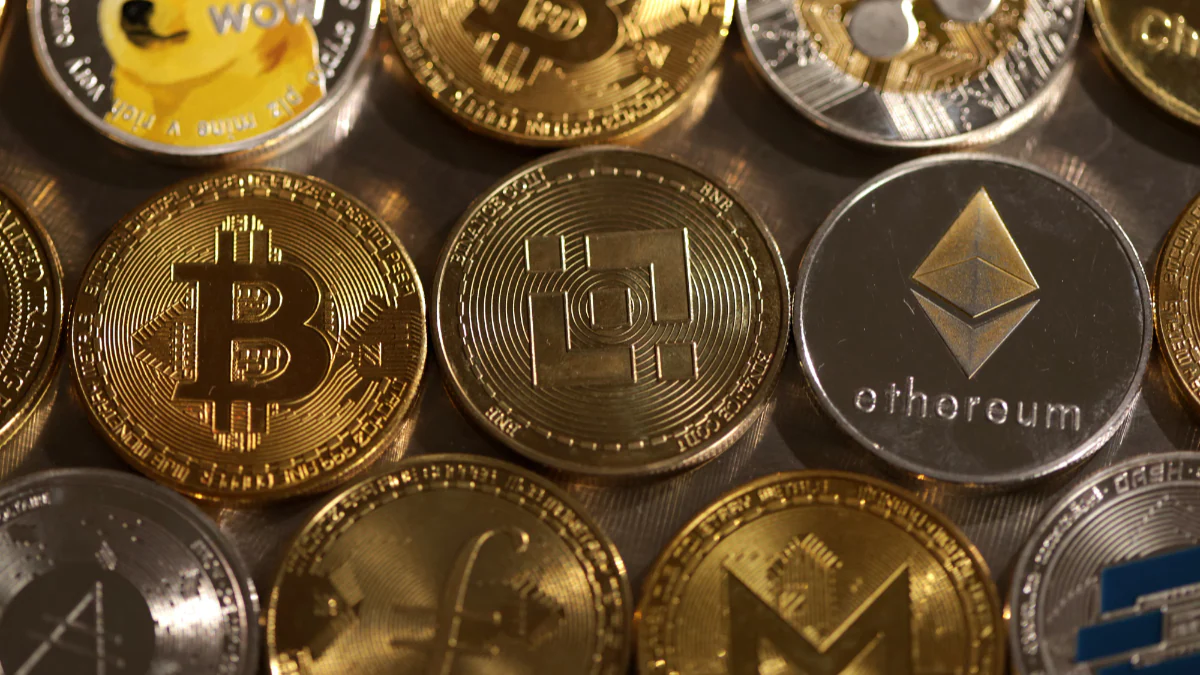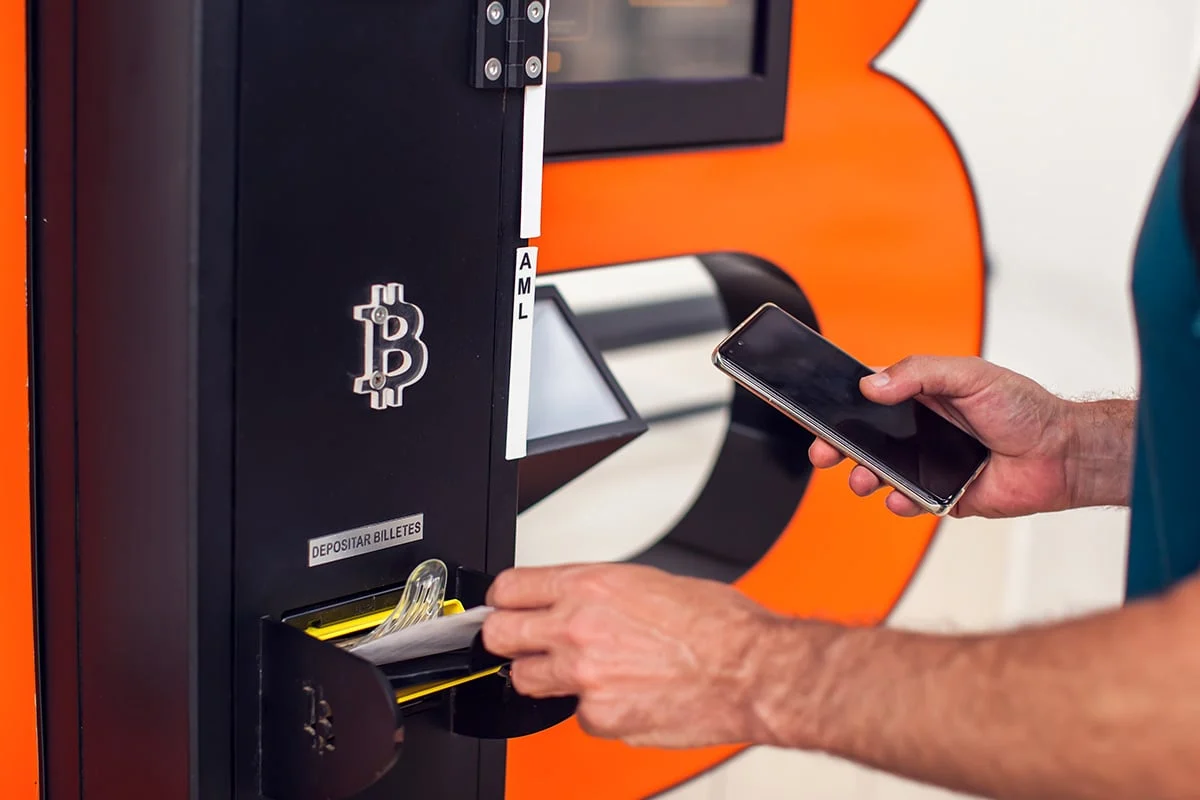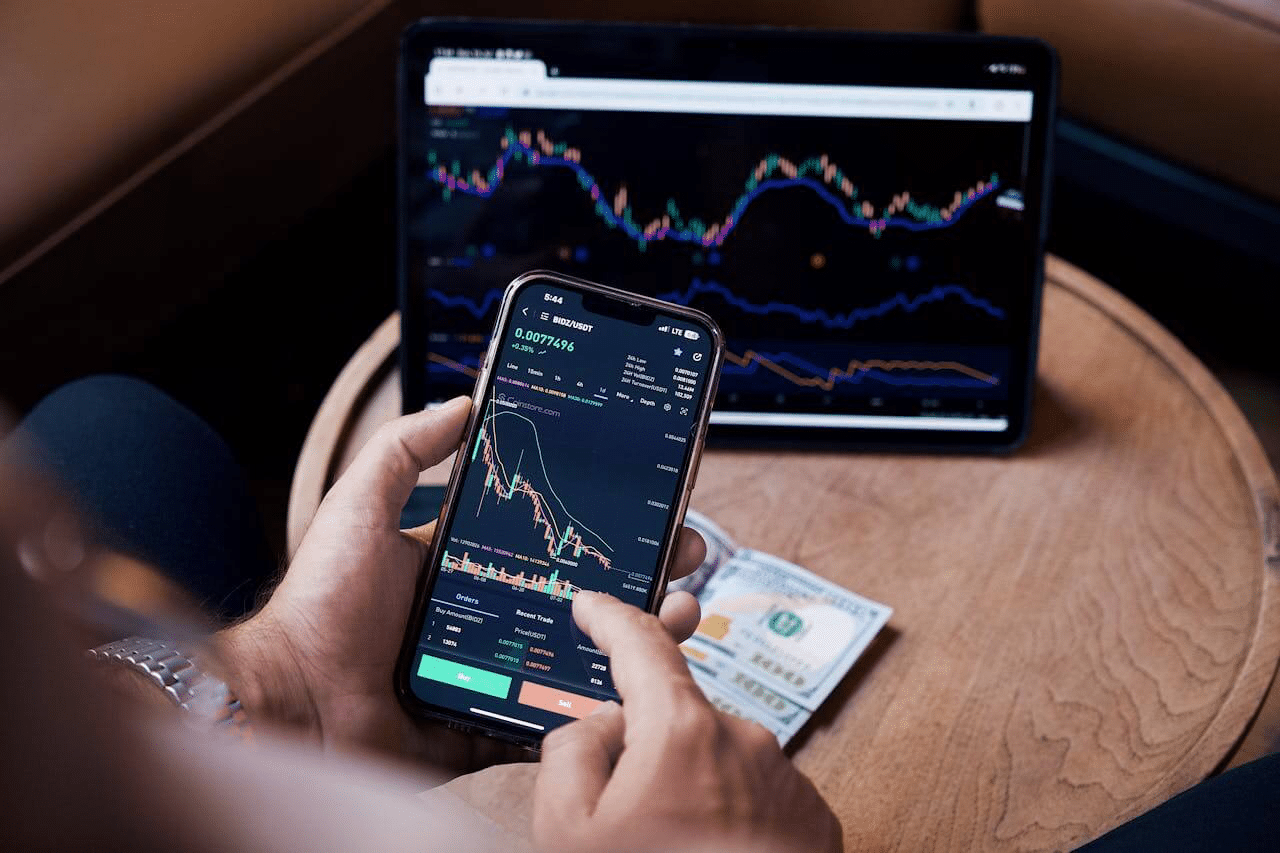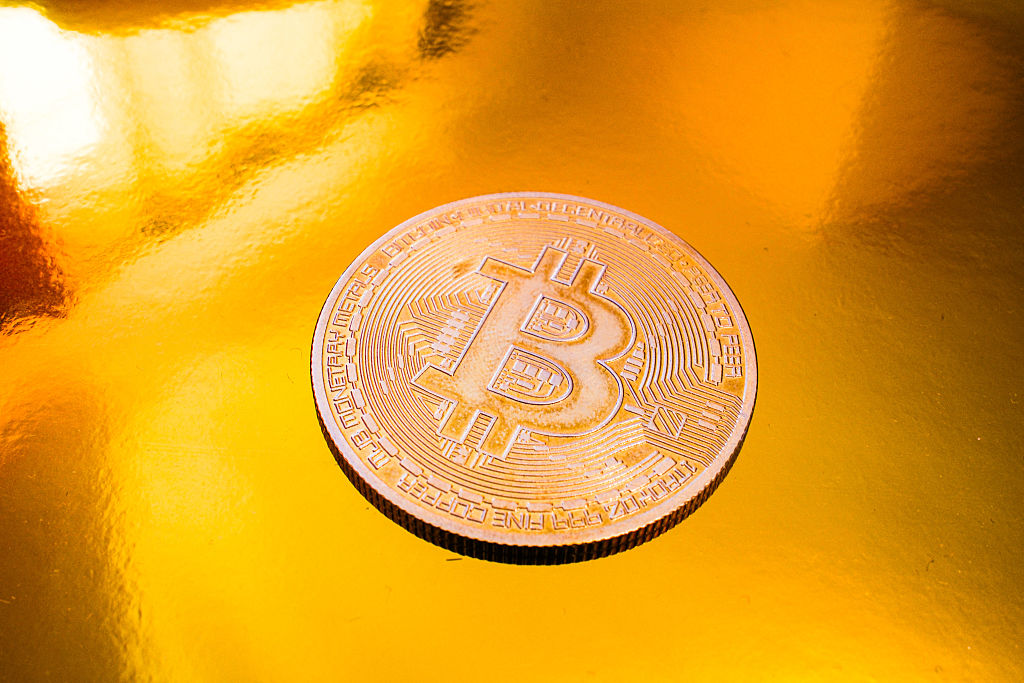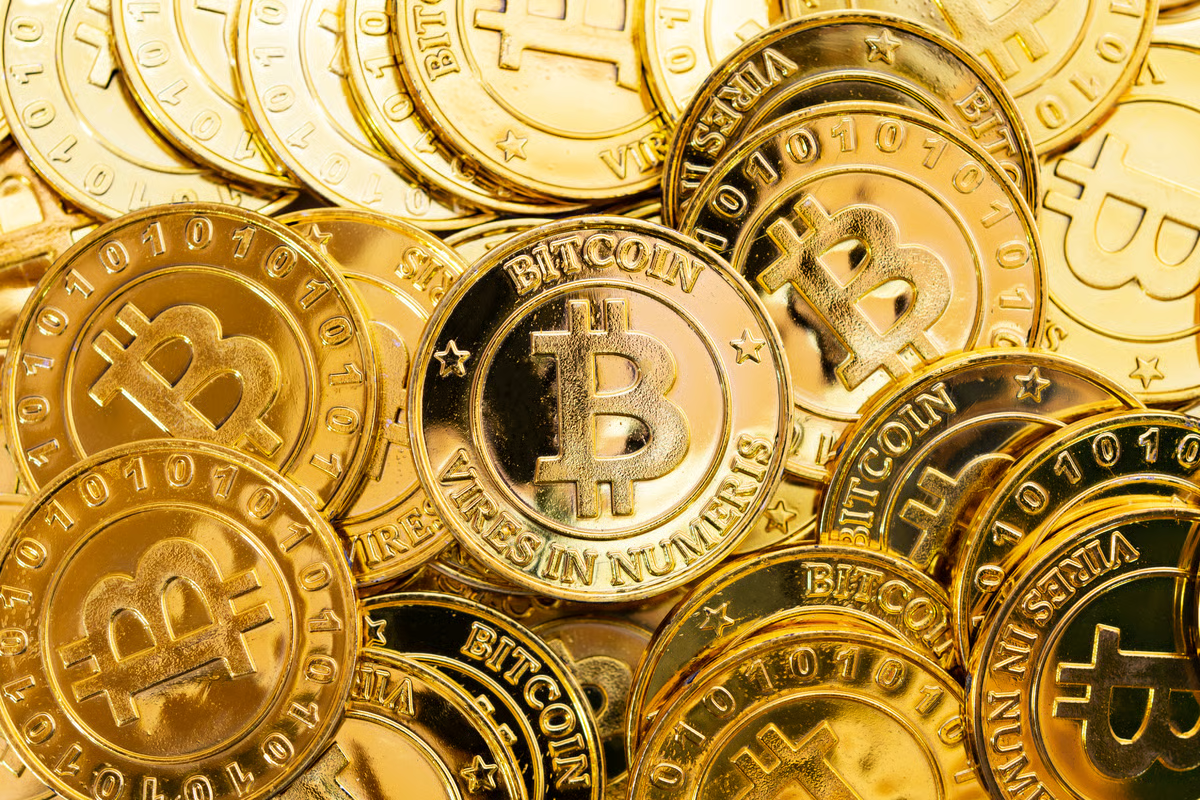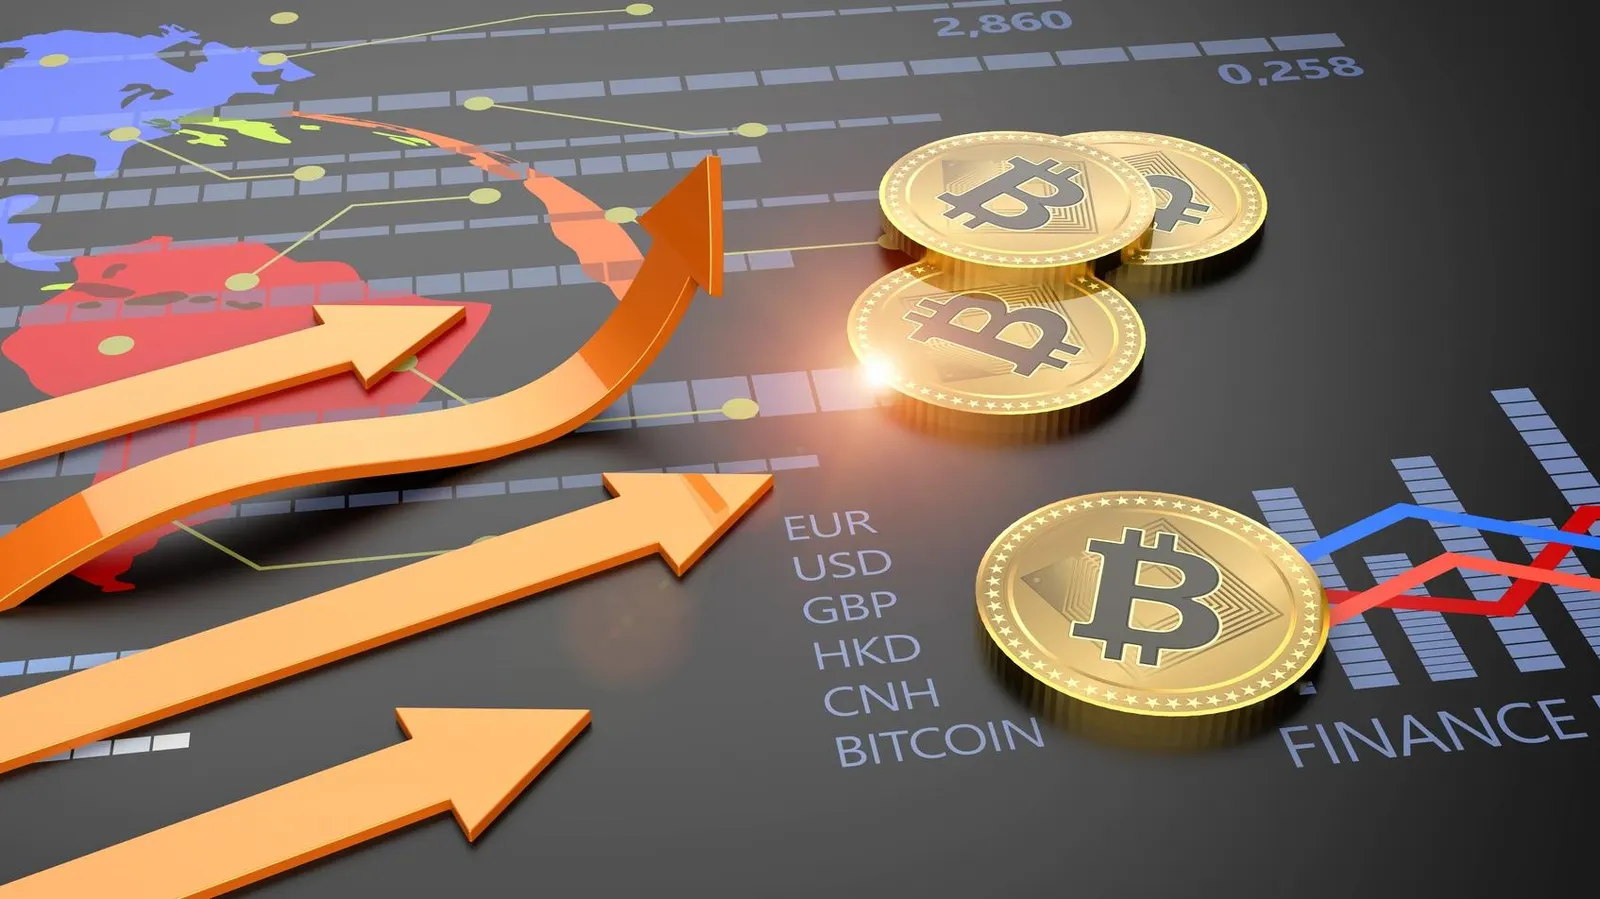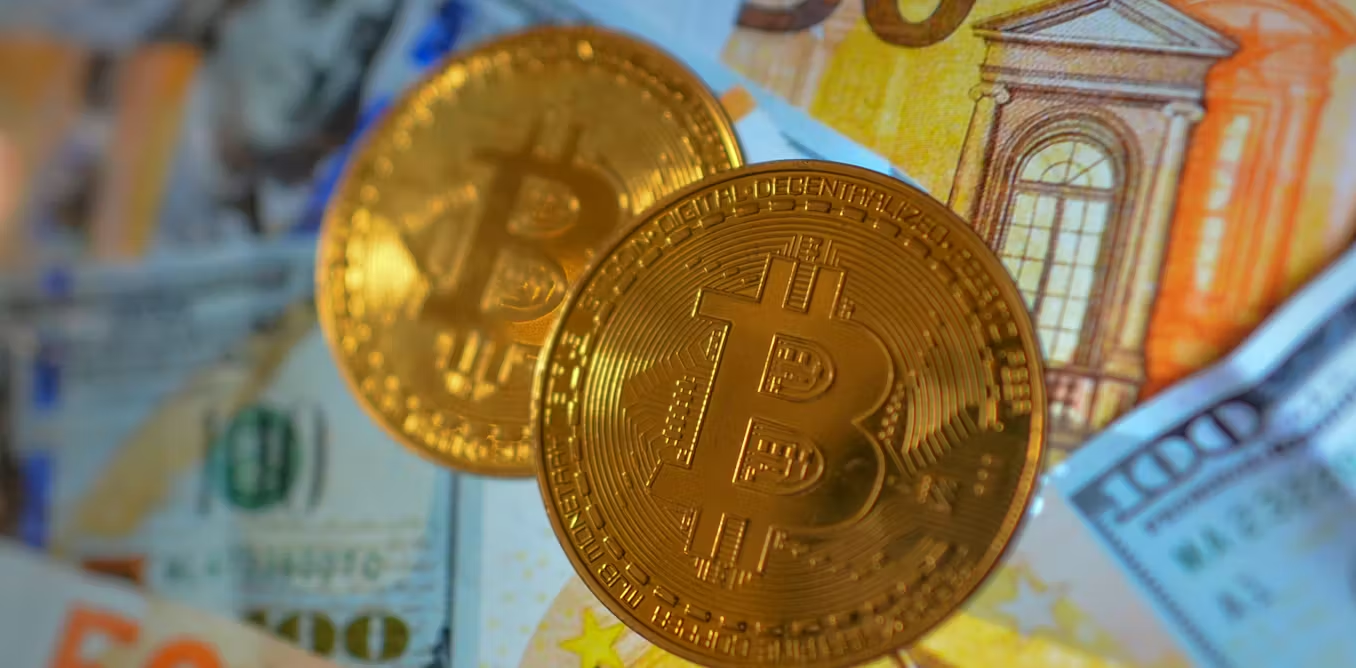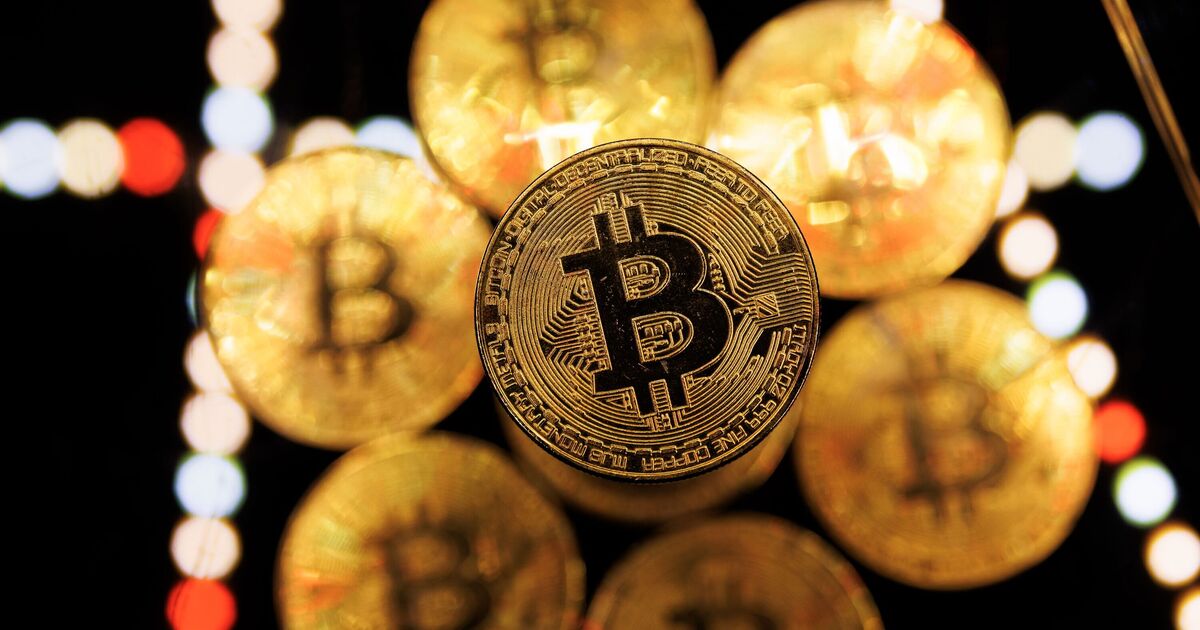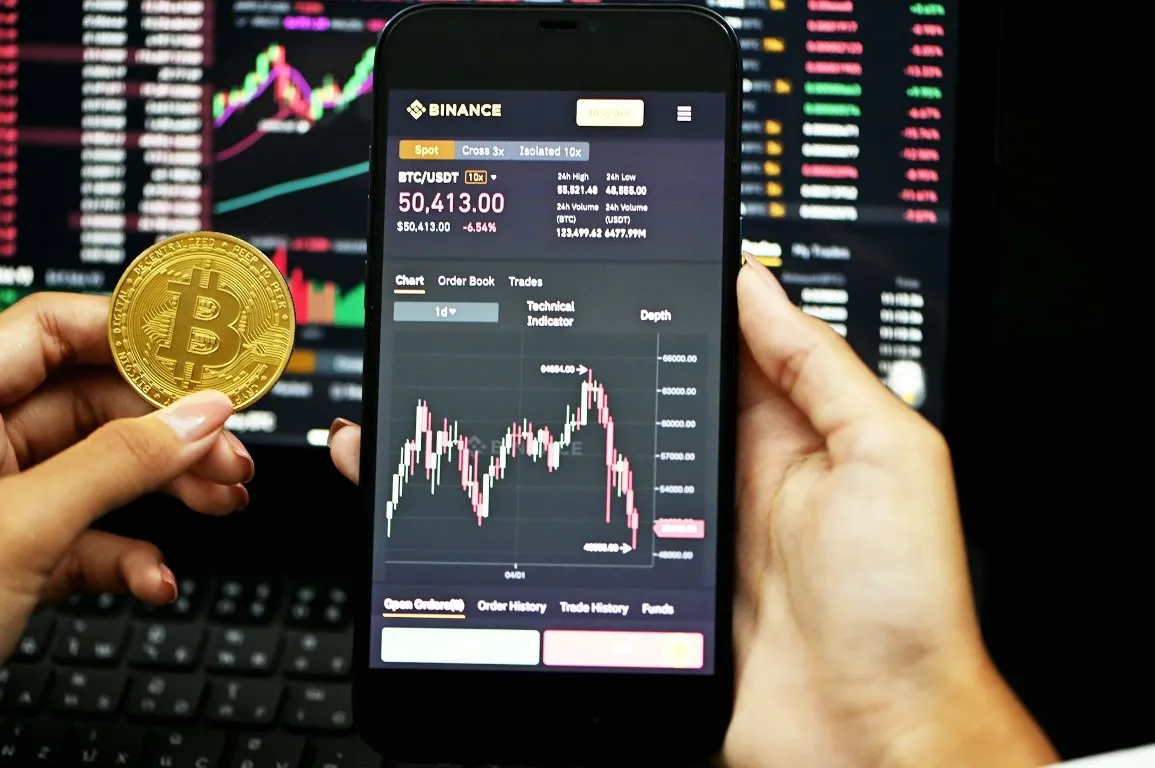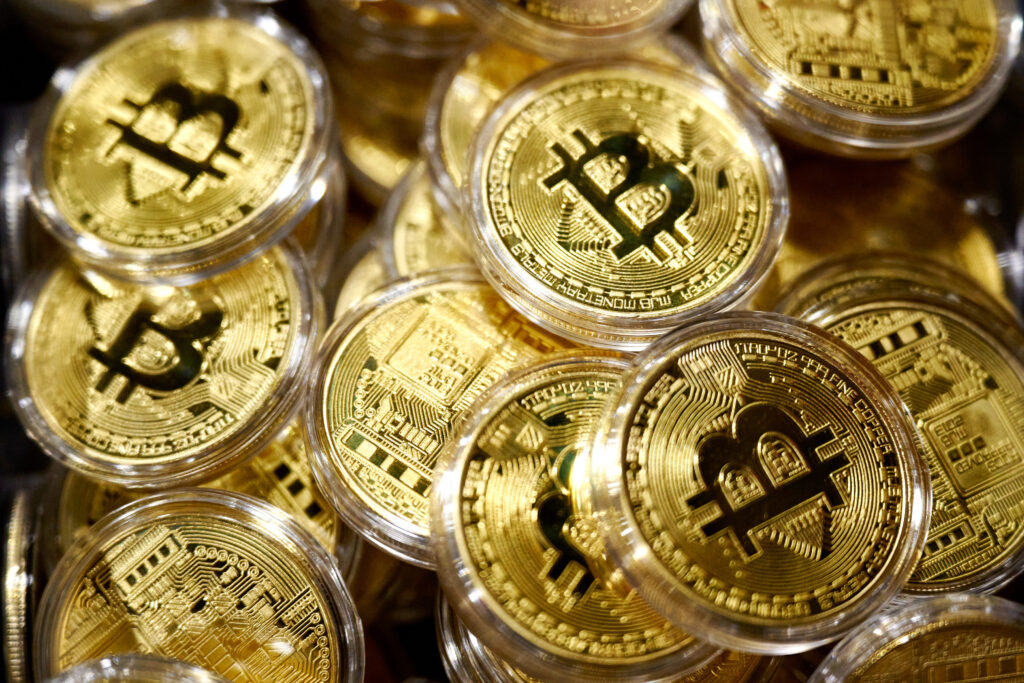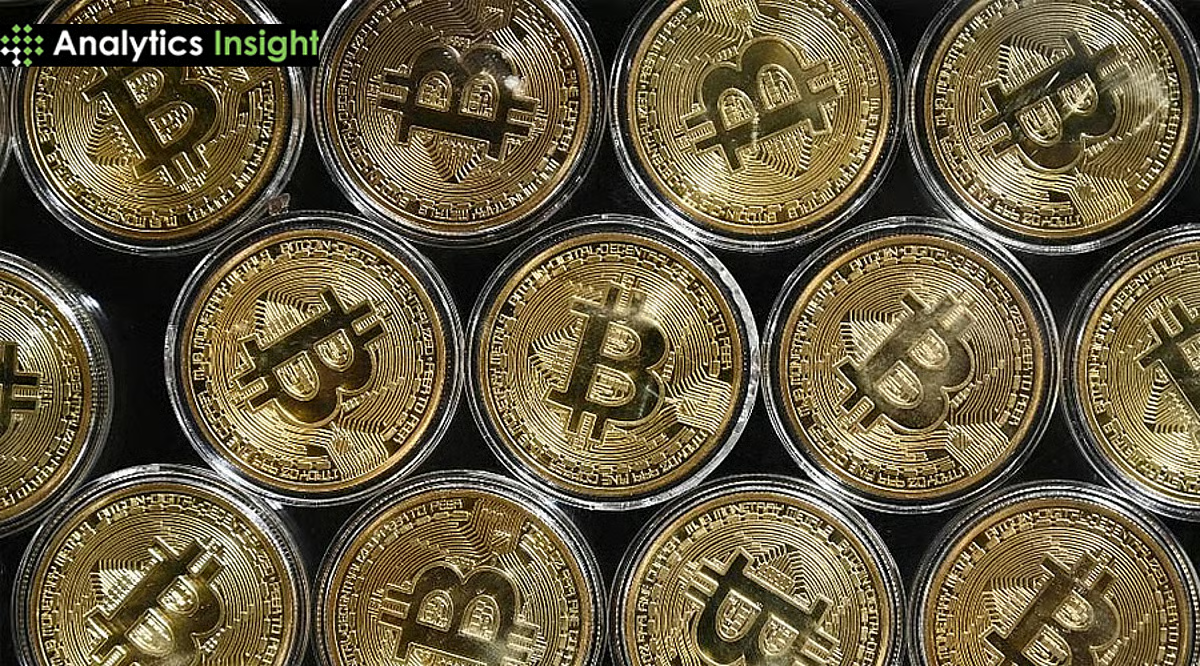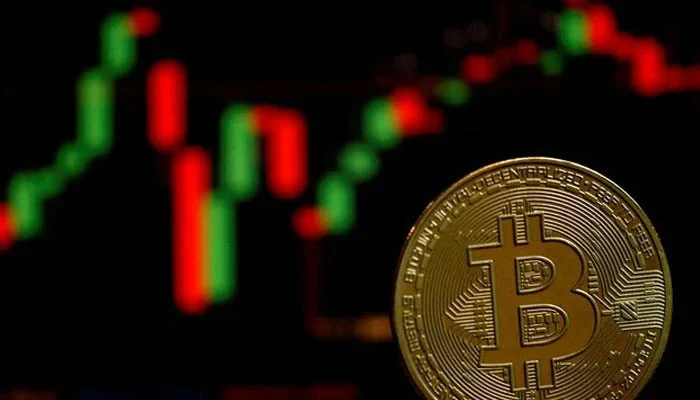



Cryptocurrency has had a hard year. Bitcoin closed June 2026 at $58,524, then rallied to $87,397 on September 21, its highest price since January.
That swing has many people asking if now is a good time to invest. This article uses recent data from financial firms and news outlets to set out the facts.
It does not tell readers what to buy. As Fidelity puts it, the answer depends on your money goals, how much risk you can take and how long you can stay invested.
The Crypto Market at a Glance
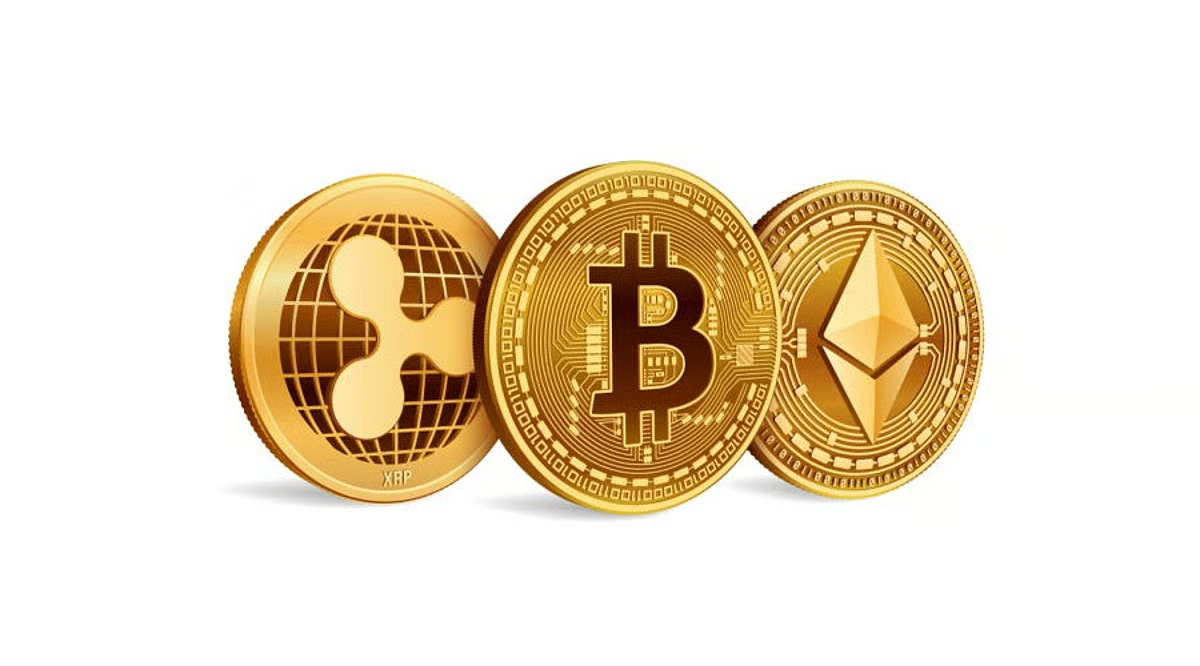
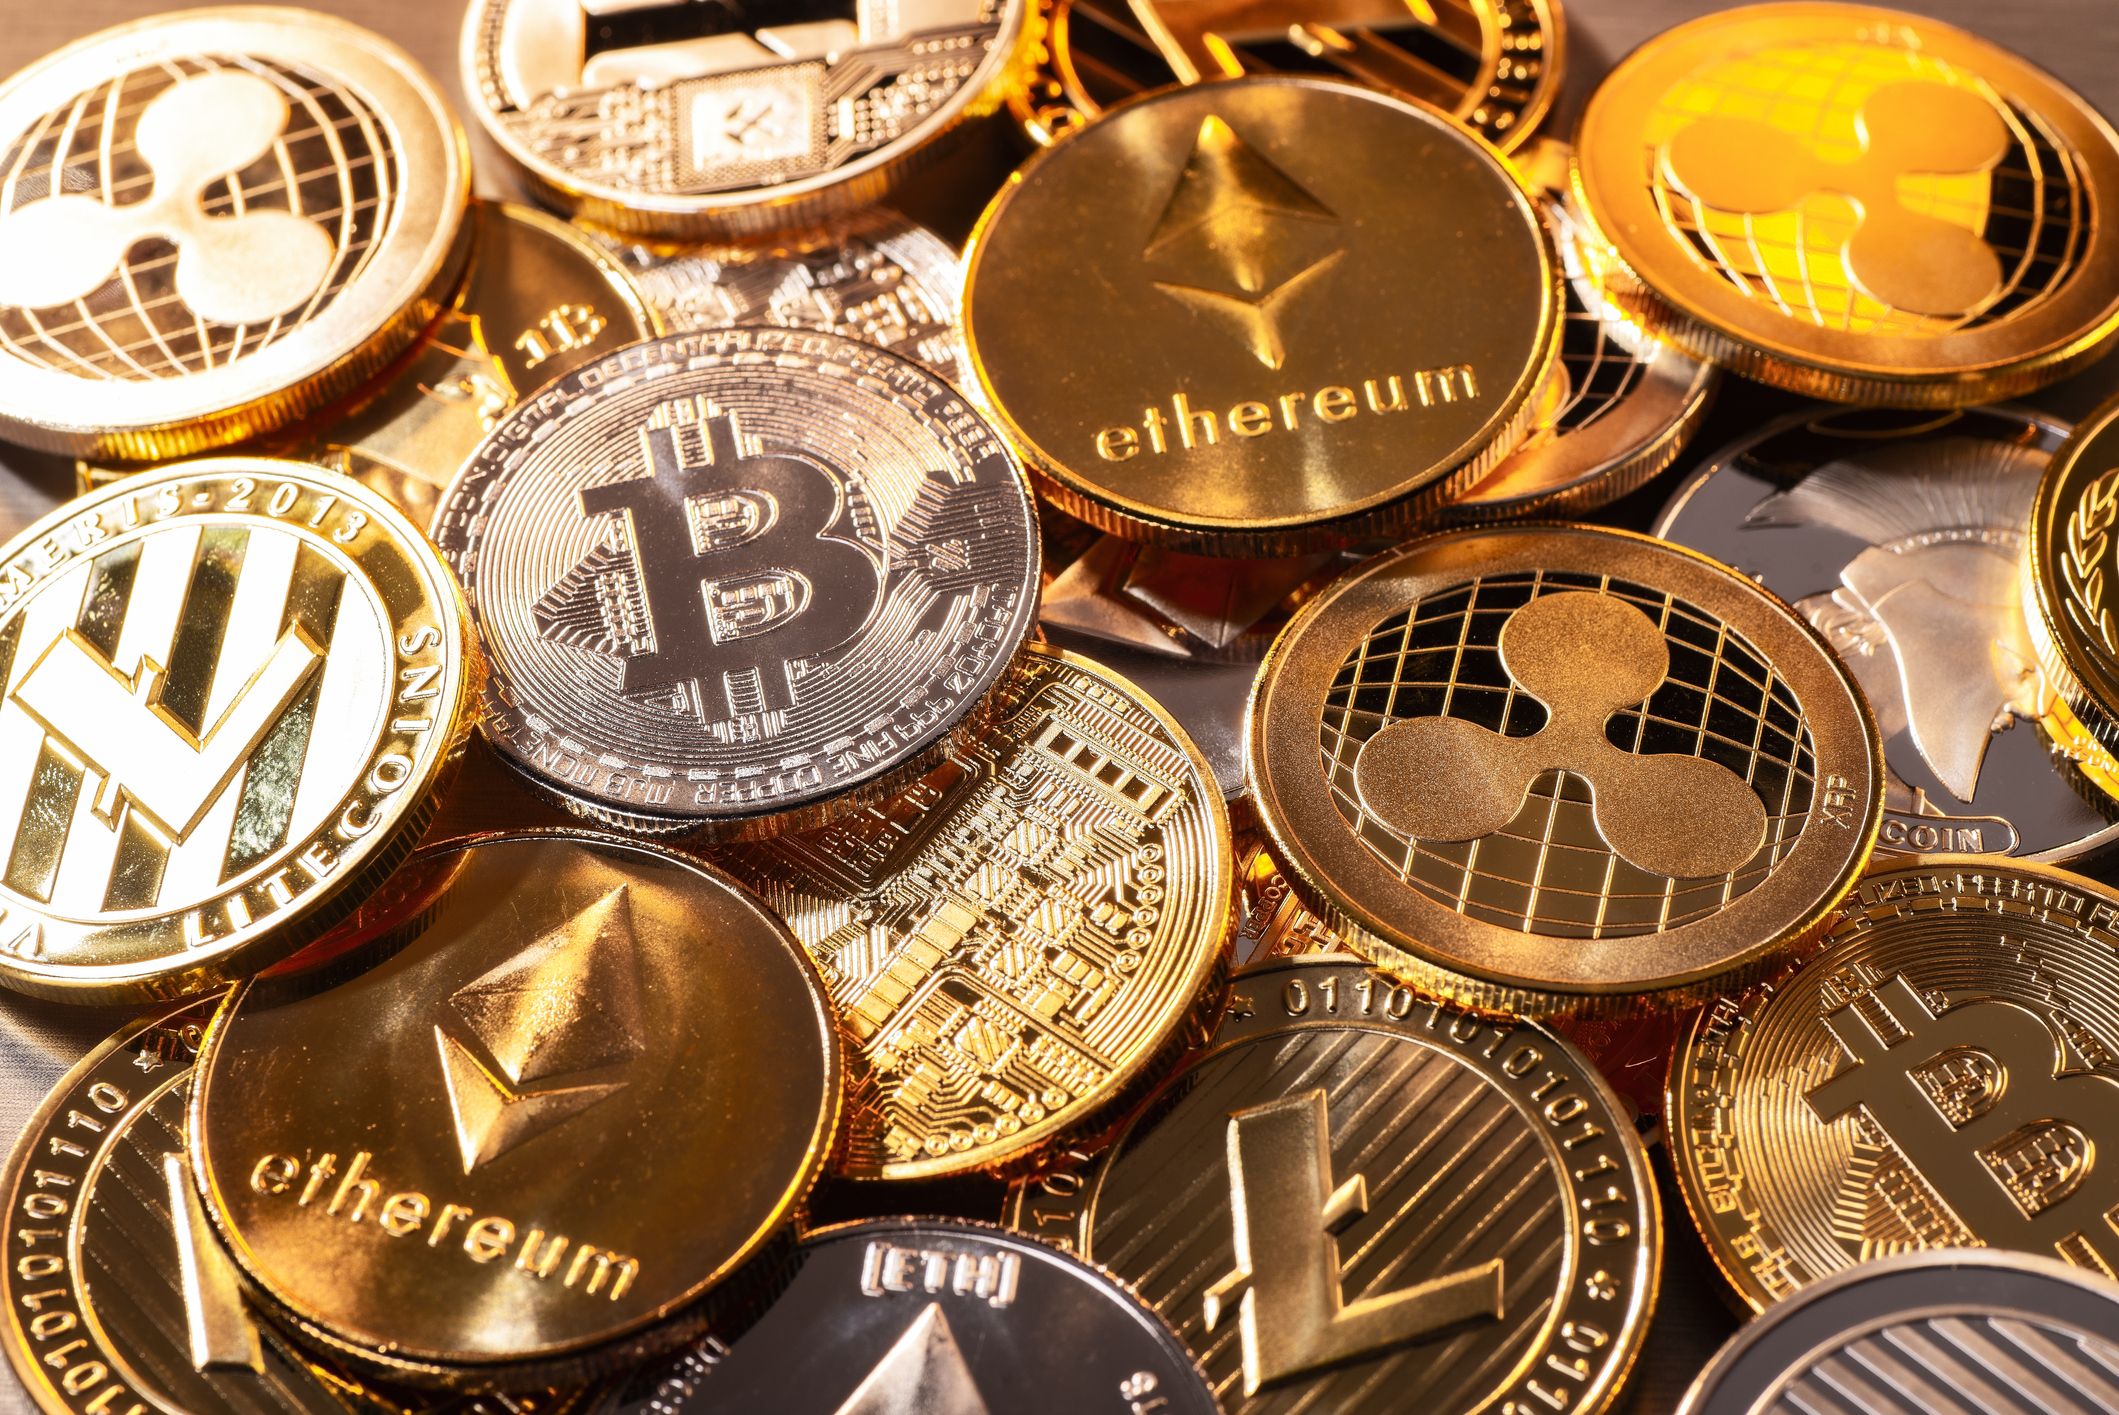
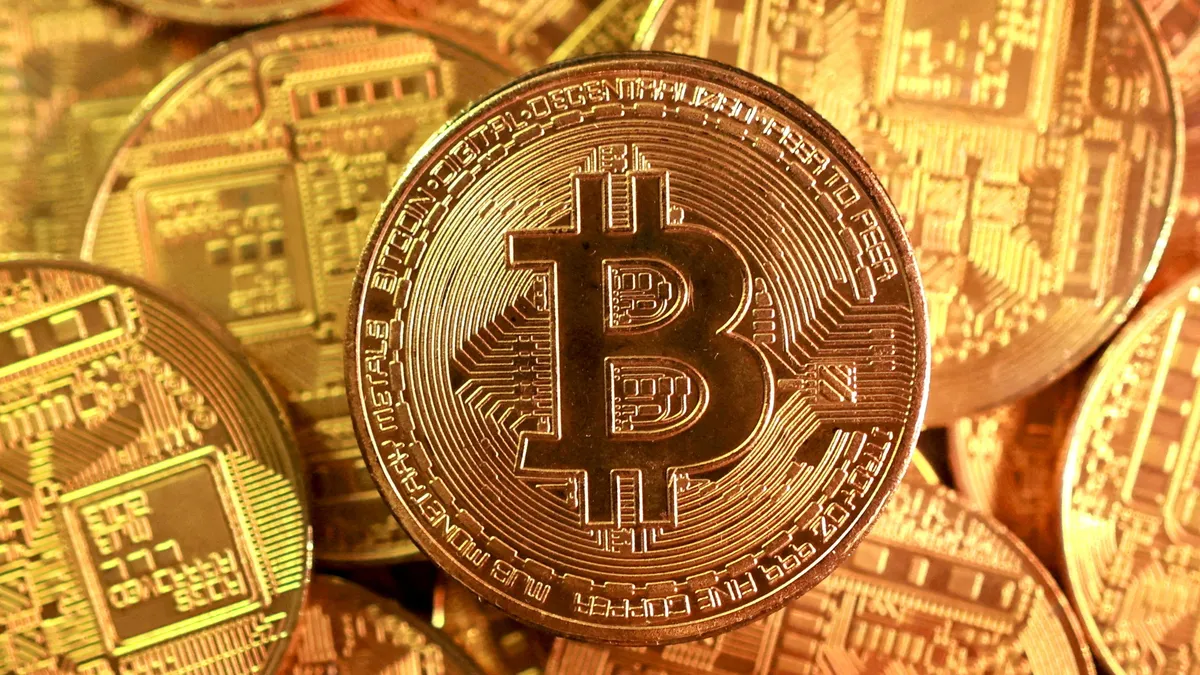
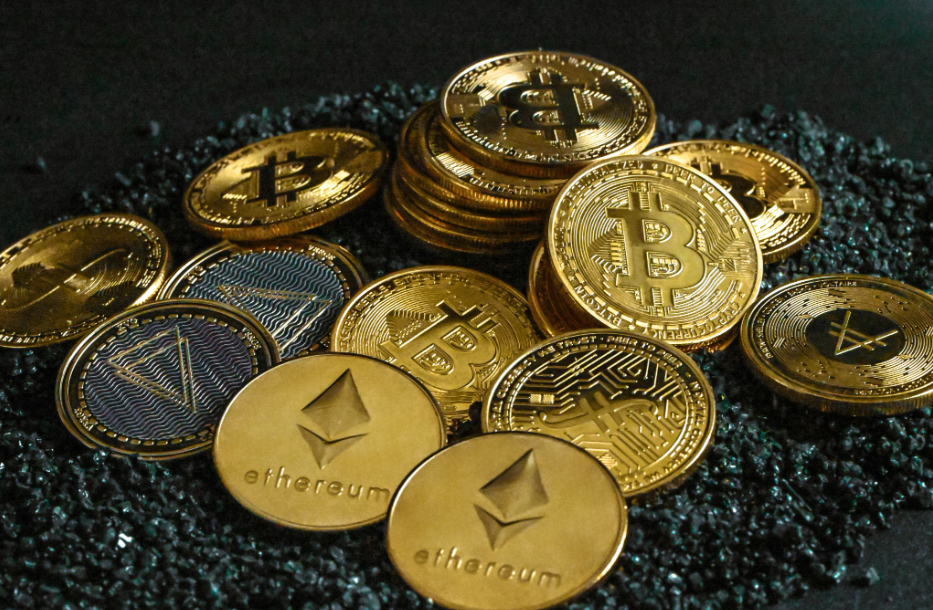
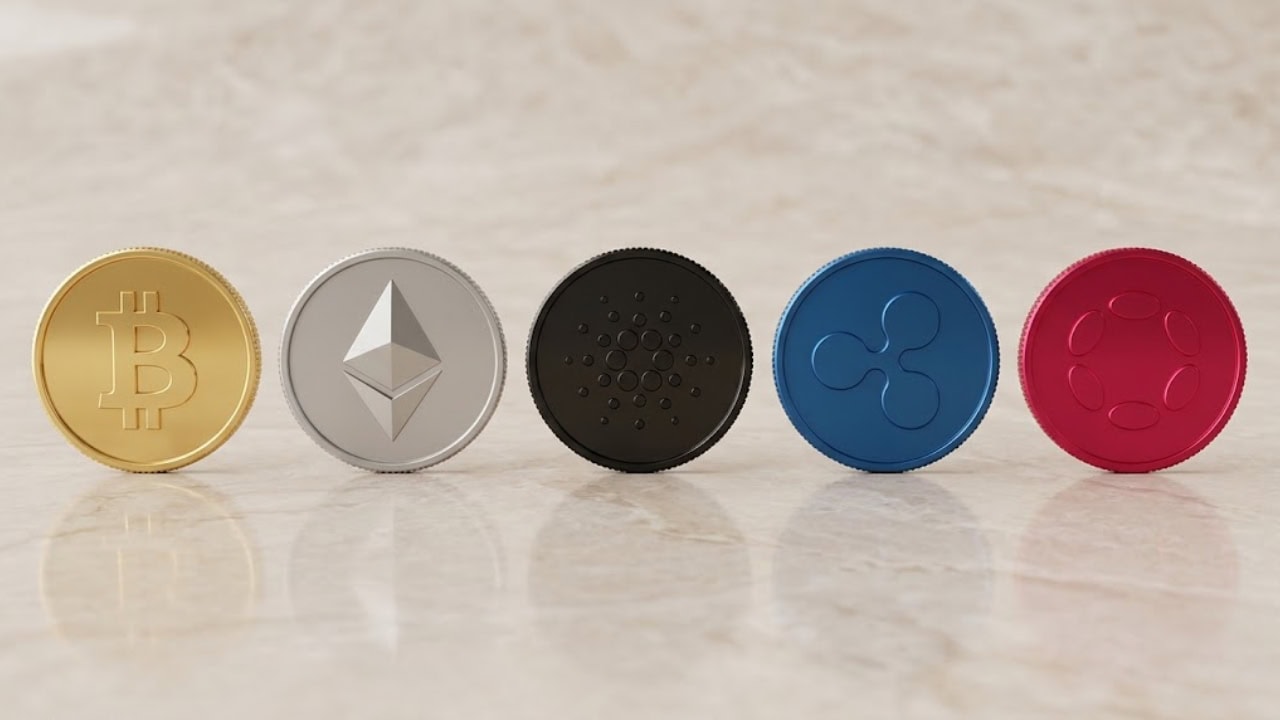
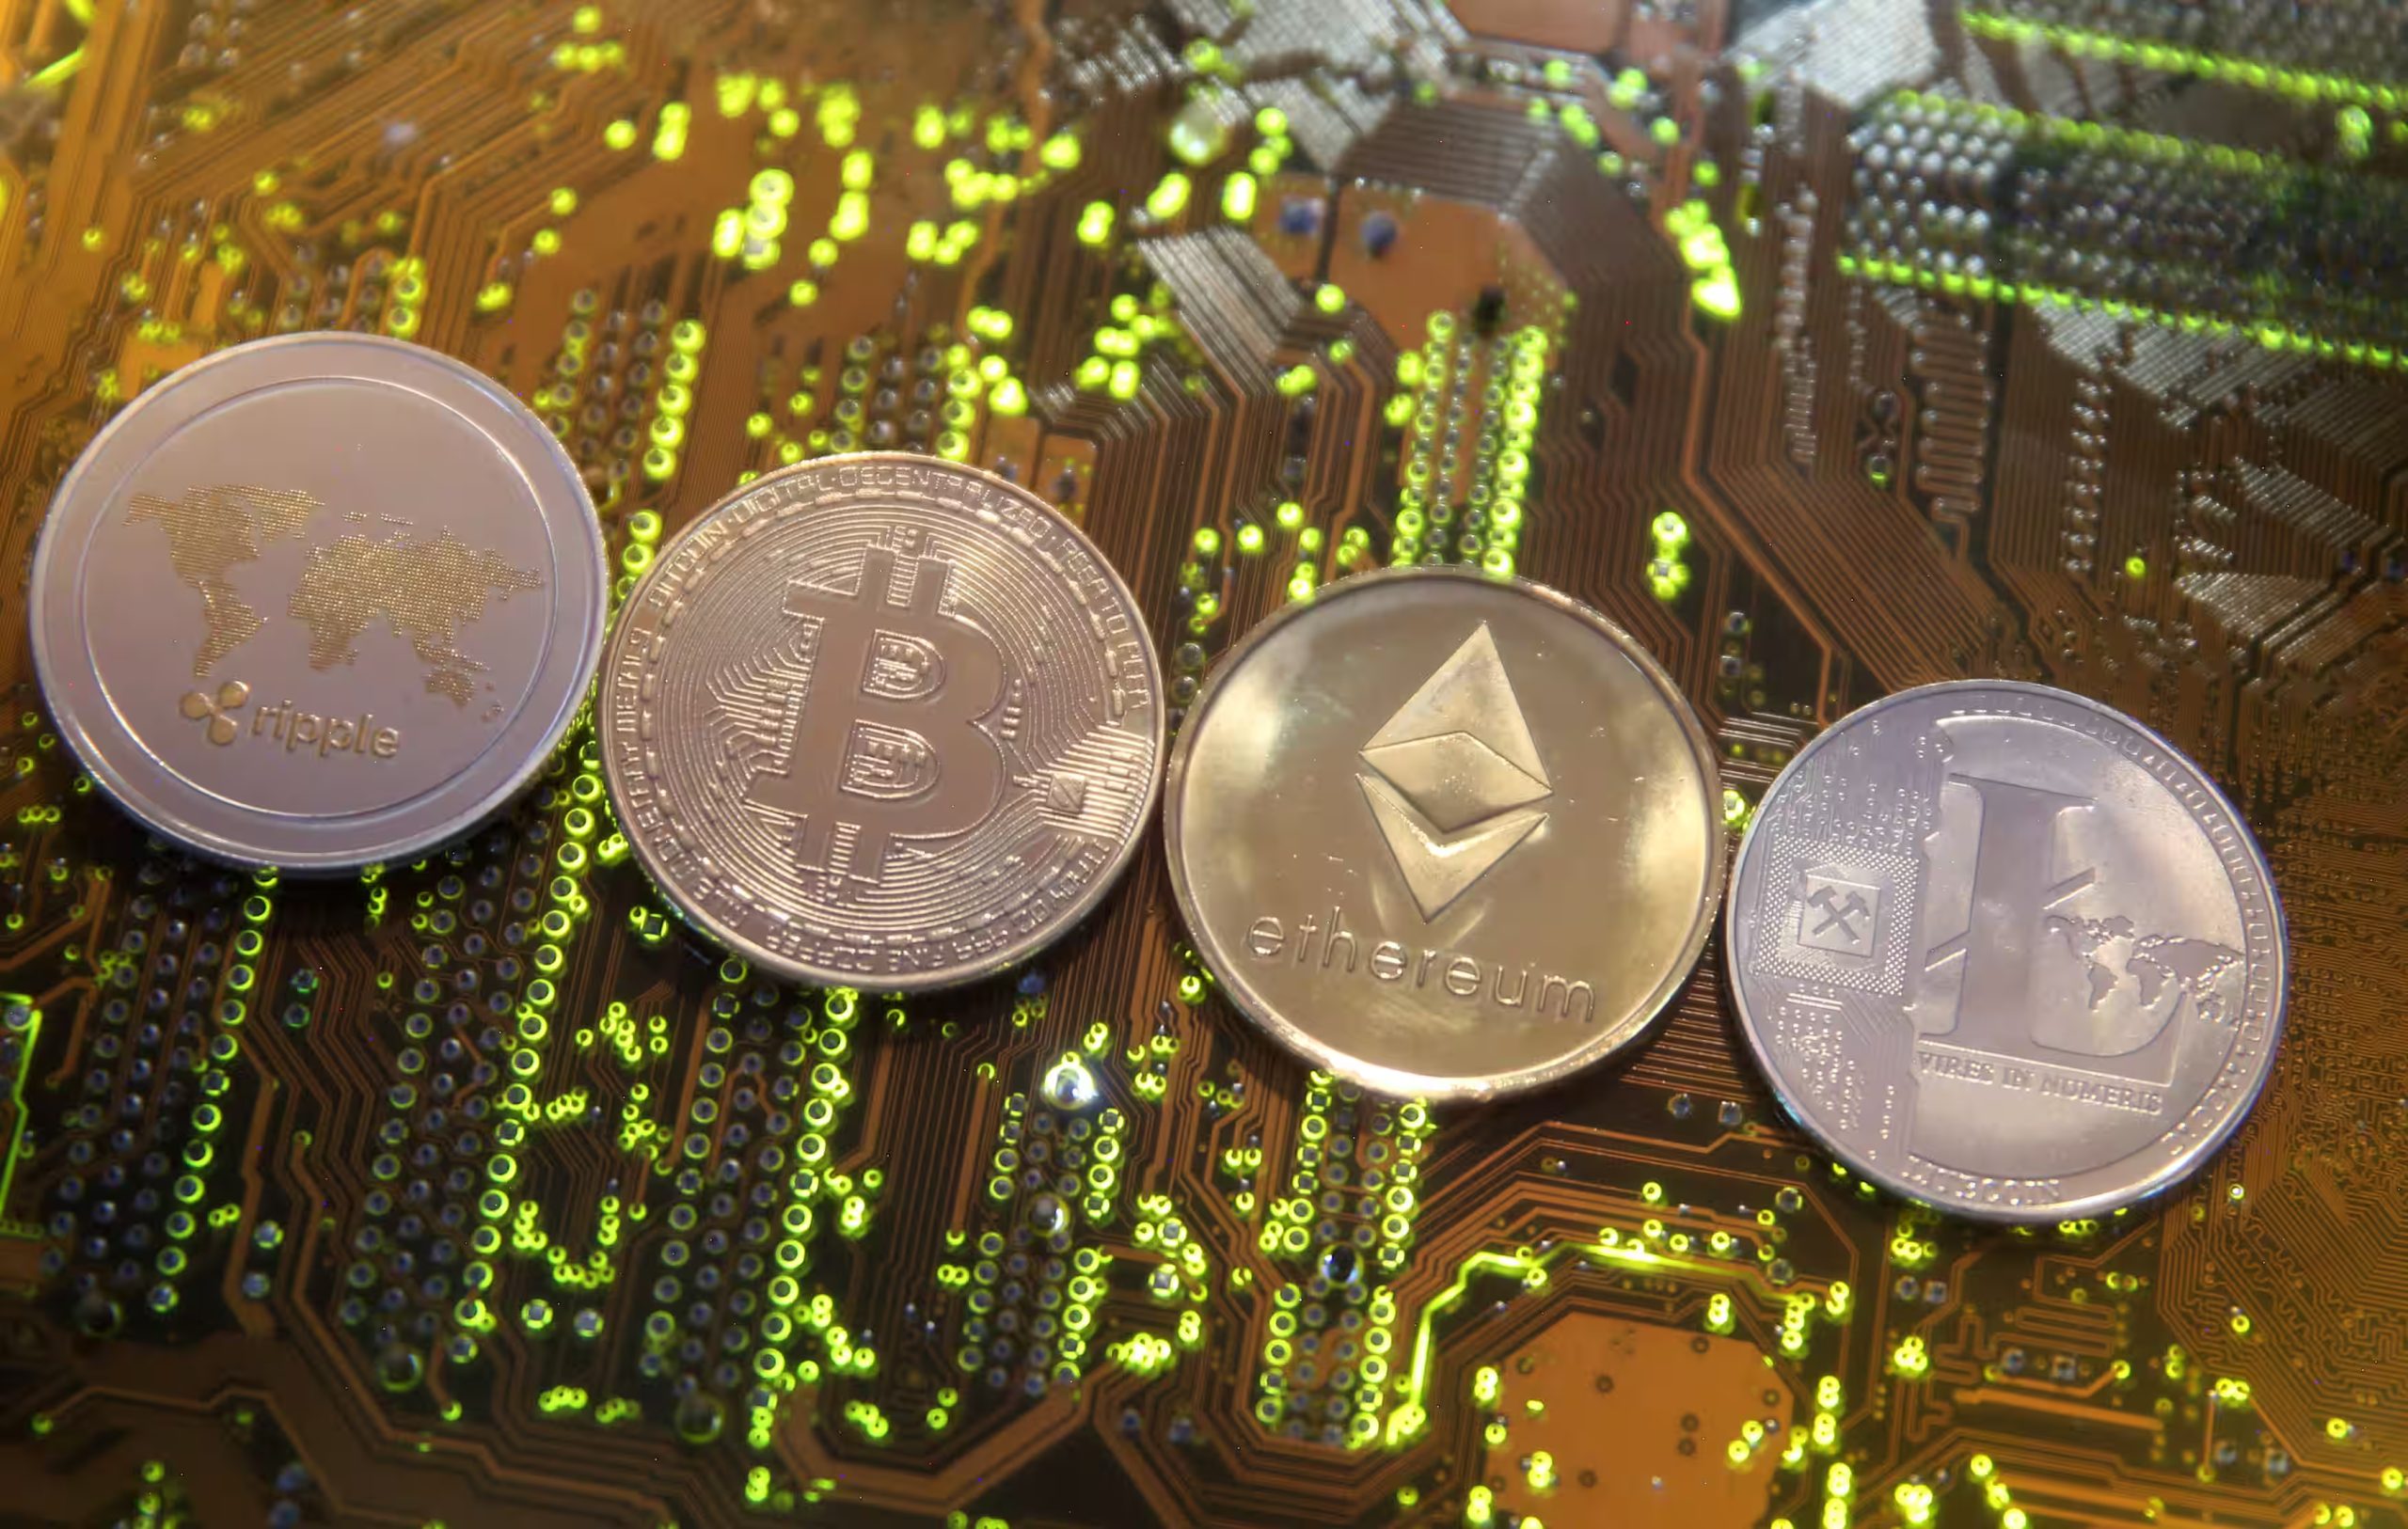
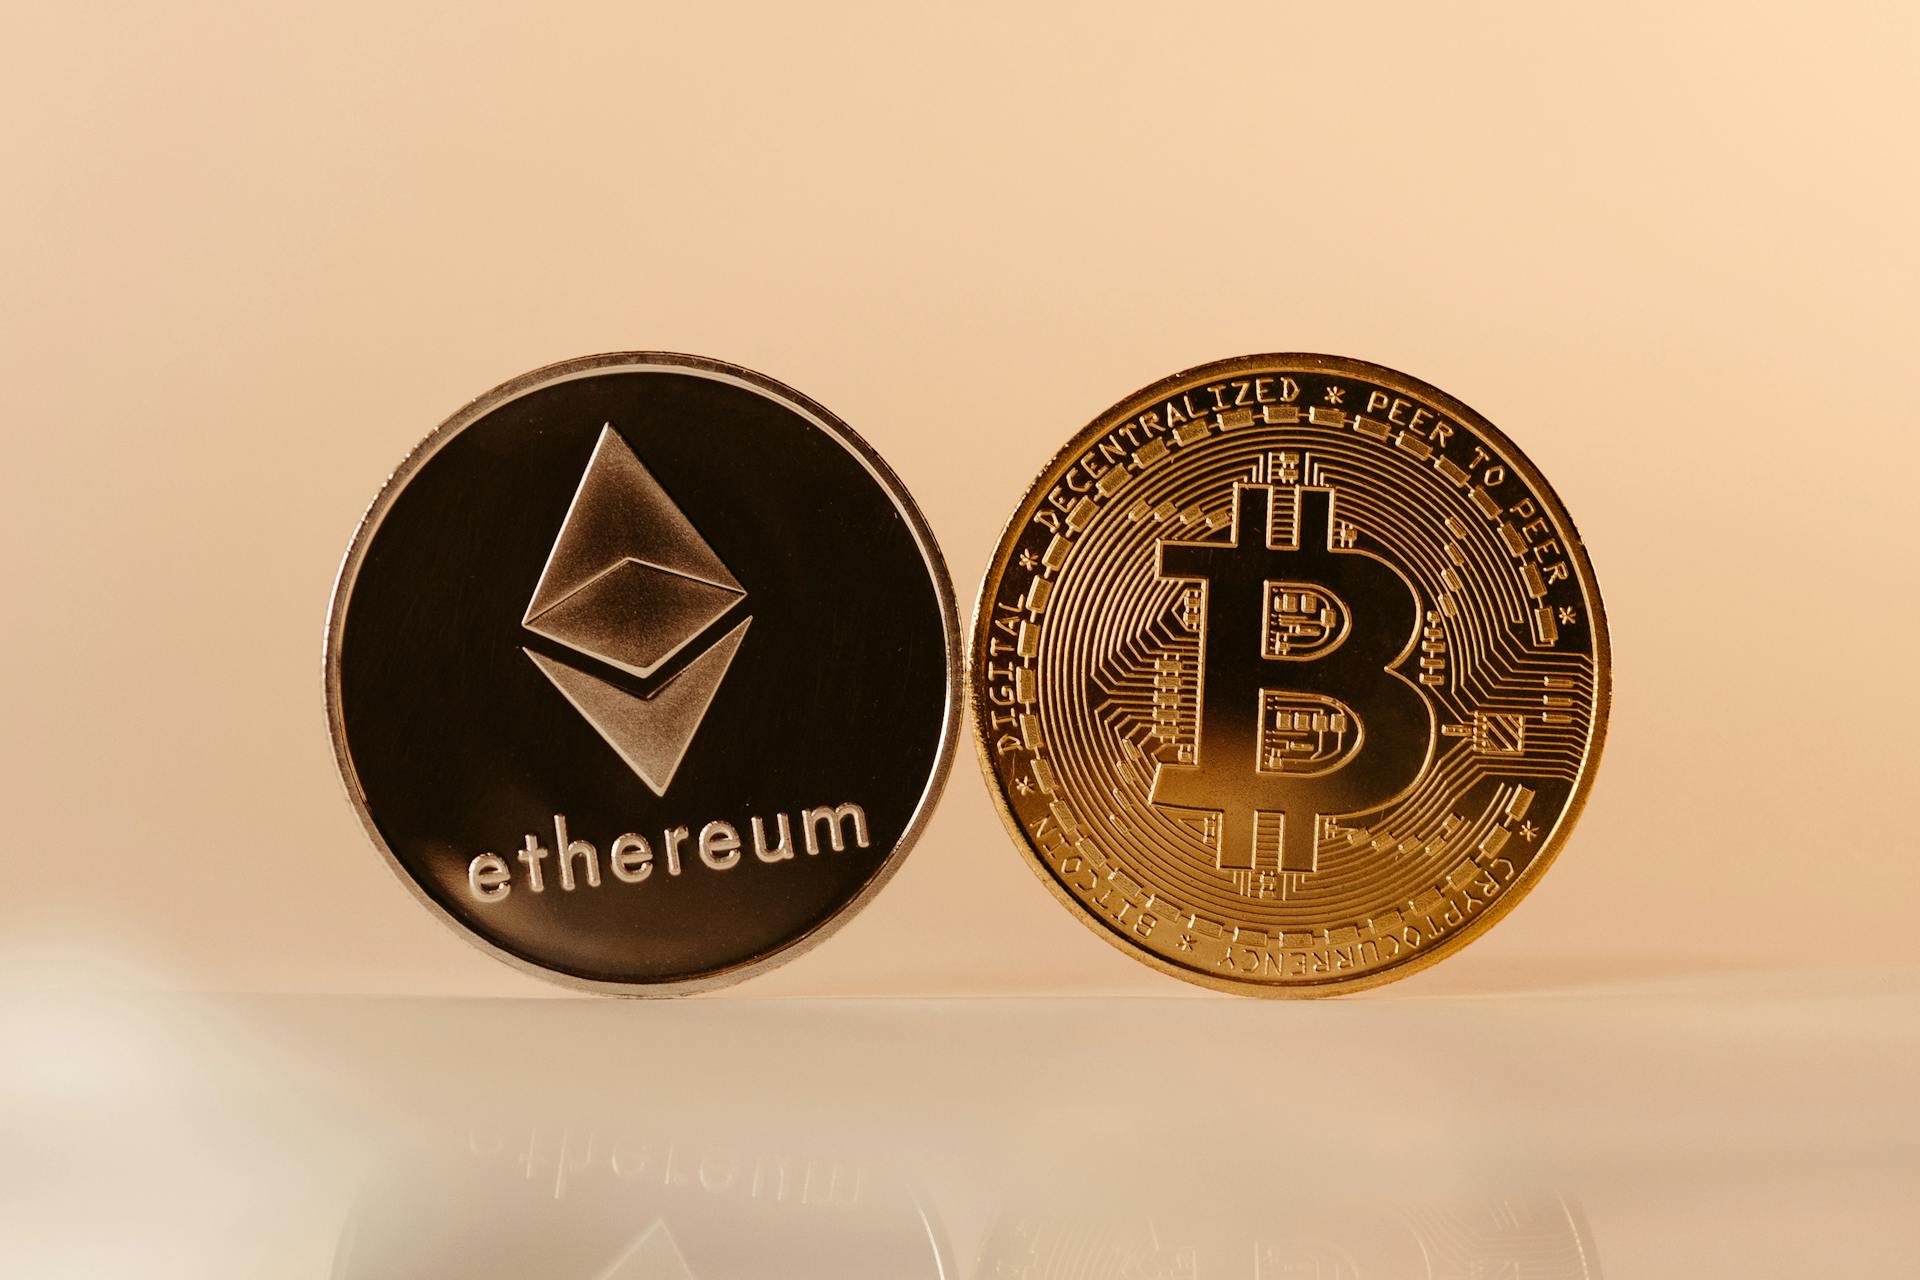
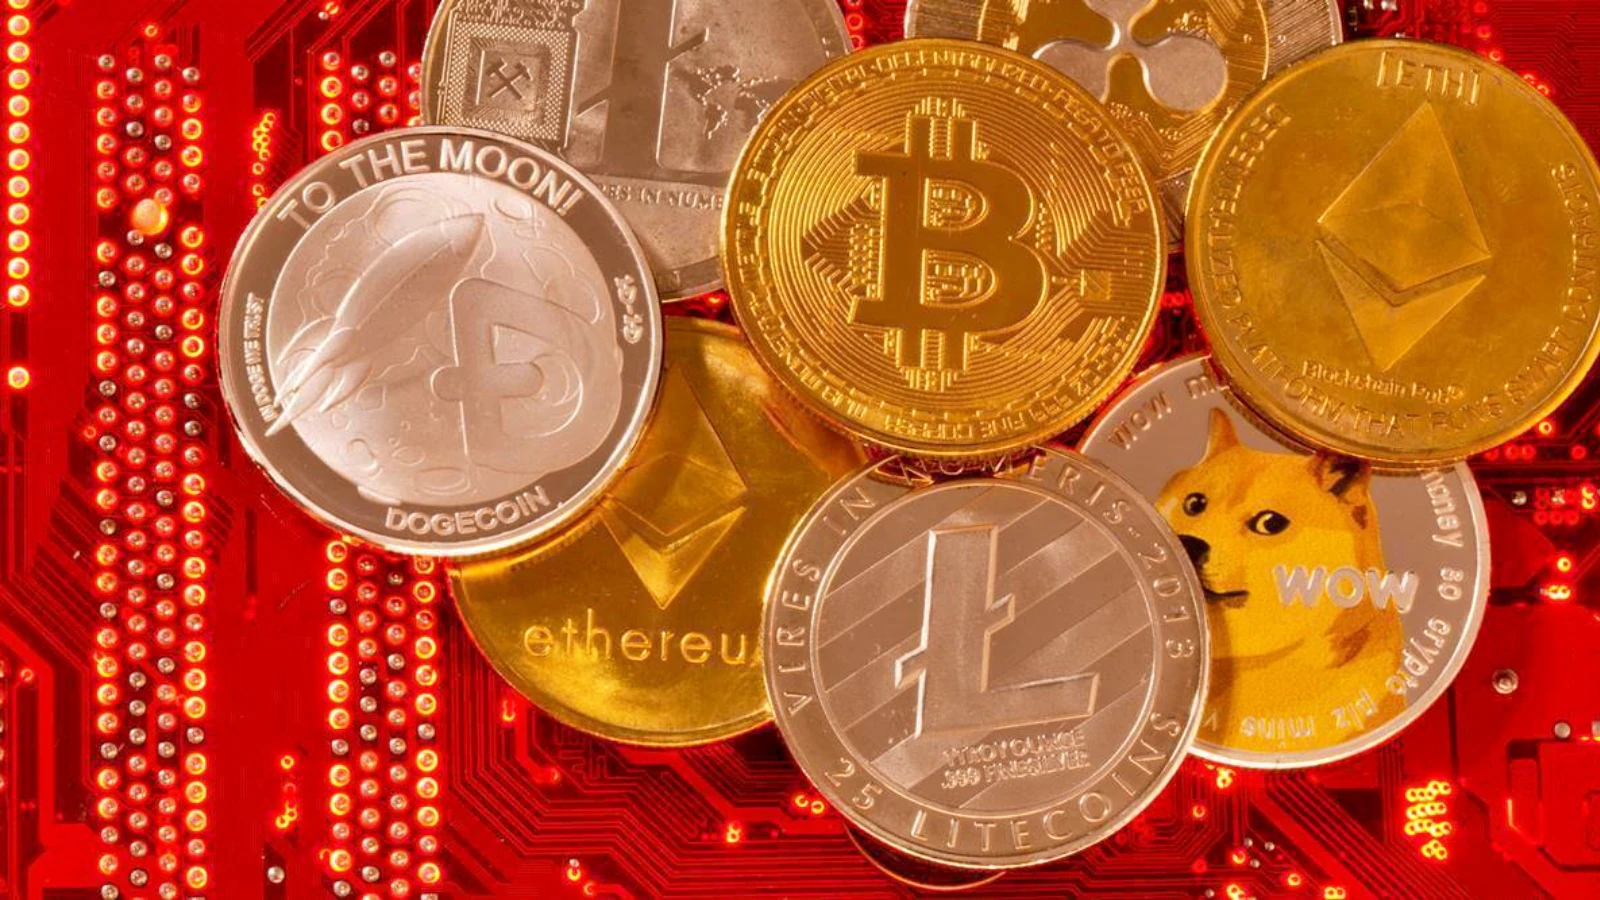
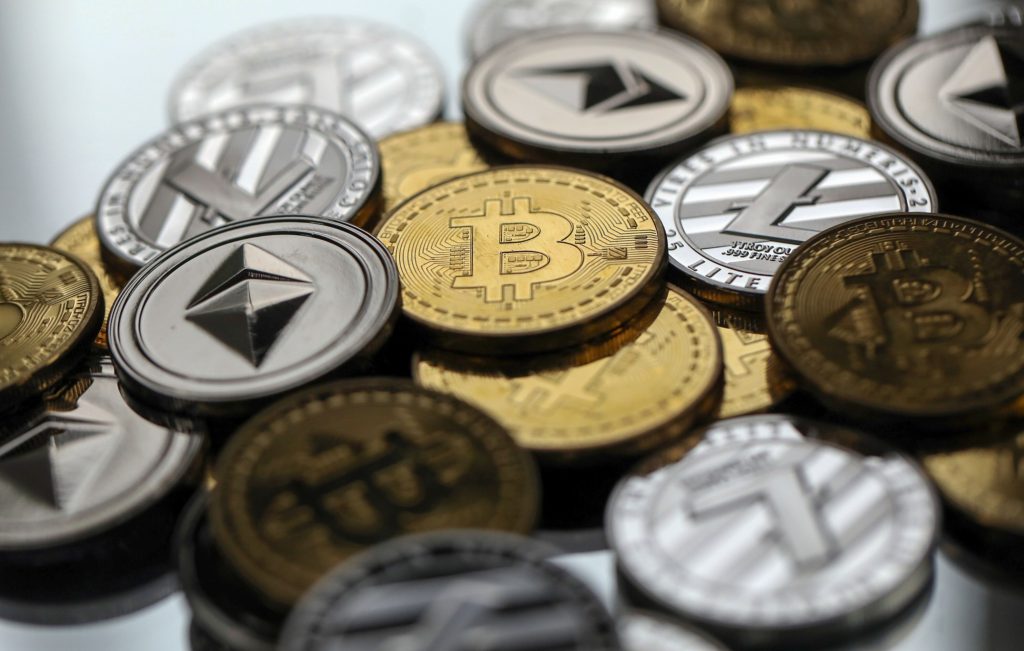
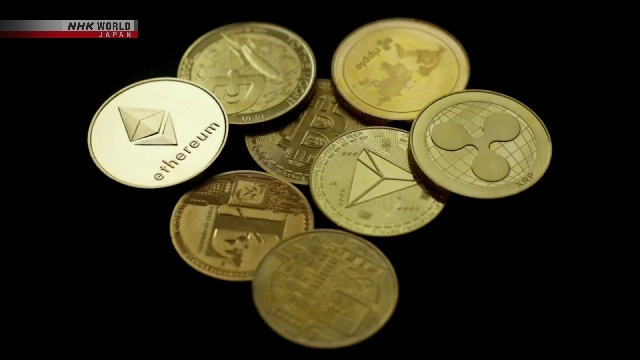
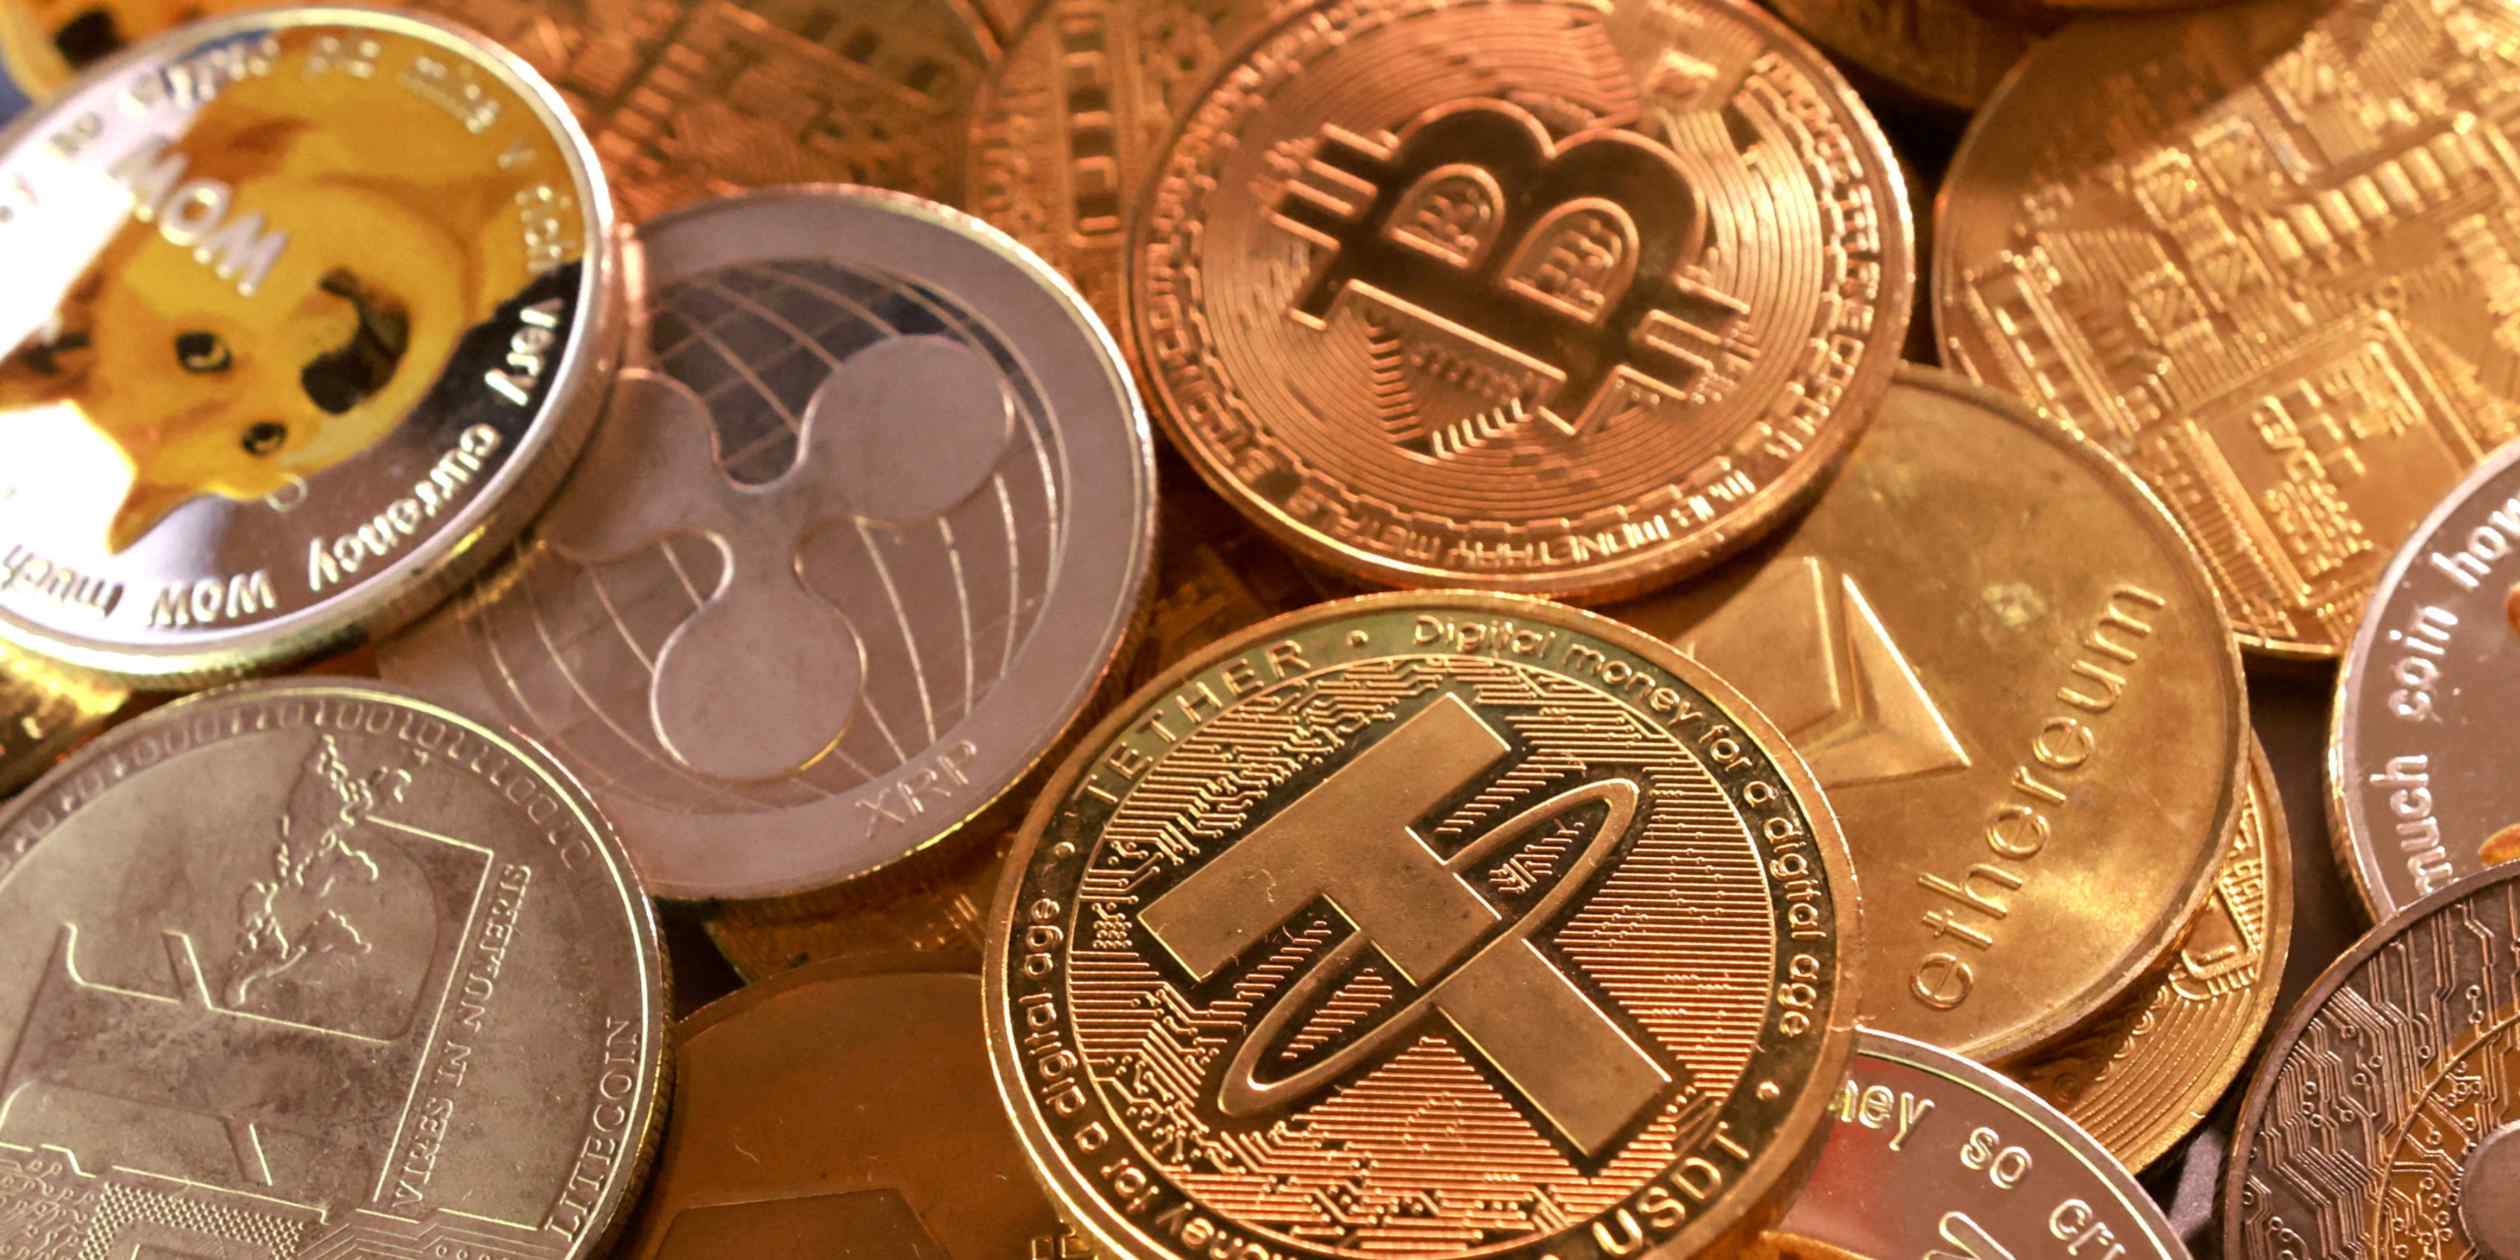
Bitcoin leads the market by a wide margin. Fortune lists its market value at about $1.33 trillion on October 13, 2026. Ethereum ranks second at $233 billion, and Tether is third at $183 billion.
Other outlets report a higher number for Bitcoin. Motley Fool puts it at $1.6 trillion and 24/7 Wall St. says $1.7 trillion. Totals vary by source and date, so they are best read as estimates.

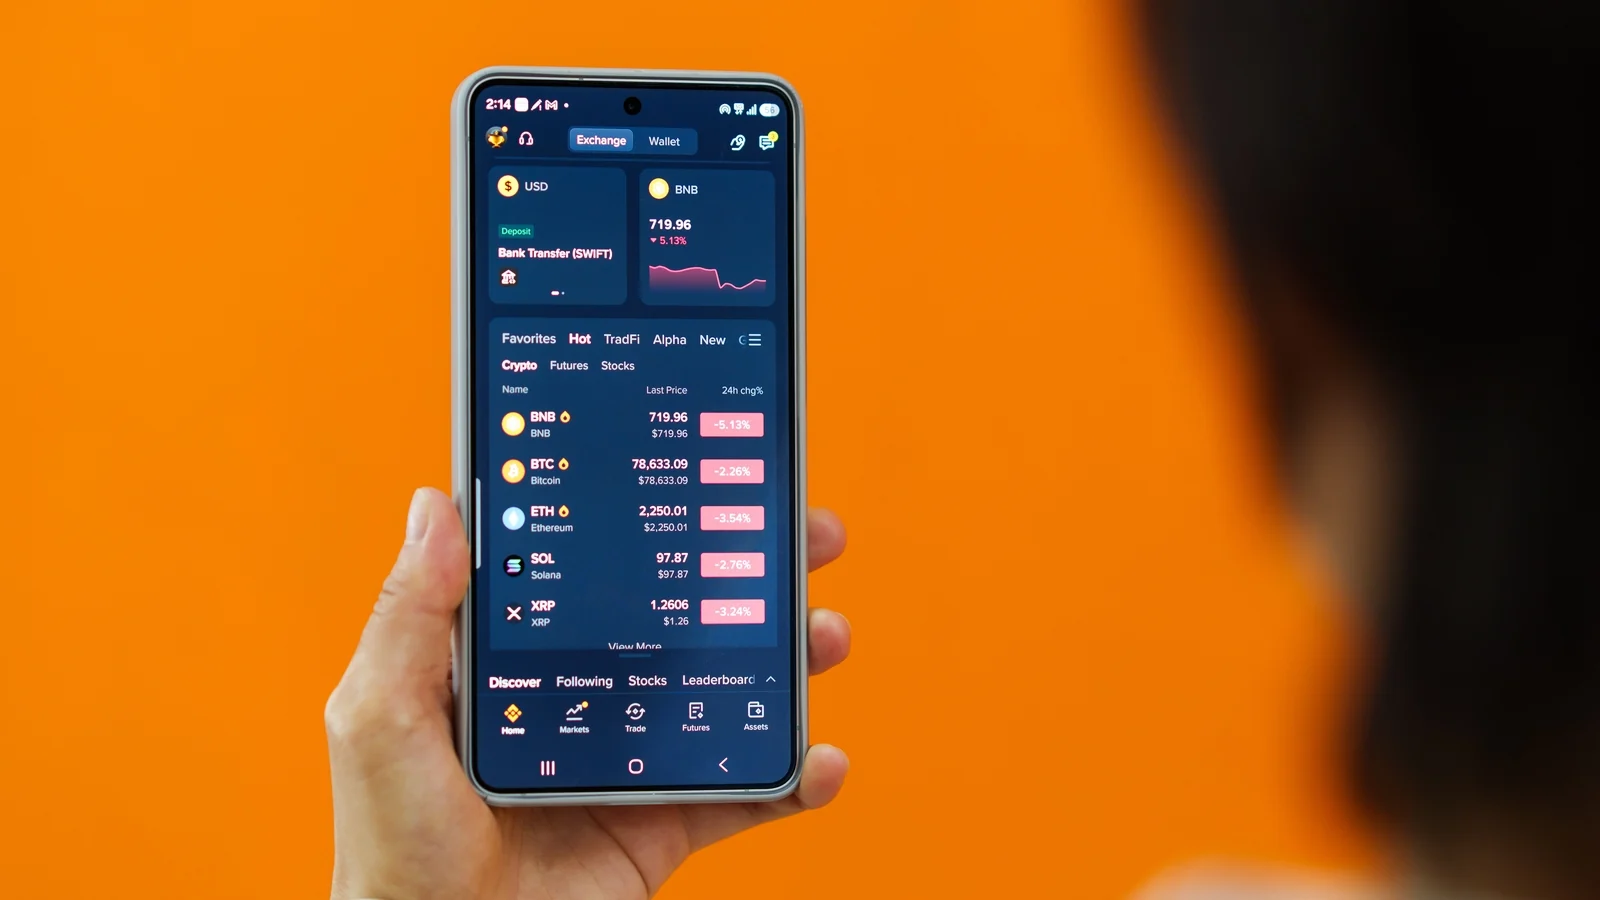
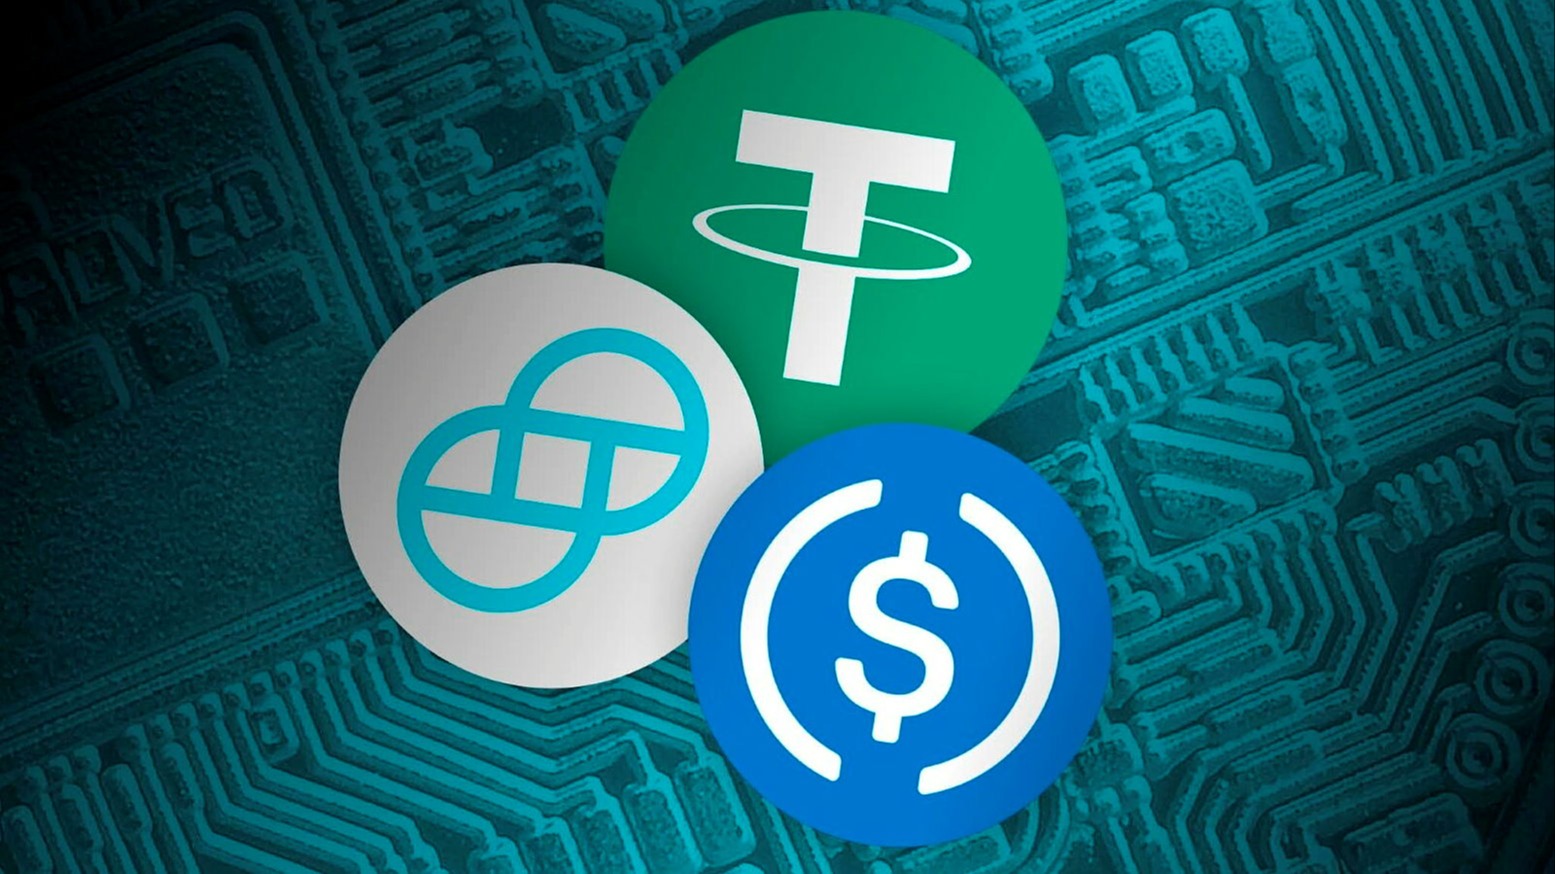
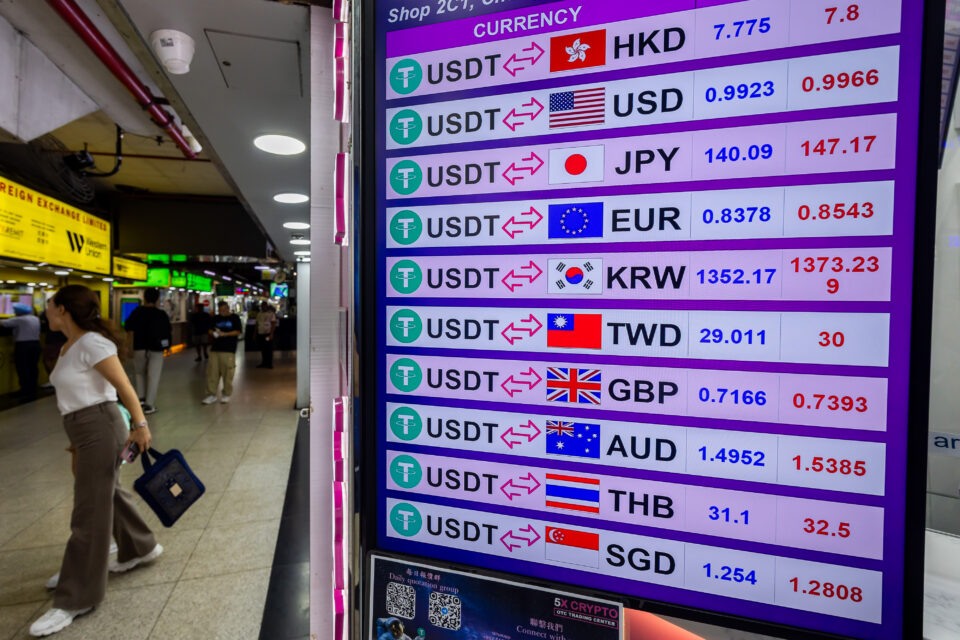
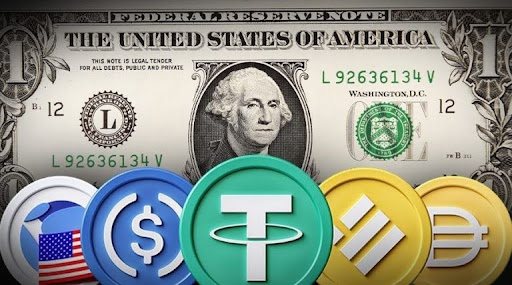
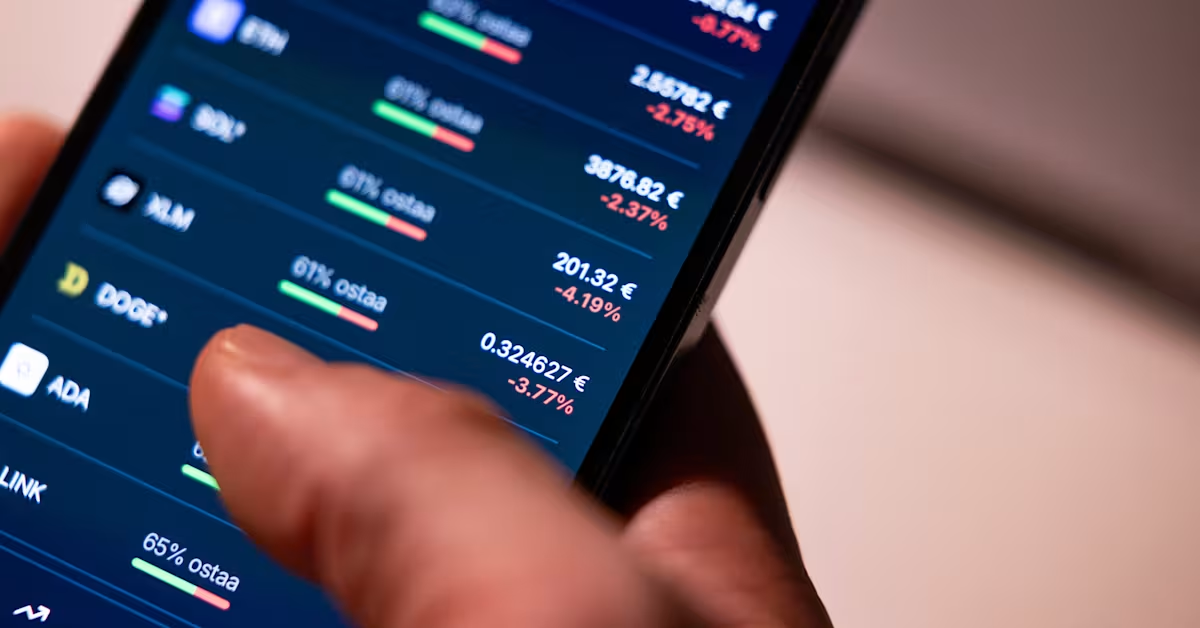
Prices on the same morning show how different these coins are. Tether is a stablecoin tied to the U.S. dollar, so it stays near $1. Bitcoin and Ethereum move far more.
| Coin | Price (7:45 a.m. ET, Oct. 13, 2026) | Main purpose |
|---|---|---|
| Bitcoin | $83,408.20 | Store of value and payments |
| Ethereum | $2,503.64 | Apps and smart contracts |
| Tether (USDT) | $0.99 | Stablecoin tied to the dollar |
| XRP | $1.35 | Fast, low-cost international transfers |
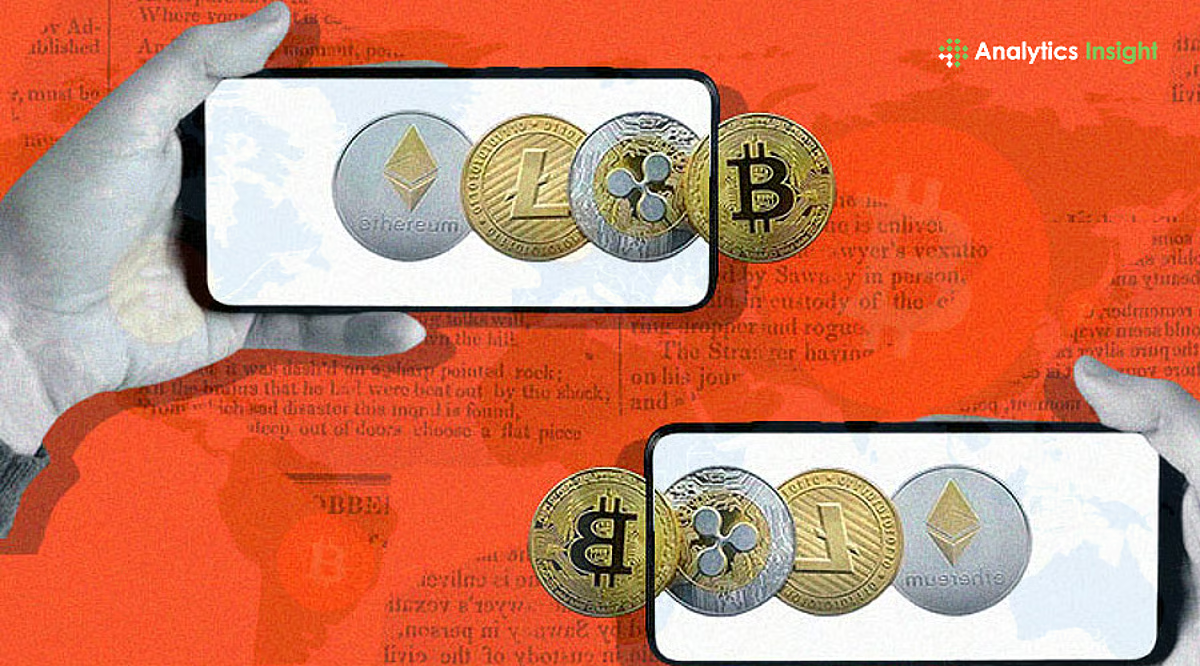
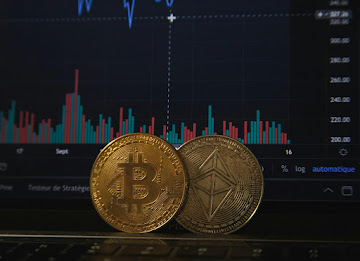
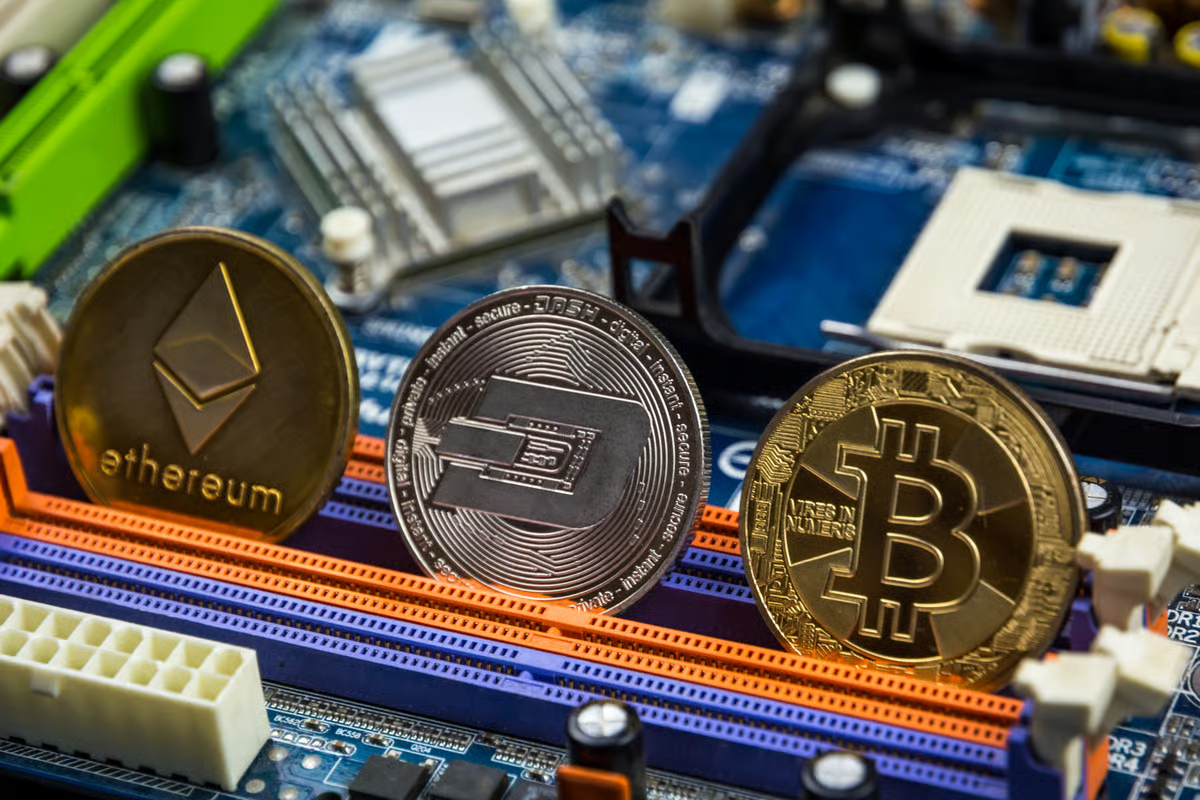
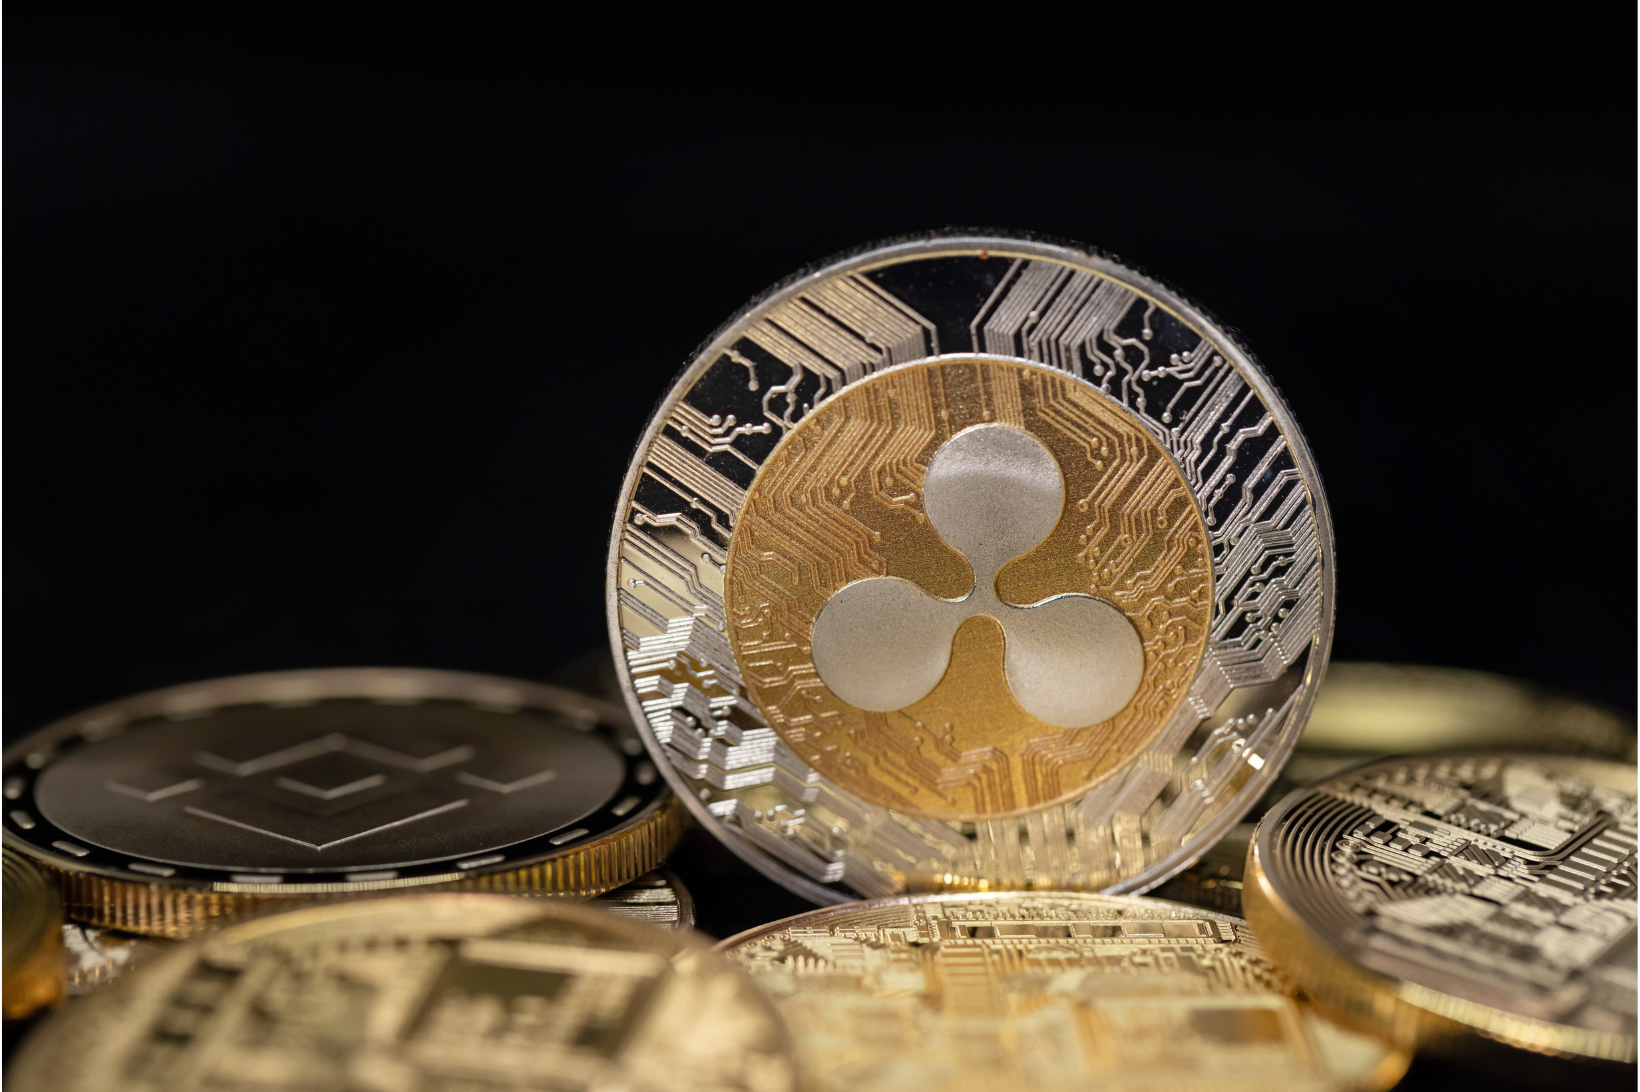
Fortune compares Bitcoin to digital gold and Ethereum to digital oil. Bitcoin is held mostly as a store of value, while Ethereum powers apps built on its network.

Fidelity says a coin’s value comes from supply and demand, its use and belief in its technology. It adds that some coins, such as certain meme coins, are vanity projects and others may be scams. Each coin has to be judged on its own merits.
Many coins do have real uses. Fidelity lists digital payments without a bank, storing value as Bitcoin does, and running apps on blockchain networks as Ethereum does.
Ethereum Price Data: Down 41% in a Year
At 7:45 a.m. ET on October 13, Ethereum traded at $2,503.64. That was $50.33 below the previous morning, a fall of 1.97%.
Over one month the price slipped 0.83% from $2,524.77. Over one year it fell 41.02% from $4,245.28, a gap of about $1,742.

| Time frame | Price | Change to today |
|---|---|---|
| Yesterday | $2,553.97 | -1.97% |
| 1 month ago | $2,524.77 | -0.83% |
| 1 year ago | $4,245.28 | -41.02% |
Ethereum came close to $5,000 at its peak in August 2025. Its 2014 coin offering sold at 31 cents, so the earliest buyers remain far ahead despite the drop.
Fortune links the early 2026 slide to recession worries and to large ETH sales by co-founder Vitalik Buterin. Rival networks such as Solana and Avalanche also offer faster or cheaper options.
Ethereum changed how it works in 2022. It dropped the energy-heavy mining system for staking, where owners lock up ETH to help confirm transactions and earn rewards.
Fortune lists five forces that move Ethereum’s price. They are trader speculation, network use and decentralized finance, the health of the economy, regulation and competition.
Speculation tends to matter most in the short term. Network use matters more over time, as the 2020 to 2021 decentralized finance boom showed when heavy use pushed prices higher.
Bitcoin’s 2026 Price Path
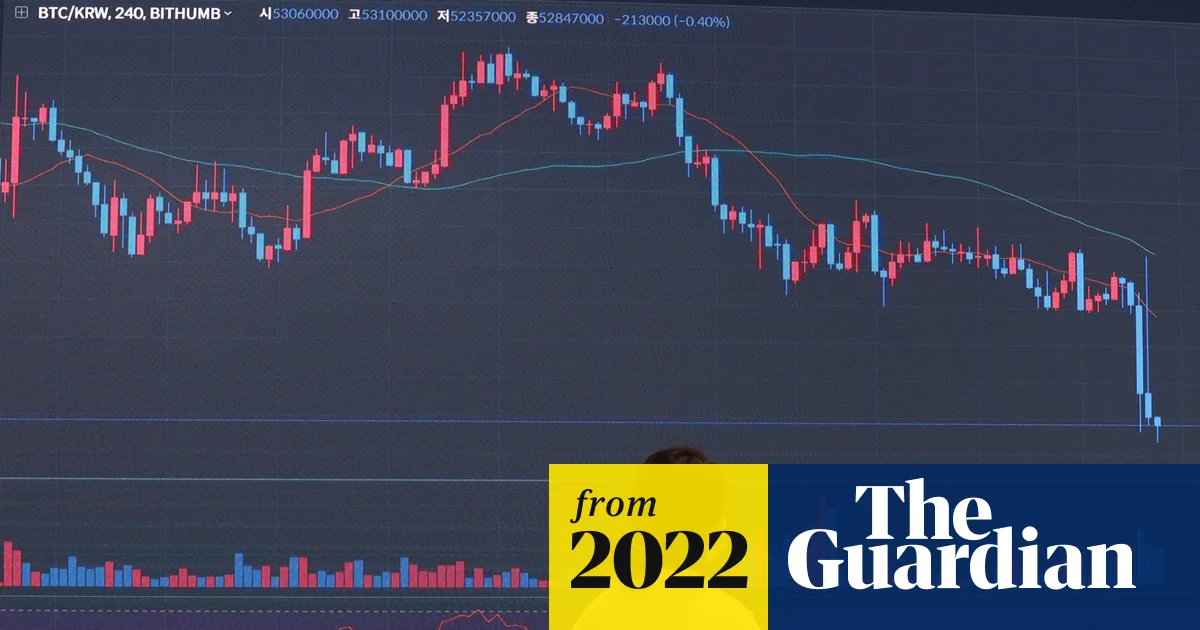
Bitcoin set a record near $126,000 in October 2025. A tariff shock and a wave of forced sales starting on October 10 pushed it below $105,000, according to 24/7 Wall St. Months of ETF outflows followed.
The price closed June 2026 at $58,524 and July at $63,694. It then rose to $87,397 on September 21 and stood at $84,883 on September 27.

That is a gain of 42% in three months, per 24/7 Wall St. Motley Fool measured 33% over five weeks. Even so, Bitcoin is down 3.7% for 2026 and 23% over the past year.
At $84,883 the price sits about 33% below the peak. Put the other way, it needs a gain of about 48% to return to $126,000. The two framings are easy to confuse.
Buying has also cooled. Bitcoin rose 32% over two months, but only 8% in the latest month.
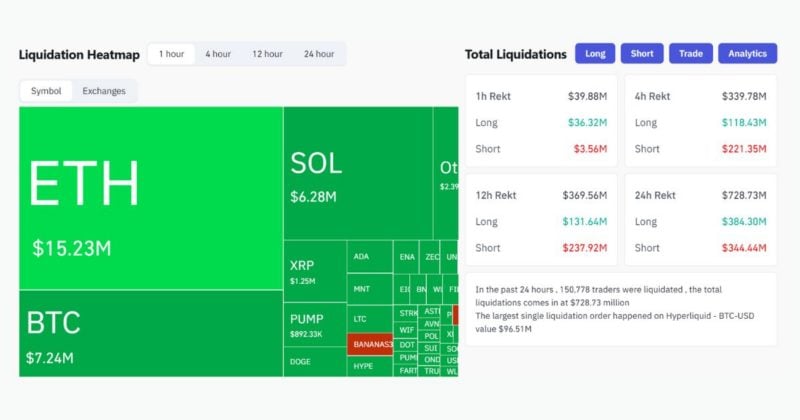
Daily moves can be sharp. Pluang reported $13.95 million in liquidations in one hour on October 14 as the price fell 1.48%, from $83,782 to $82,542.
Industry news has been mixed. Motley Fool says spot Bitcoin ETFs remain popular, and Block has let its Square merchants accept Bitcoin payments.
On the negative side, the Coldcard wallet hack hurt confidence in self-custody. The Motley Fool piece lists it, along with quantum computing, among the risks to watch.
How Bitcoin Has Fallen in Past Cycles
Binaxity’s data show that every earlier Bitcoin cycle included a fall of 77% or more. The 2013 to 2015 drop of about 85% followed the Mt. Gox collapse. The 2017 to 2018 drop of about 84% followed the end of the ICO boom.

| Cycle | Peak-to-trough fall | Time to new high | Catalyst |
|---|---|---|---|
| 2013-2015 | ~85% | ~3 years | Mt. Gox collapse, early regulatory crackdowns |
| 2017-2018 | ~84% | ~3 years | ICO bubble unwind, Chinese mining ban fears |
| 2021-2022 | ~77% | ~2 years | Fed tightening, Terra/Luna and FTX collapses |
| 2024-2026 | ~45% so far | In progress | Post-halving consolidation, ETF outflow pressure |
The current cycle looks deeper than the 45% Binaxity listed in August. Using the June close of $58,524 and the $126,000 peak, the fall was about 54%.
Yearly results show the same pattern. Motley Fool notes that Bitcoin fell 65% in 2022 and then rose 154% in 2023. It also fell 71% in 2018 before gaining 85% in 2019.
Motley Fool argues that this four-year rhythm points to a low before the end of 2026 and a better 2027. Binaxity adds a caution from Morgan Stanley strategists, who say a large asset cannot repeat the gains of a small one.
Volatility Compared With Stocks, Gold and Bonds
Binaxity lists Bitcoin’s annualized volatility over ten years at about 45% to 60%. The S&P 500 sits at 15% to 18%. That puts Bitcoin’s swings at roughly three times those of U.S. stocks.

| Asset | Income | Volatility (10Y) | Main thesis |
|---|---|---|---|
| Bitcoin | None | ~45-60% | Scarcity-driven appreciation |
| S&P 500 | ~1.5% dividend | ~15-18% | Earnings growth plus dividends |
| Gold | None | ~14-16% | Inflation hedge |
| US 10Y Treasury | ~4% coupon | ~6-8% | Capital preservation |
| Real estate (REIT) | ~3-4% yield | ~15-20% | Cash flow plus inflation pass-through |
Bitcoin pays no dividend or interest. Any return has to come from the price rising.
It is often called digital gold, but Binaxity says it has tracked the Nasdaq more closely than gold in recent cycles. Fidelity says crypto is still in a price discovery phase, and swings could ease as the market matures.
Fidelity names several causes of crypto price swings. These include inflation, interest rates, new laws, global conflicts and endorsements from large companies or celebrities.
New crypto products and shifts in who owns crypto also move prices. As more major firms buy and hold crypto, more retail investors could follow, Fidelity says.
The Main Risks Investors Face
Binaxity sorts Bitcoin risk into five groups: volatility, custody, counterparty, regulation and behavior. Each one needs a different response.
| Risk | What it looks like | Common response |
|---|---|---|
| Volatility | Falls of 70% to 85% in prior cycles | Size the position so a deep fall is survivable |
| Custody | Lost keys, hardware failure, phishing | Hardware wallets or qualified custodians |
| Counterparty | Exchange or lender failure | Use regulated platforms |
| Regulatory | Tax or classification changes | Follow agency announcements |
| Behavioral | Panic selling at lows, buying at highs | Set a written buying plan |

Past recoveries took about two to three years. Anyone who sold at the low missed them.
Counterparty risk is real. Celsius, BlockFi, FTX and Genesis failed in 2022 and 2023, and Binaxity notes these were platform failures, not failures of Bitcoin itself.
Self-custody has risks too. Motley Fool reports that a Coldcard wallet hack led to the theft of well over $100 million. It also lists quantum computing as a distant threat.
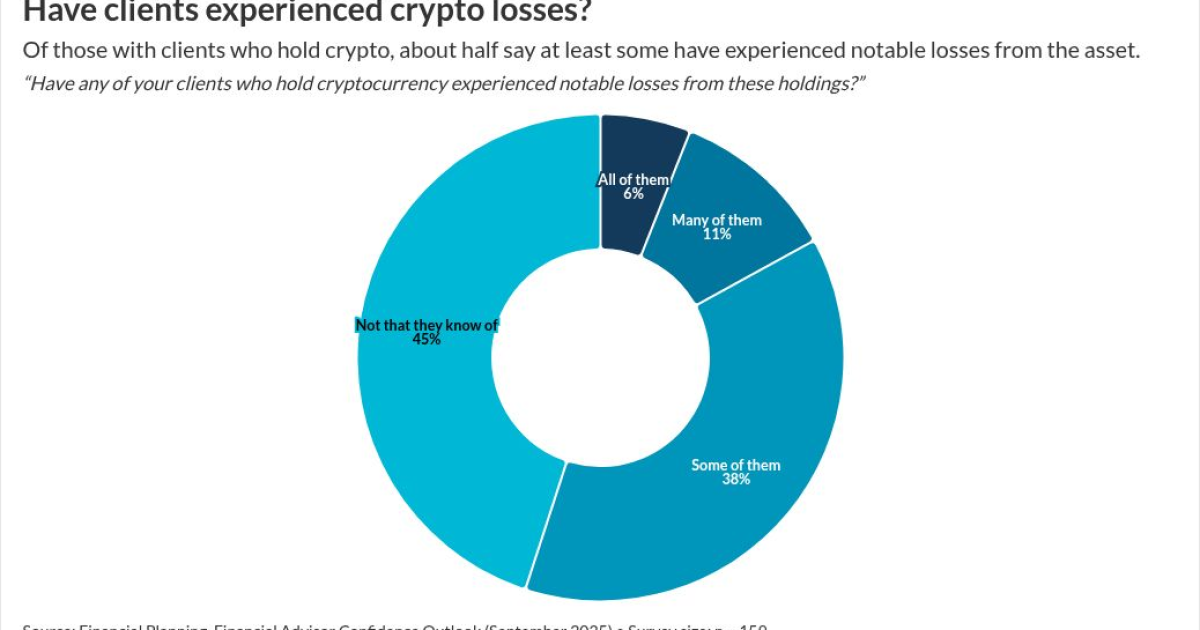
Fidelity adds that crypto is not insured by the FDIC, can become illiquid and may be easier to manipulate than securities. Bitwise’s Matt Hougan called behavioral risk the biggest single risk in this space in a January 2026 Morningstar interview.
How Much of a Portfolio Should Go Into Crypto?
Binaxity says most institutional research points to 1% to 5% of a portfolio for retail investors, and up to 10% for aggressive profiles. Fortune also suggests a modest share inside a diversified portfolio. Both warn against going all in.
| Profile | Suggested share | Reasoning |
|---|---|---|
| Conservative | 1-2% | Small impact even in an 80% fall |
| Balanced | 2-5% | Close to the ~2.5% average Bitwise client holding |
| Aggressive | 5-10% | Investor must accept a paper loss of $8,000 or more per $100,000 |

The math is simple. At 1%, an 80% crash removes 0.8% of the portfolio. At 10%, it removes 8%.
Binaxity also lists steps to take first. These include an emergency fund of three to six months of expenses and paying off high-interest debt. Note that Binaxity is a fintech firm that sells a Bitcoin product, so readers may want to compare its view with neutral sources.
Ways to Hold Crypto
| Method | How it works | Effort |
|---|---|---|
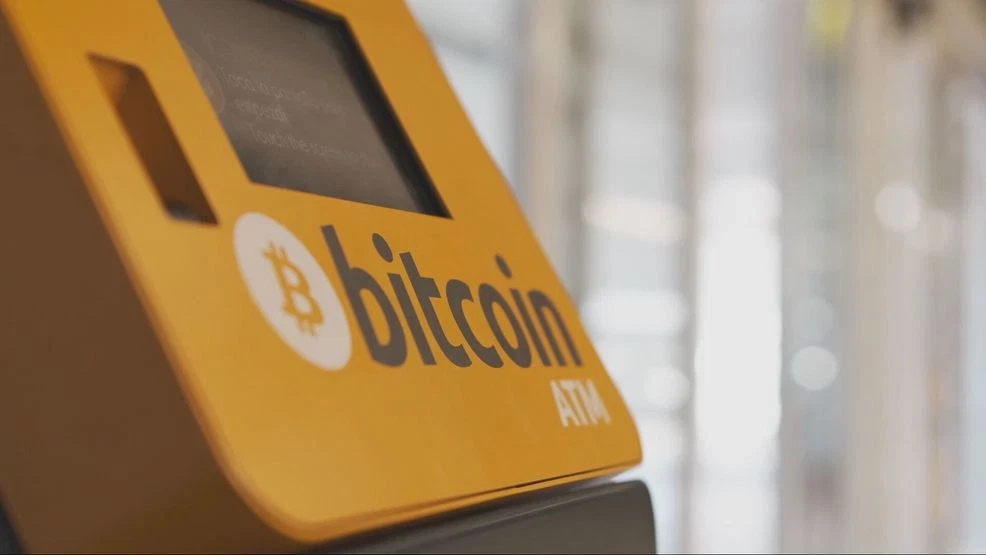
| Crypto exchange | Buy ETH or BTC and store it in a digital wallet | Highest |
| Crypto ETF | Shares that hold crypto and trade like stocks | Low |
| Related stocks | Blockchain firms or companies holding crypto | Low |
| Crypto IRA | Holds crypto in a tax-advantaged retirement account | Medium |
Taxes matter in the U.S. Binaxity says the IRS treats Bitcoin as property, so selling, swapping or spending it is a taxable event. Gains on coins held under a year are taxed as ordinary income.
Swapping Bitcoin for Ethereum also counts as a sale for tax purposes. Binaxity says a forced sale inside a crypto-backed loan is taxable too.
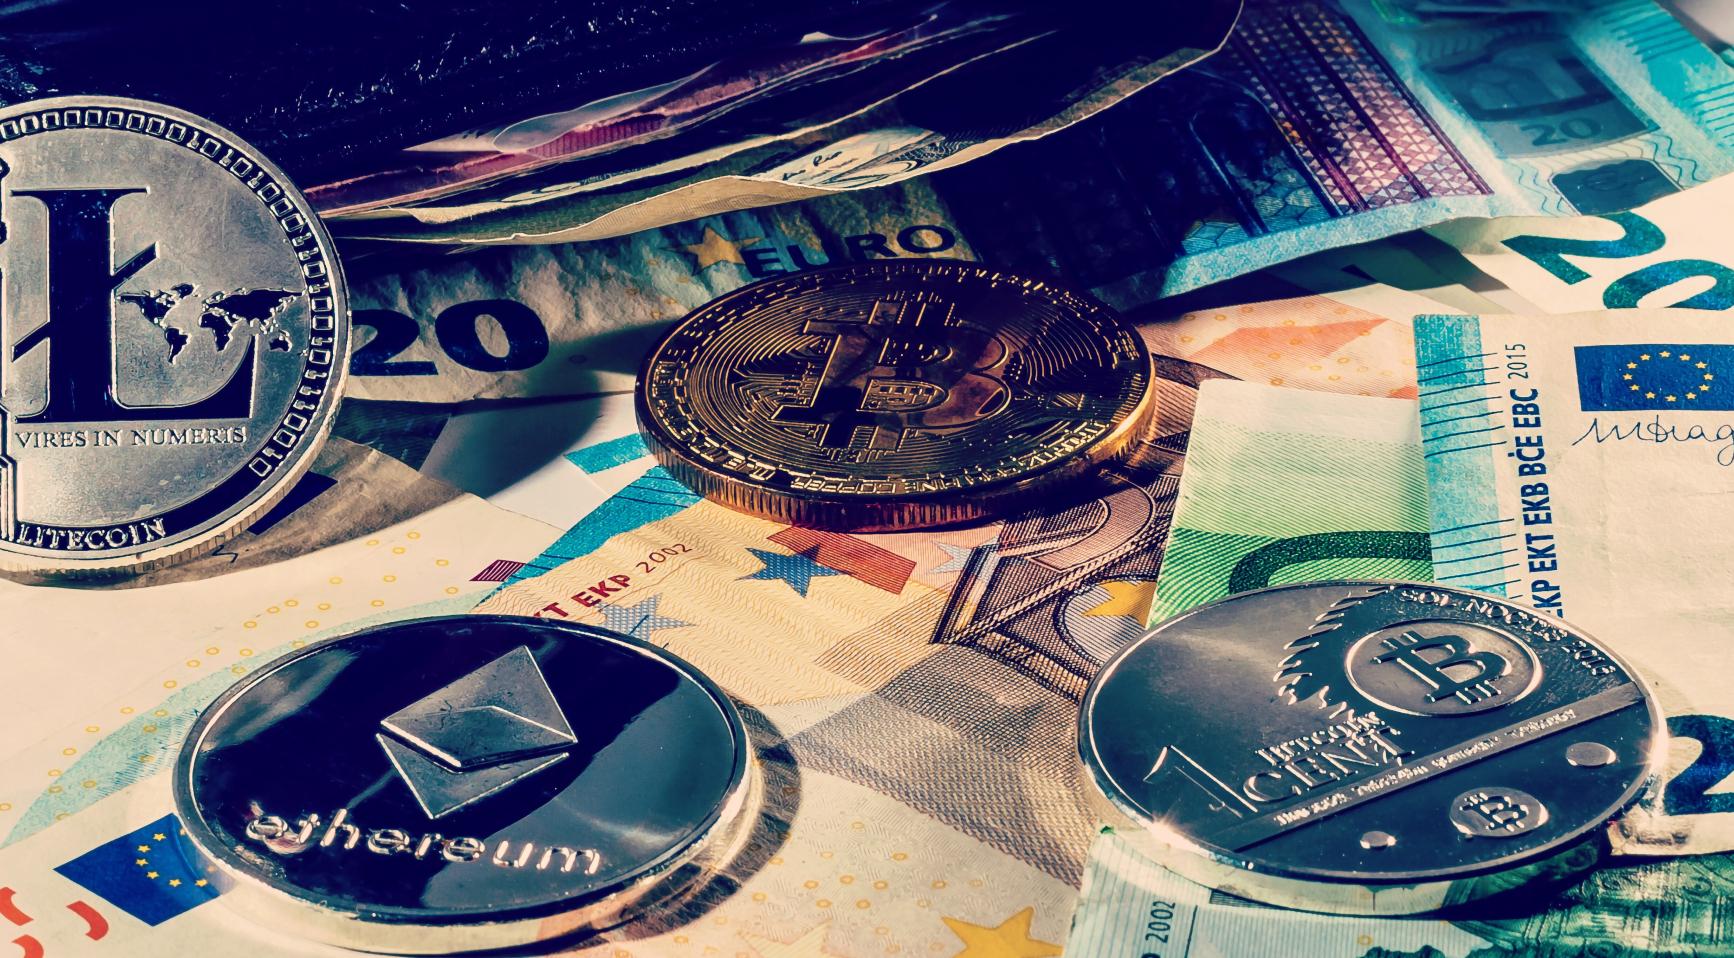
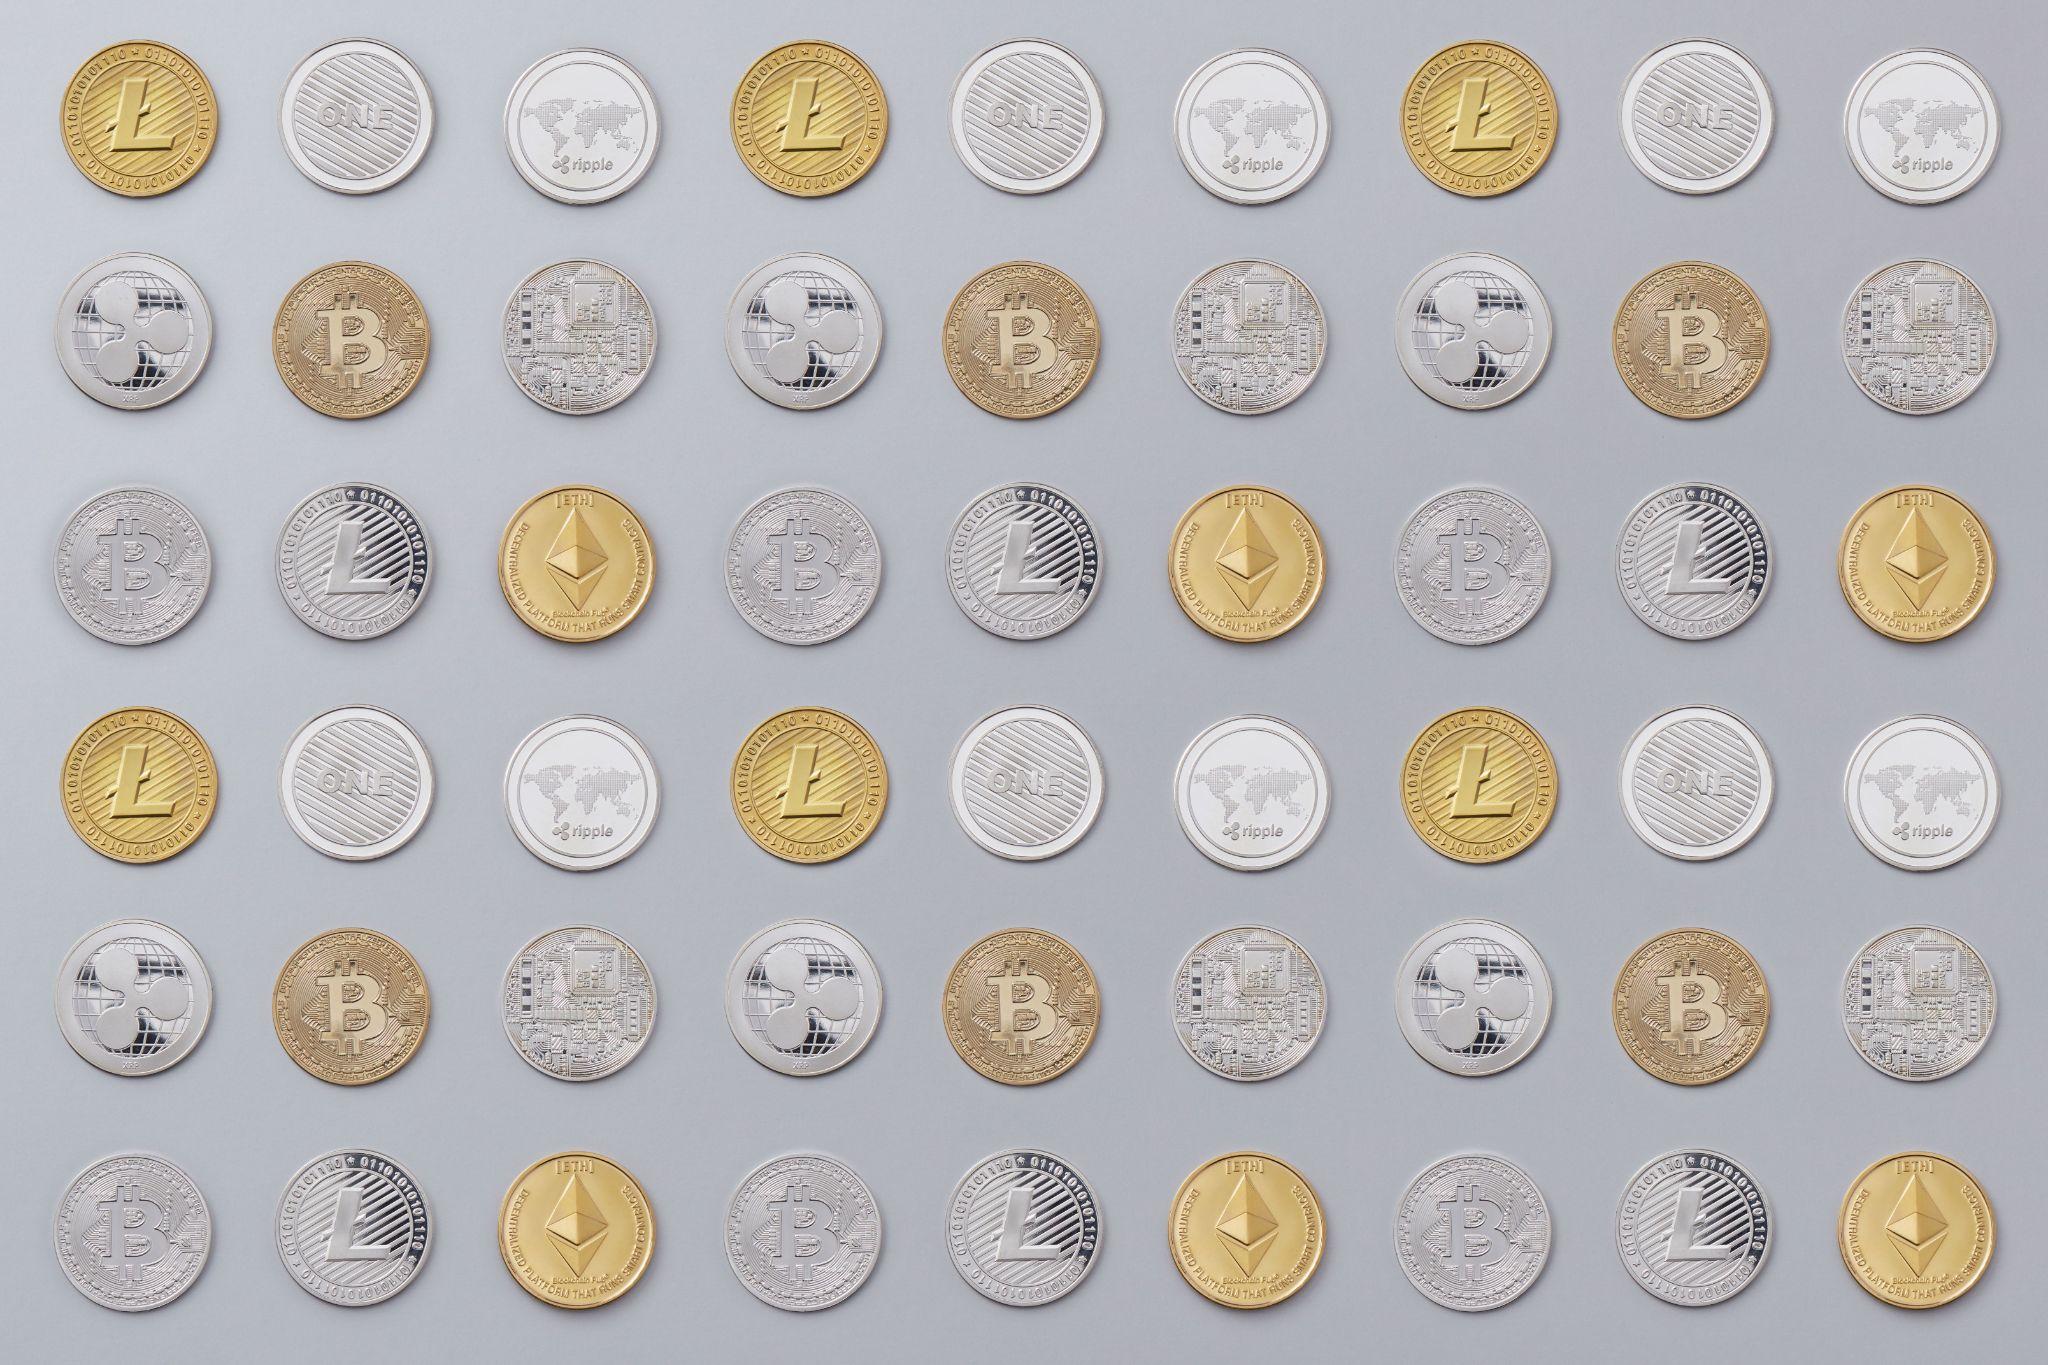
Platforms differ in what they offer. Fidelity currently offers Bitcoin, Ethereum, Litecoin and Solana, and says it has no new coins launching soon. Before adding one, it reviews the coin’s track record, adoption, purpose and rule environment.
Who Owns Bitcoin: ETFs, Companies and Market Share
Bitcoin makes up 59% of the $2.9 trillion crypto market, according to 24/7 Wall St. Its own value is about $1.7 trillion.

For Bitcoin to reach $100,000, its market value would need to rise by about $300 billion. Since it already holds most of the market, 24/7 Wall St. says that money must come from outside crypto.
Institutions are a large source of demand. U.S. spot Bitcoin ETFs have drawn more than $58 billion since January 2024, per SoSoValue data cited by Binaxity. More than 190 public companies hold Bitcoin, and Strategy owned 818,334 coins as of May 2026.
Rules have also become clearer. In March 2026 the SEC and CFTC classified Bitcoin and 15 other digital assets as commodities, Binaxity reports. Coinbase says 2025 rule changes opened the door to new spot ETFs and digital asset treasury companies.
Coinbase also notes that those treasury companies have seen valuation-driven consolidation. It forecasts the stablecoin market could reach about $1.2 trillion by the end of 2028.
Coinbase names other themes for 2026. These include privacy tools, payments made by AI agents, specialized blockchains and the tokenization of real-world assets such as stocks.
Stablecoins, it says, have become the top use case in crypto. It expects growth in cross-border payments, money transfers and payroll.
Inflation, Interest Rates and AI Spending
Inflation is the main economic worry. U.S. consumer prices rose 3.6% to 3.7% in September, with gasoline up 9.1%, according to reports on Pluang. That is well above the Federal Reserve’s 2% target.
Motley Fool says the Fed has just raised rates and another hike could follow. A Motley Fool headline also notes that Treasury yields are above 5%, which can pull money away from riskier assets.

Artificial intelligence is a new factor. Nvidia estimates that the five biggest hyperscalers will spend $1.3 trillion on capital projects in 2027, and Motley Fool says some of that money might otherwise reach Bitcoin.
Even with the swings, long-term holders have done well against tech stocks. Over three years Bitcoin is up 225% and the Nasdaq is up 109%, though the ride included deep falls.
Coinbase took a hopeful view in its December 2025 outlook. It called the U.S. economy resilient but admitted the range of outcomes was wide.
The latest inflation report showed how sensitive prices are. Bitcoin fell about 1% to near $82,600 on October 14, after data pointed to a possible October rate hike.
Bitwise’s Matt Hougan had expected a broader crypto drop of 3% to 5%, as reported on Pluang. Bitcoin’s smaller fall was seen as a sign of relative strength, while Optimism’s token rose nearly 20% the same day.
What Forecasts and Prediction Markets Say
Prediction markets lean cautious for 2026. Polymarket gives Bitcoin a 27% chance of hitting $100,000 this year, and sees a stronger chance of a drop toward $80,000. Kalshi’s October forecast is $87,000, with a year-end figure near $83,554.

Longer-term odds improve. Traders see about a 70% chance of $100,000 by the end of 2027. A separate Kalshi market, per a 24/7 Wall St. headline, puts the split at 17 to 83 between $50,000 and $100,000 coming first.
24/7 Wall St. expects Bitcoin to trade between $63,694 and $100,000 in 2027. A monthly close below $63,694 could send it back toward $58,524.
To pass $100,000, it says, Bitcoin must stay above its July close, end 2026 higher and clear its September high of $87,397. BitMEX co-founder Arthur Hayes expects $126,000 by year end, but 24/7 Wall St. says the math to get there is hard.
Forecasts reflect trader bets and opinion, not facts. They can change quickly.
So, Is Crypto a Good Investment?
The sources agree on one point: it depends on the investor. Fidelity says crypto may make sense for long-term investors with high risk tolerance. It says people who will not stay invested for more than three years may want to look elsewhere.

Binaxity suggests a four-year minimum, which matches the length of past Bitcoin cycles. Both views point to patience as a requirement.
Fortune says crypto is not ideal for anyone who loses sleep over market swings. It advises readers to watch competing projects and avoid putting everything into one asset.
The data show large gains and deep falls in the same few years. Bitcoin is about 33% below its peak after a 42% rally, and Ethereum is down 41% over twelve months.
This article is for general information and is not financial advice. Readers should speak with a licensed adviser before investing.