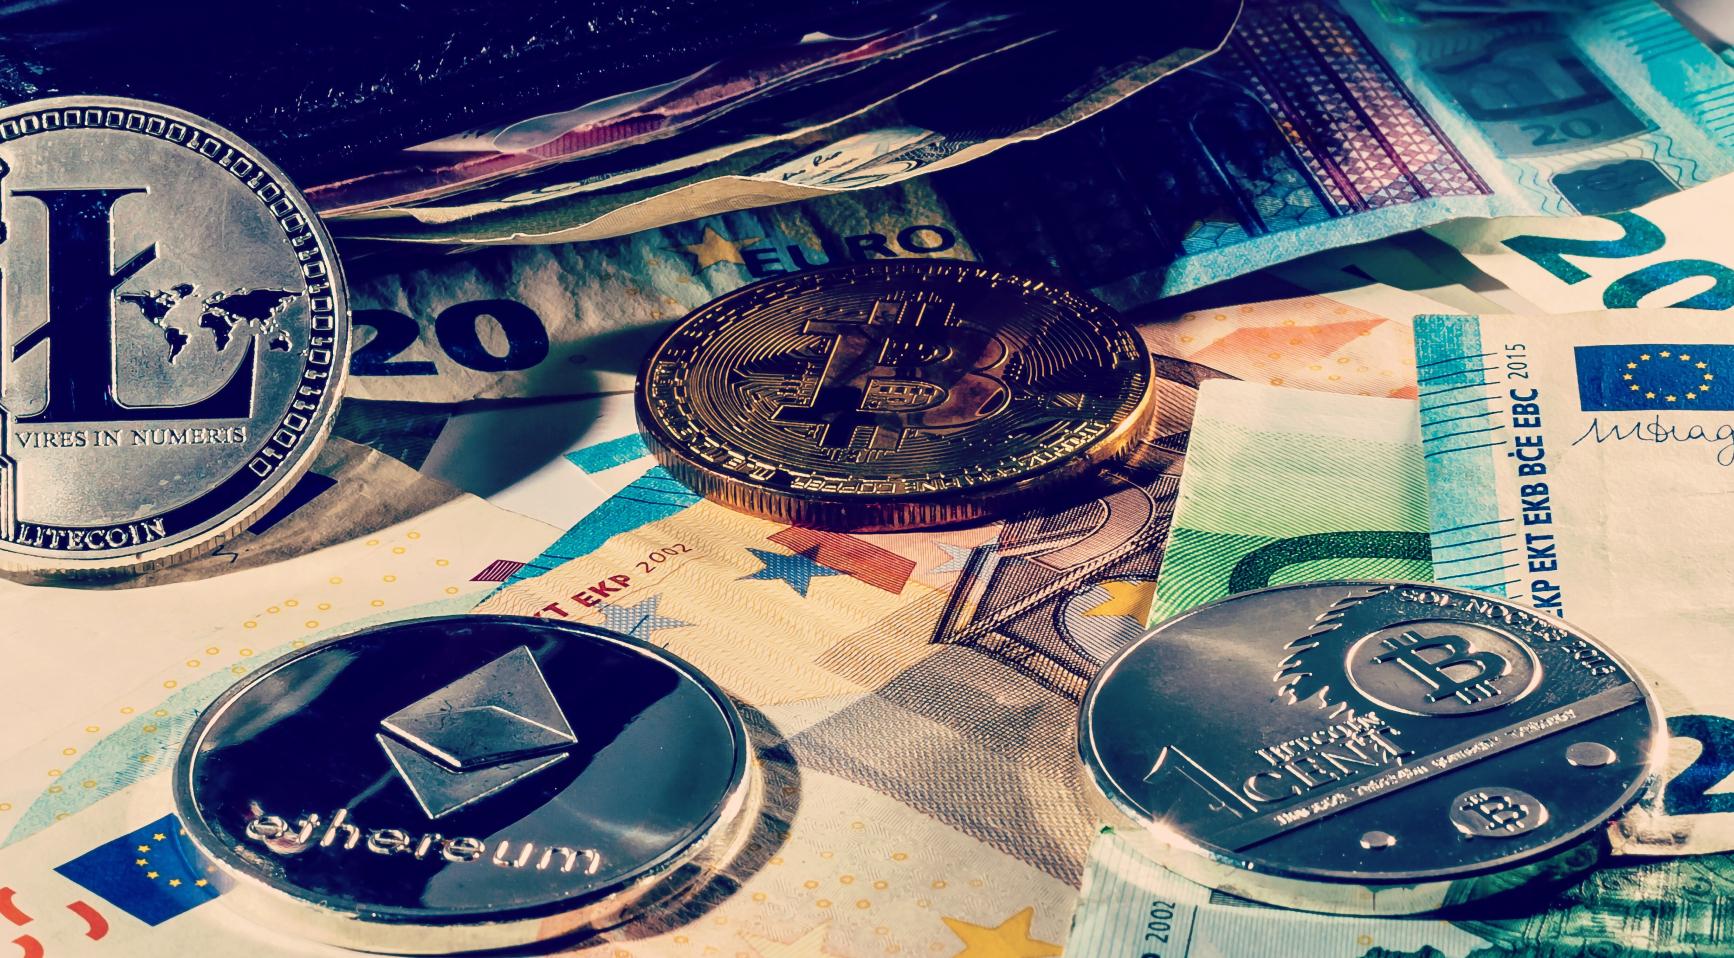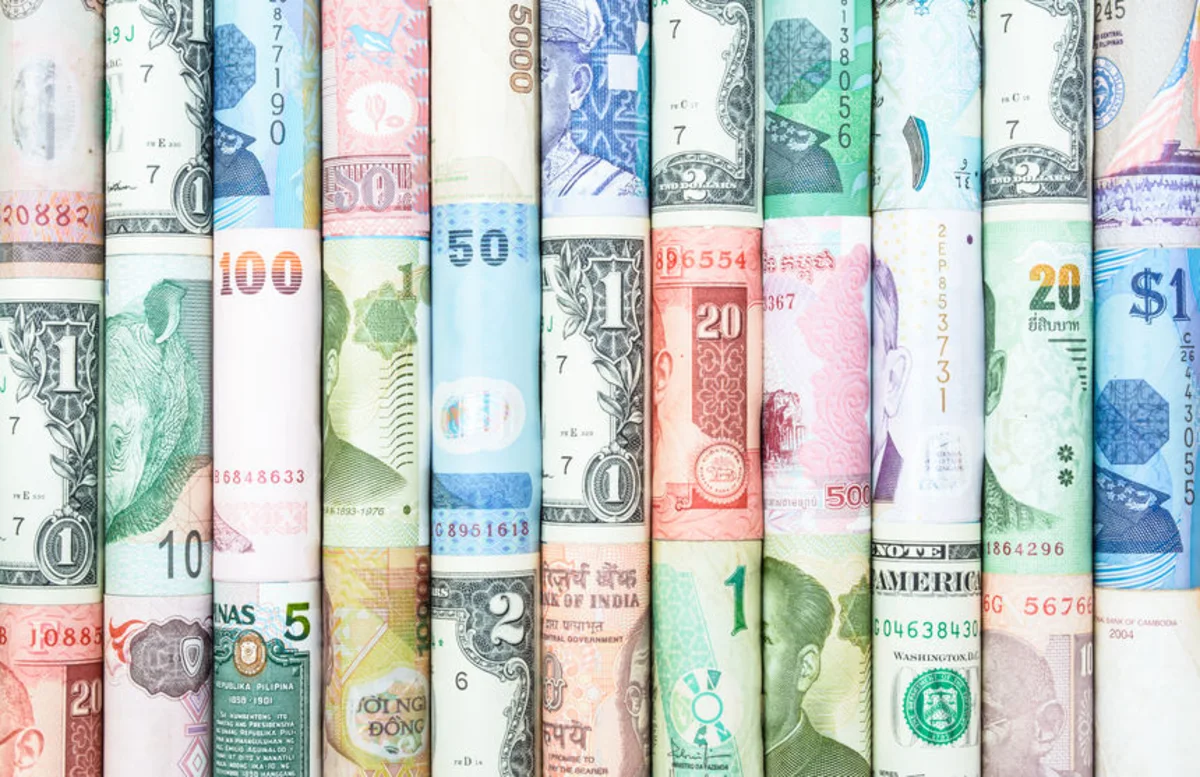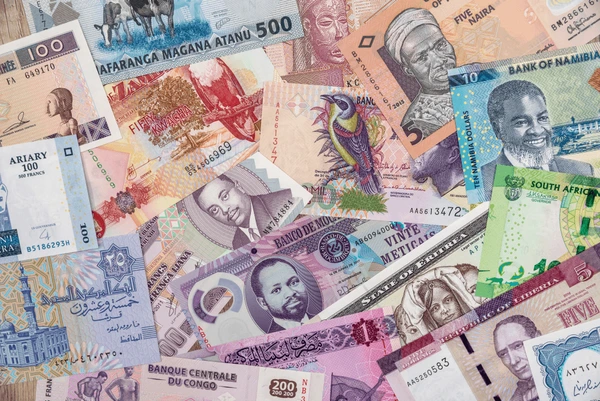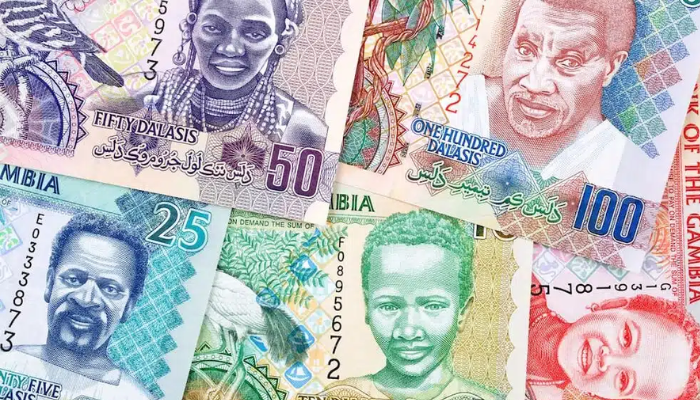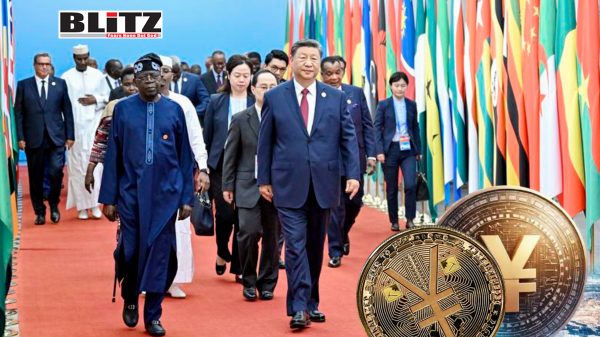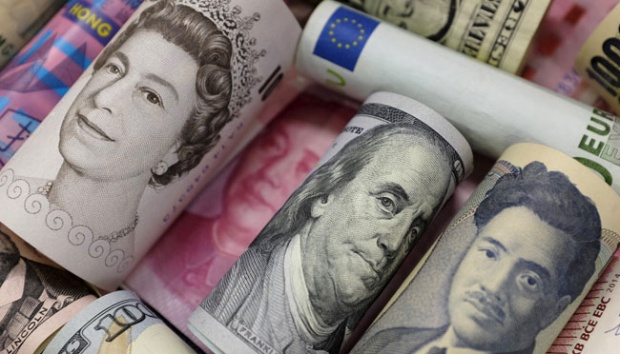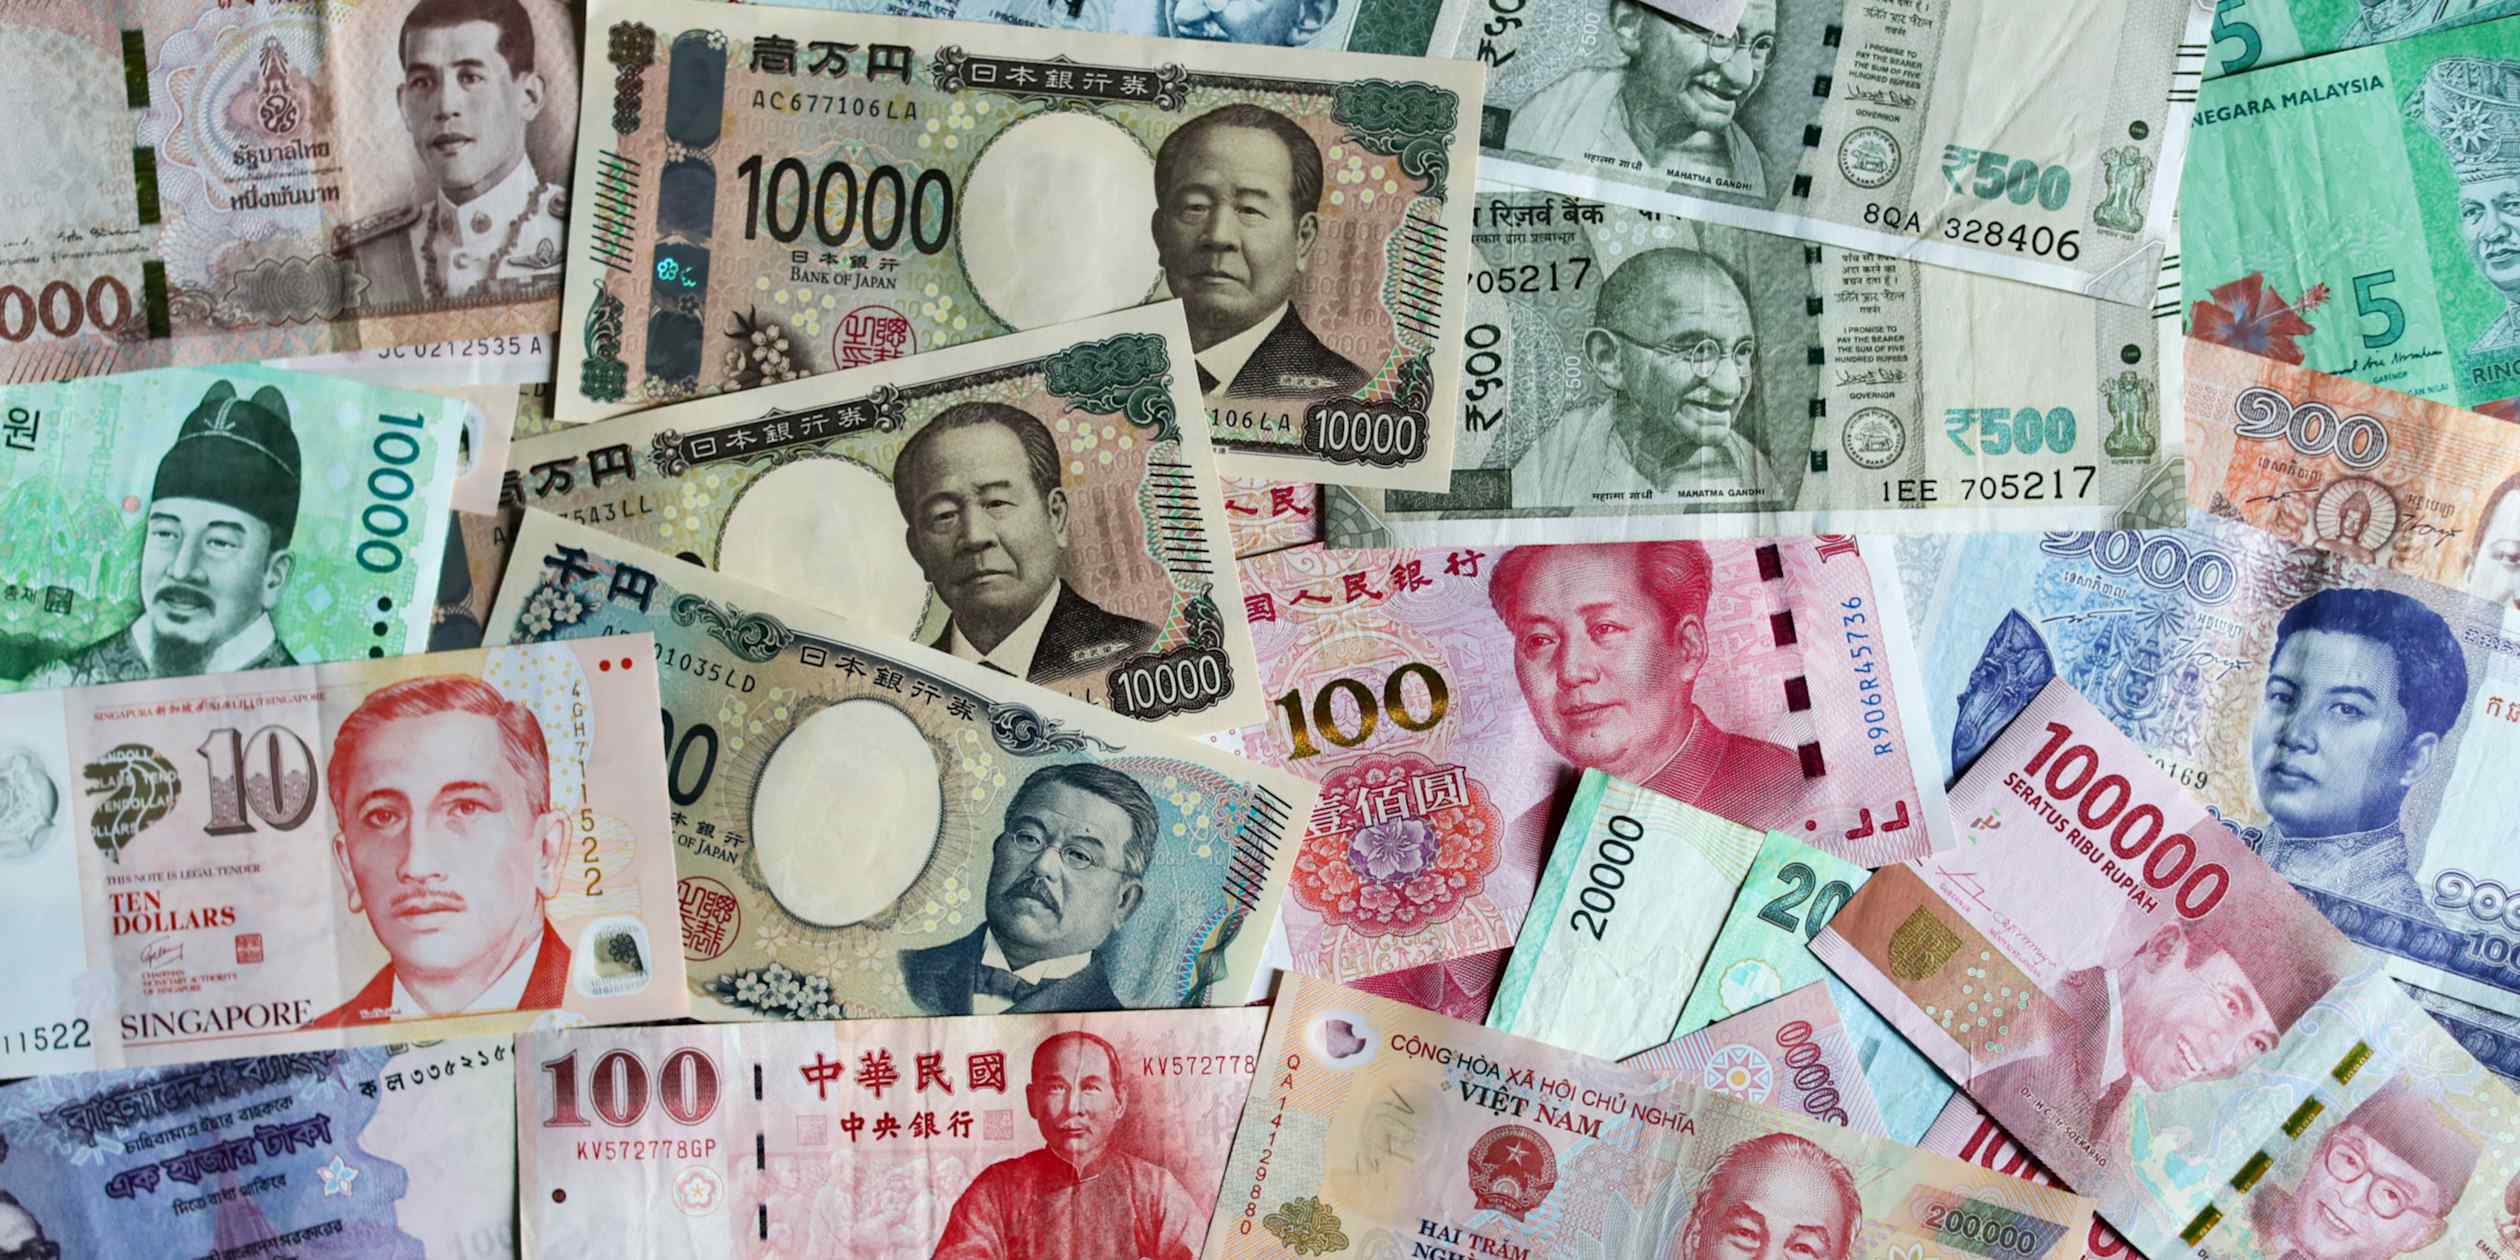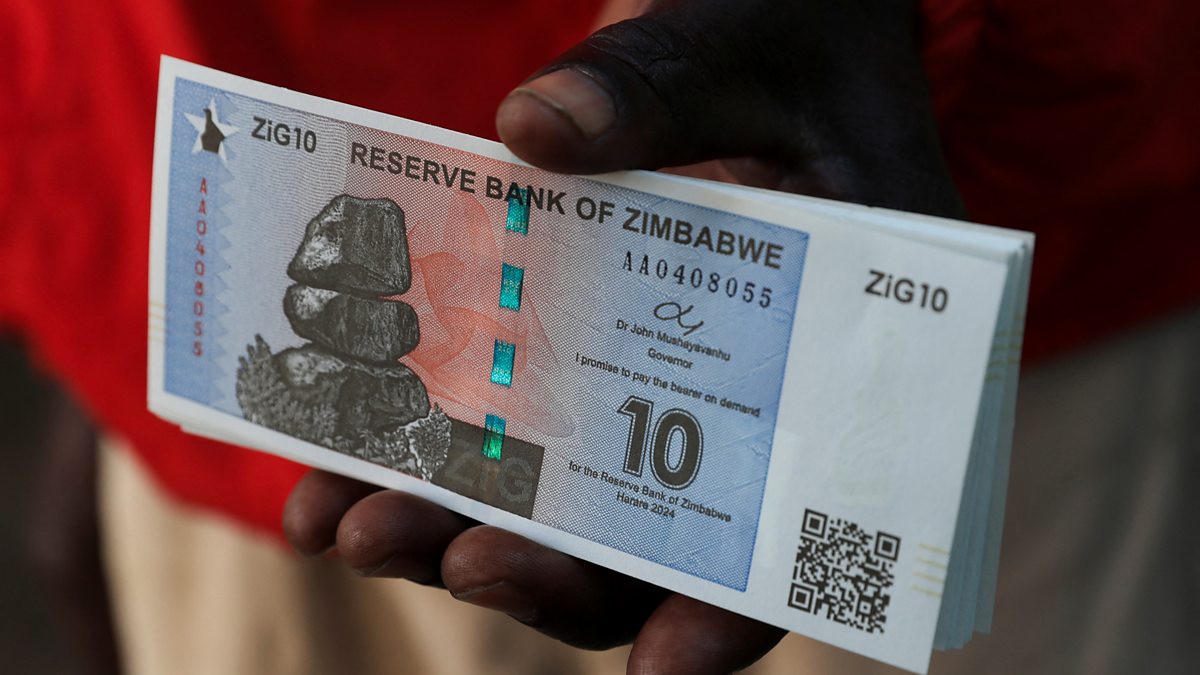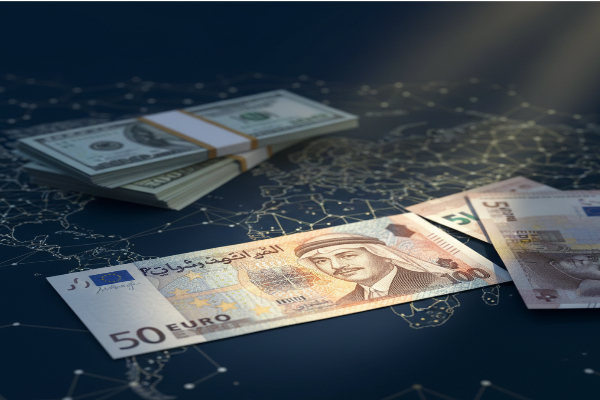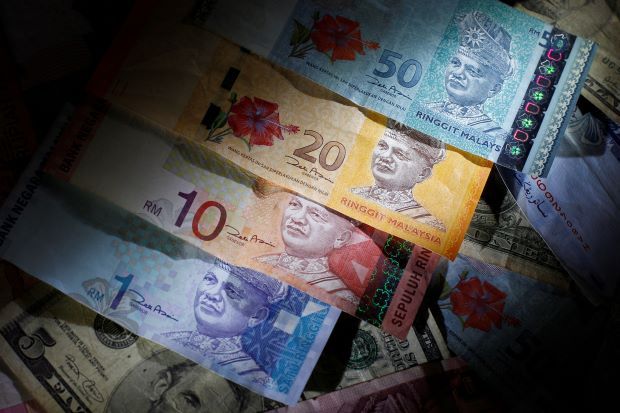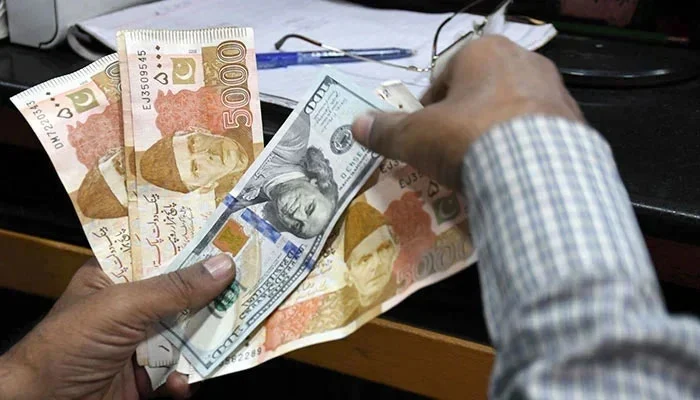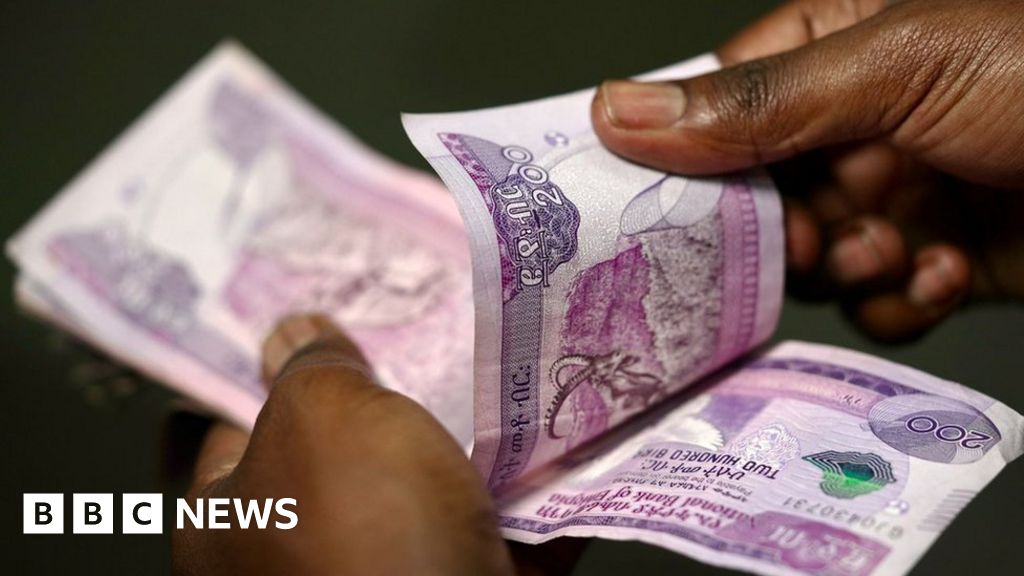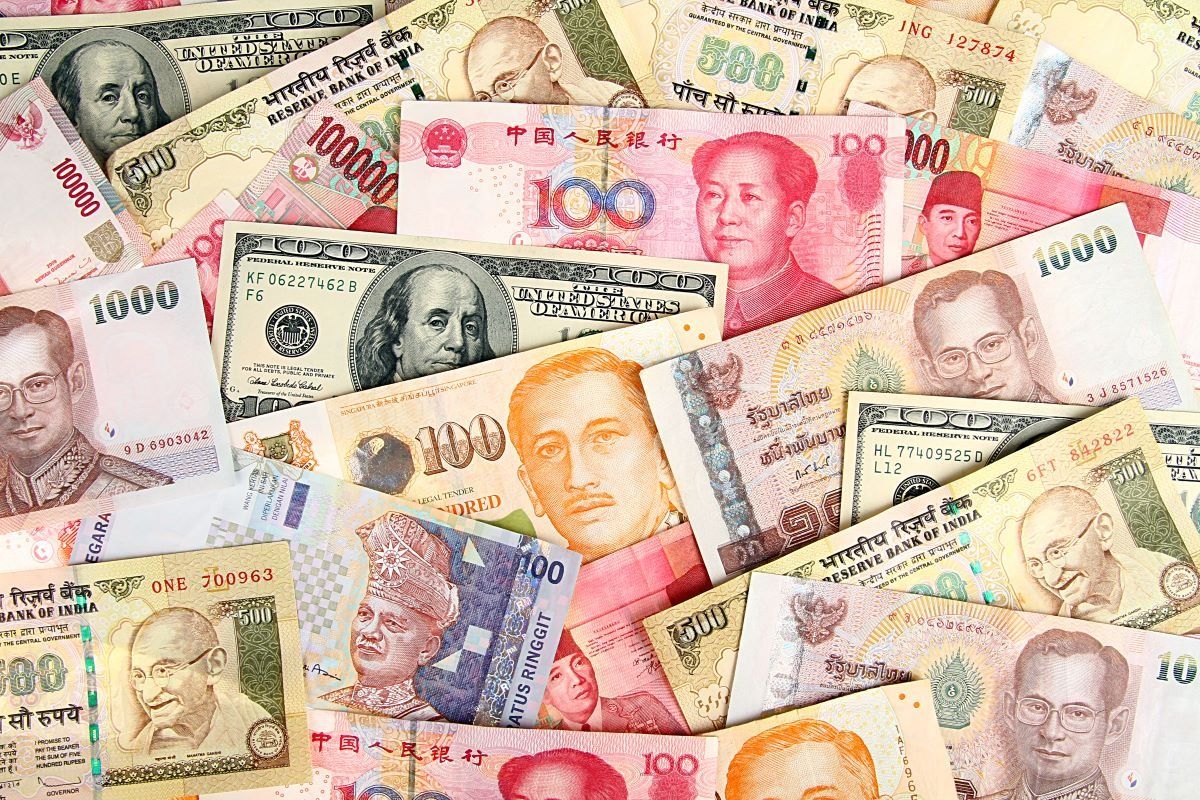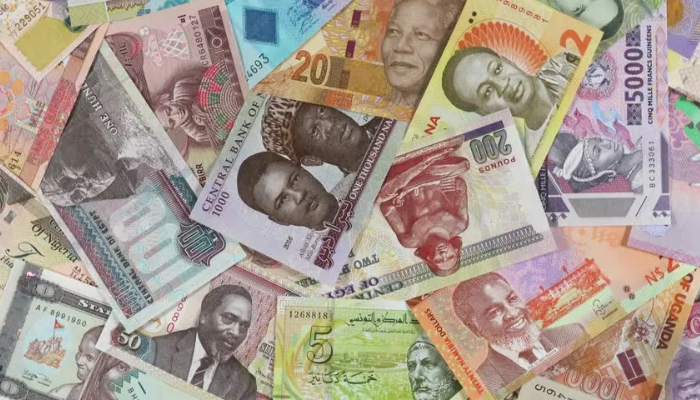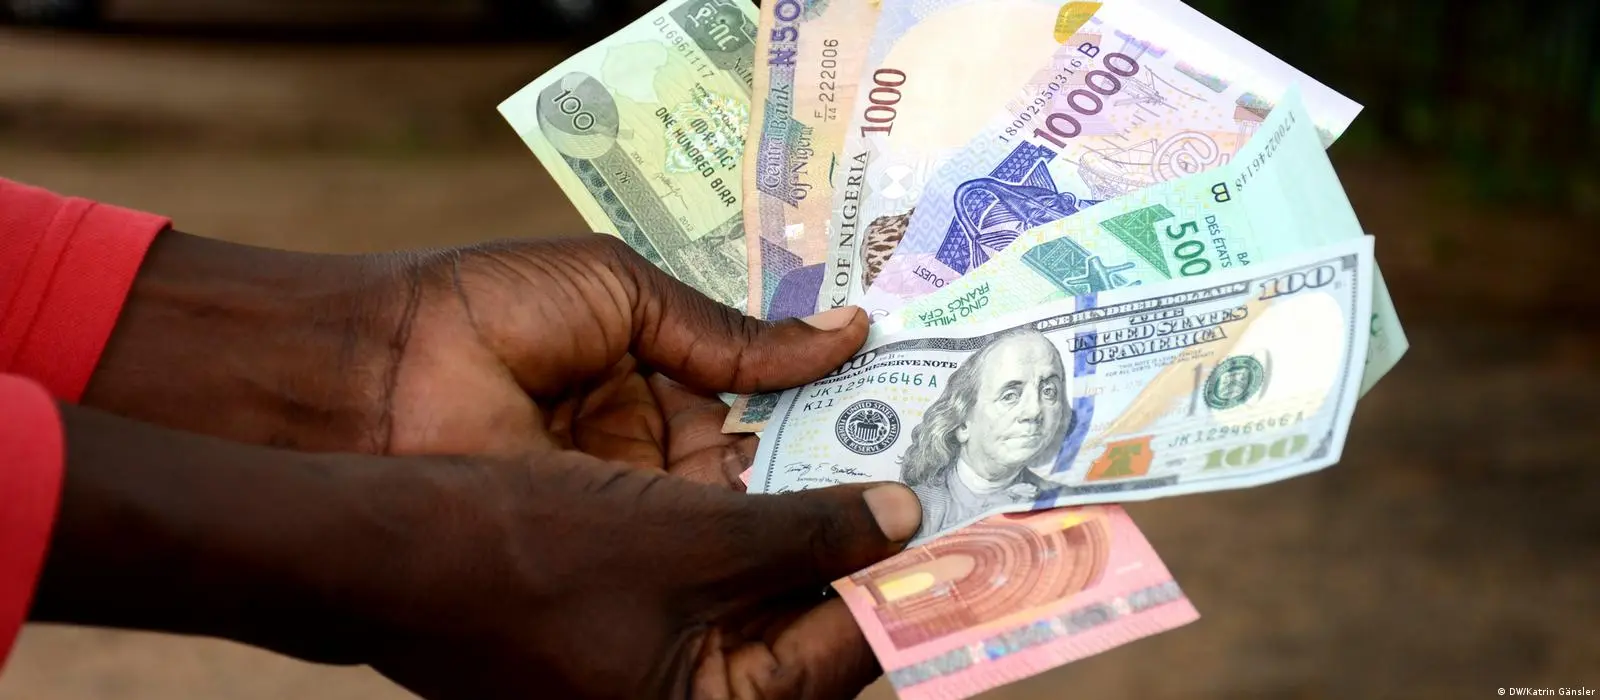
Africa’s currency landscape at the start of August 2026 continues to reflect a sharp divide between the relative stability of North African economies and the volatility affecting many countries elsewhere on the continent.
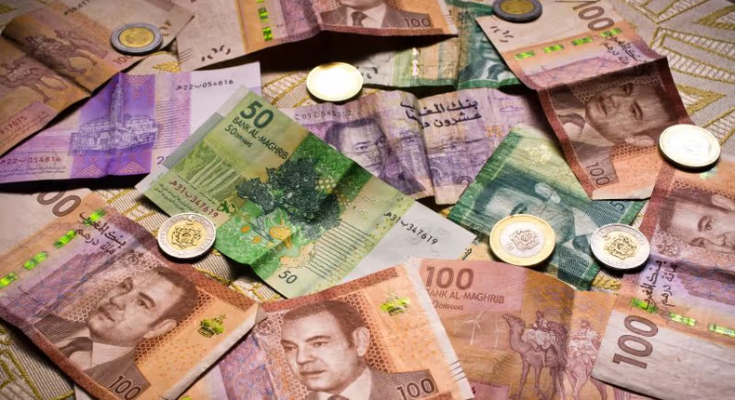
![Moroccan Dirham [Medium]](https://image.api.sportal365.com/process/smp-images-production/pulse.com.gh/28102024/f7044bbd-c787-49d3-8312-182ba0fef19d?format=webp)
Moroccan Dirham [Medium]
![Lybian dinar [Getty/file photo]](https://sportal365images.com/process/smp-images-production/pulse.com.gh/03082026/03cb3ded-18ac-4efa-893a-3d7eb5c5fcdd.jpg?operations=fit(770:)&format=webp)
Lybian dinar [Getty/file photo]
&format=webp)
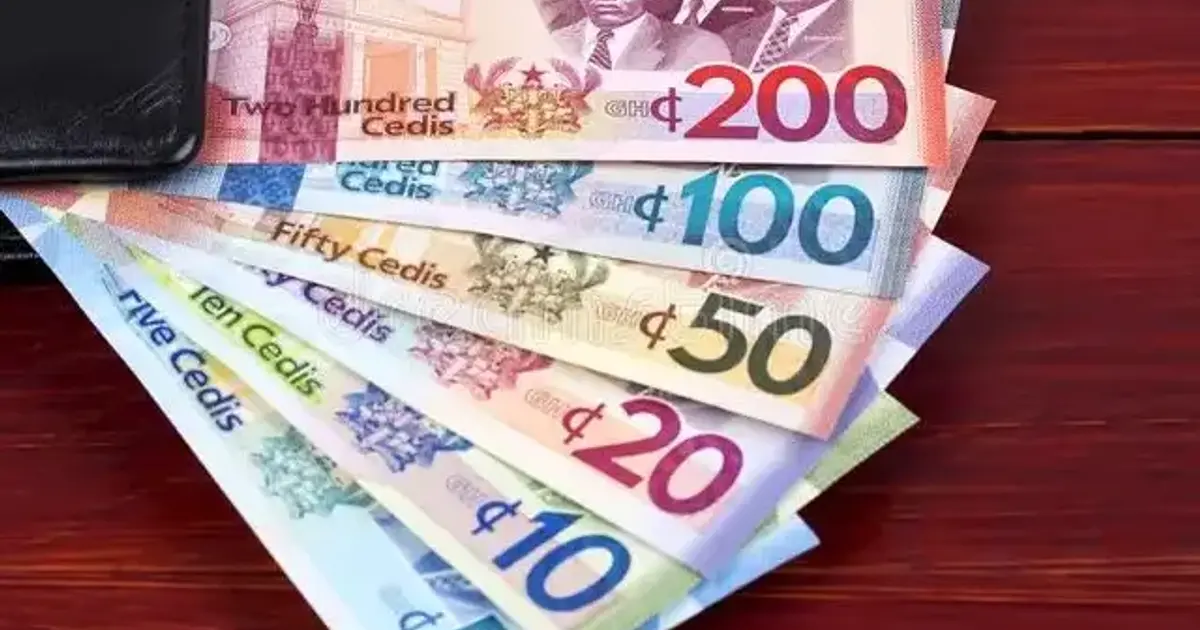
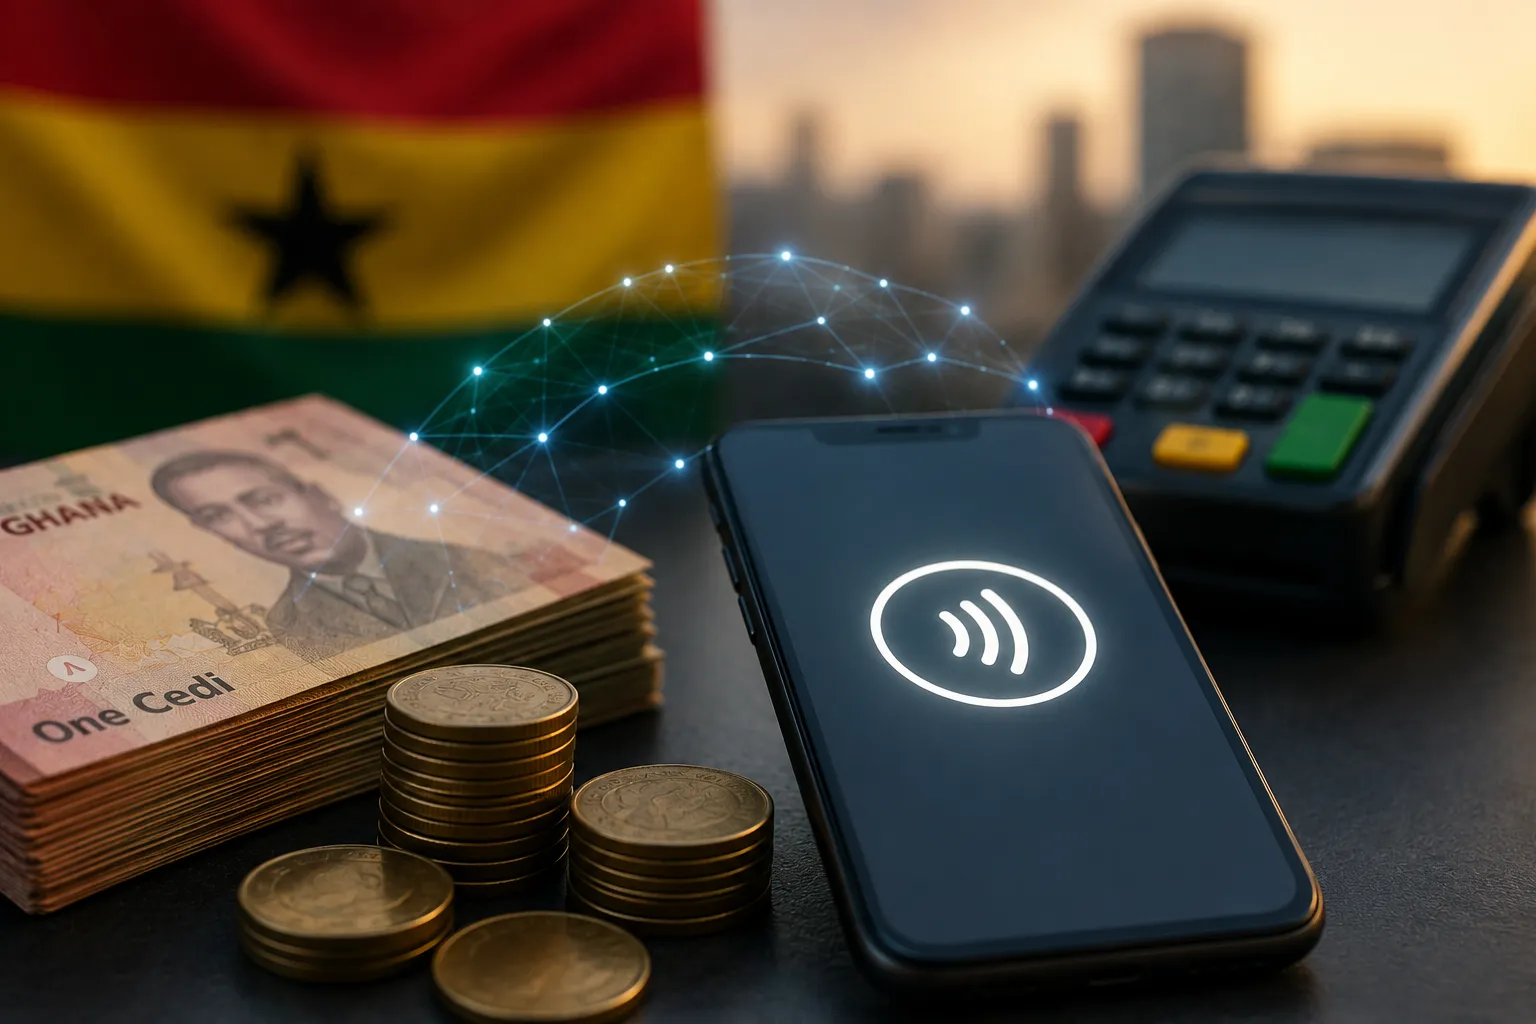
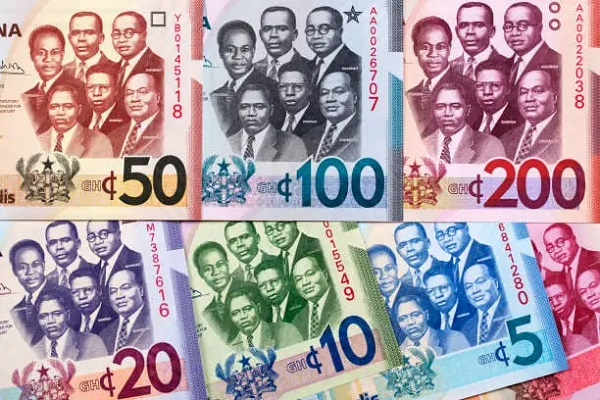
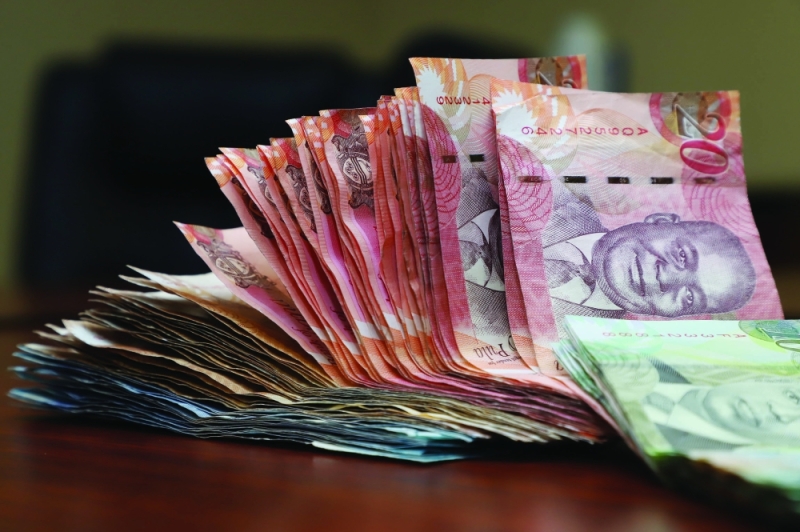
Ghana’s cedi is also forecast to edge lower due to sustained corporate demand for foreign exchange.
|
Rank |
Country |
Exchange Rate per US$1 |
Currency |
|---|
|
1 |
Tunisia |
2.96 |
Tunisian Dinar (TND) |
|
2 |
Libya |
6.41 |
Libyan Dinar (LYD) |
|
3 |
Morocco |
9.38 |
Moroccan Dirham (MAD) |
|
4 |
Ghana |
11.64 |
Ghanaian Cedi (GHS) |
|
5 |
Seychelles |
13.52 |
Seychellois Rupee (SCR) |
|
6 |
Botswana |
13.77 |
Botswanan Pula (BWP) |
|
7 |
Eritrea |
15.00 |
Eritrean Nakfa (ERN) |
|
8 |
South Africa |
16.74 |
South African Rand (ZAR) |
|
9 |
Eswatini |
16.80 |
Swazi Lilangeni (SZL) |
|
10 |
Namibia |
16.80 |
Namibian Dollar (NAD) |