Key Takeaways
- Even if the Middle East conflict ends soon and the Strait of Hormuz is reopened, we believe high oil and overseas LNG prices will persist for at least a few months until confidence is restored and the resuscitation of Gulf energy production is well underway.
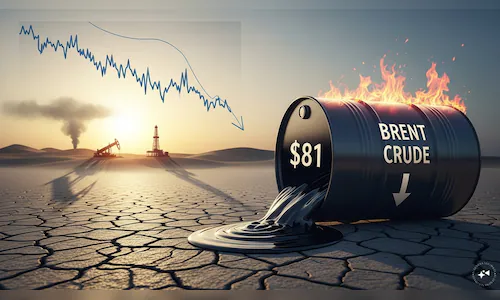
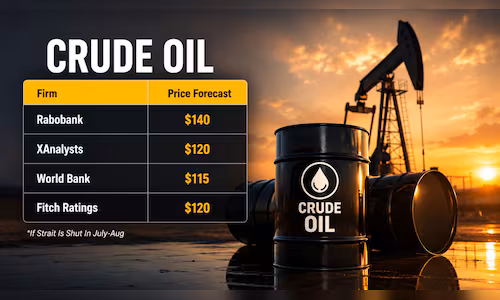
- Morningstar DBR is increasing our full-year 2026 Brent and WTI crude oil price forecasts to $80/bbl and $75/bbl, respectively, to reflect the ongoing acute global oil supply shortage.
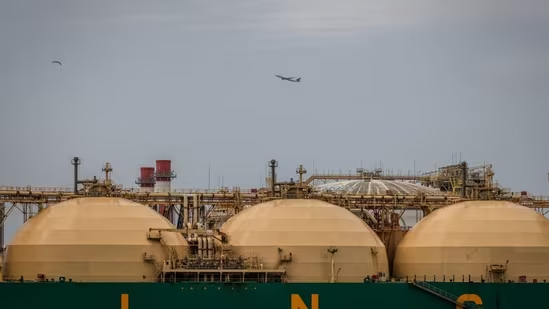
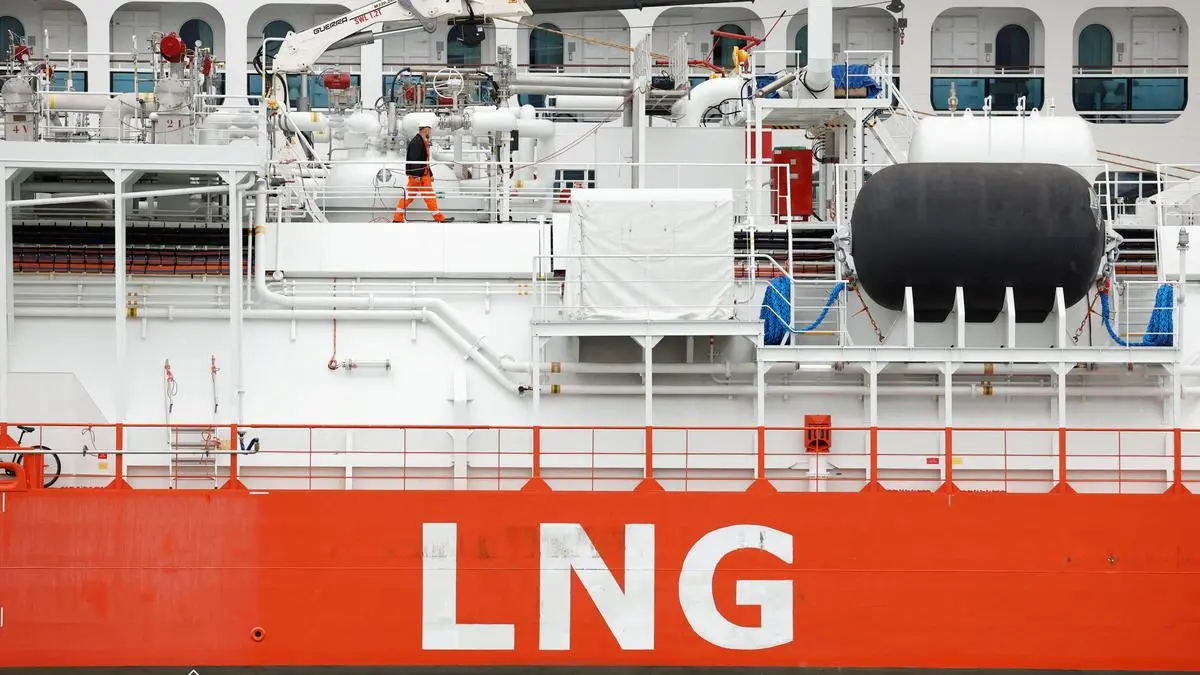
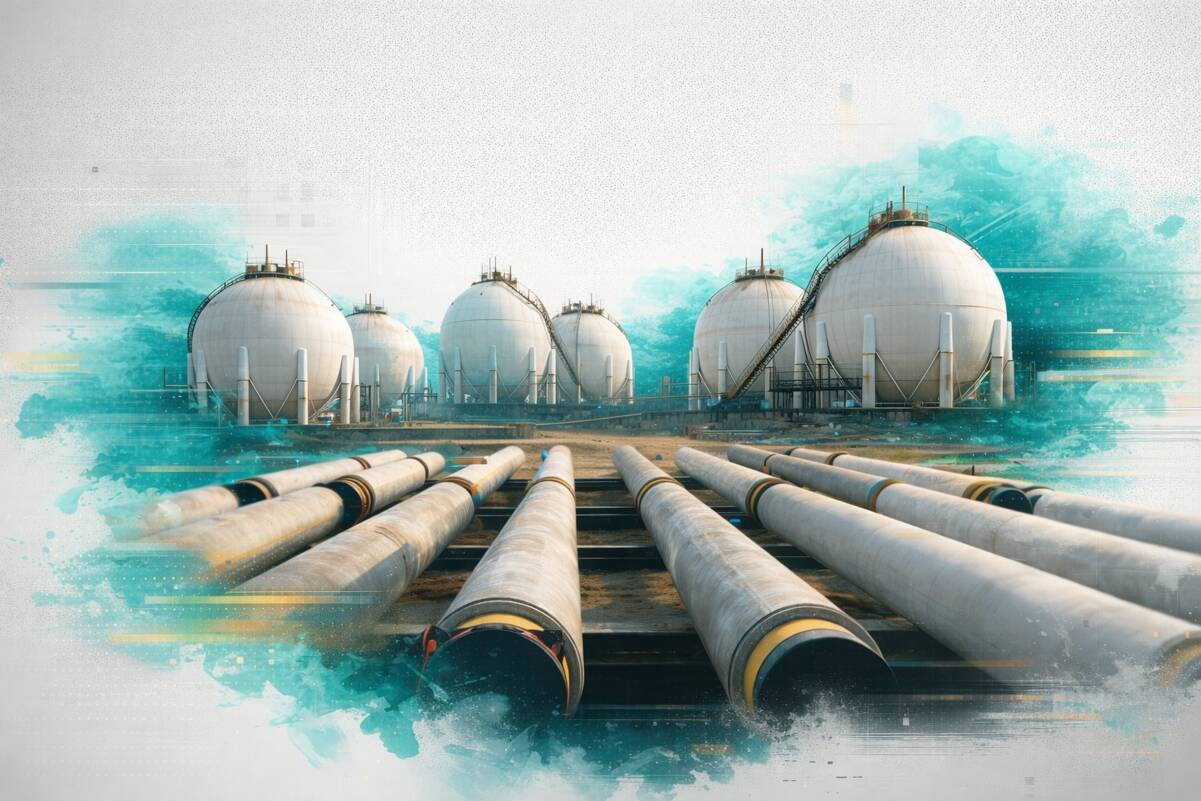
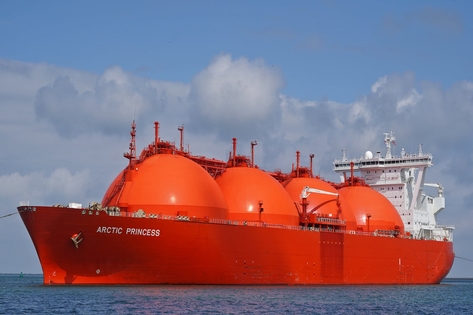
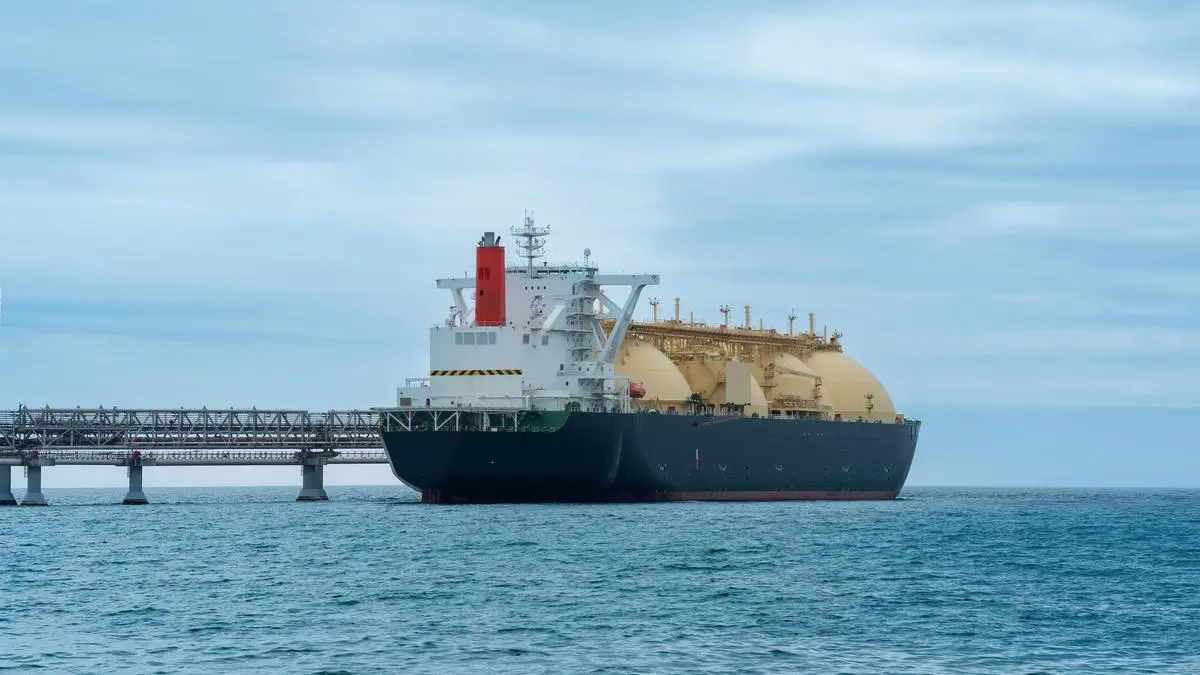
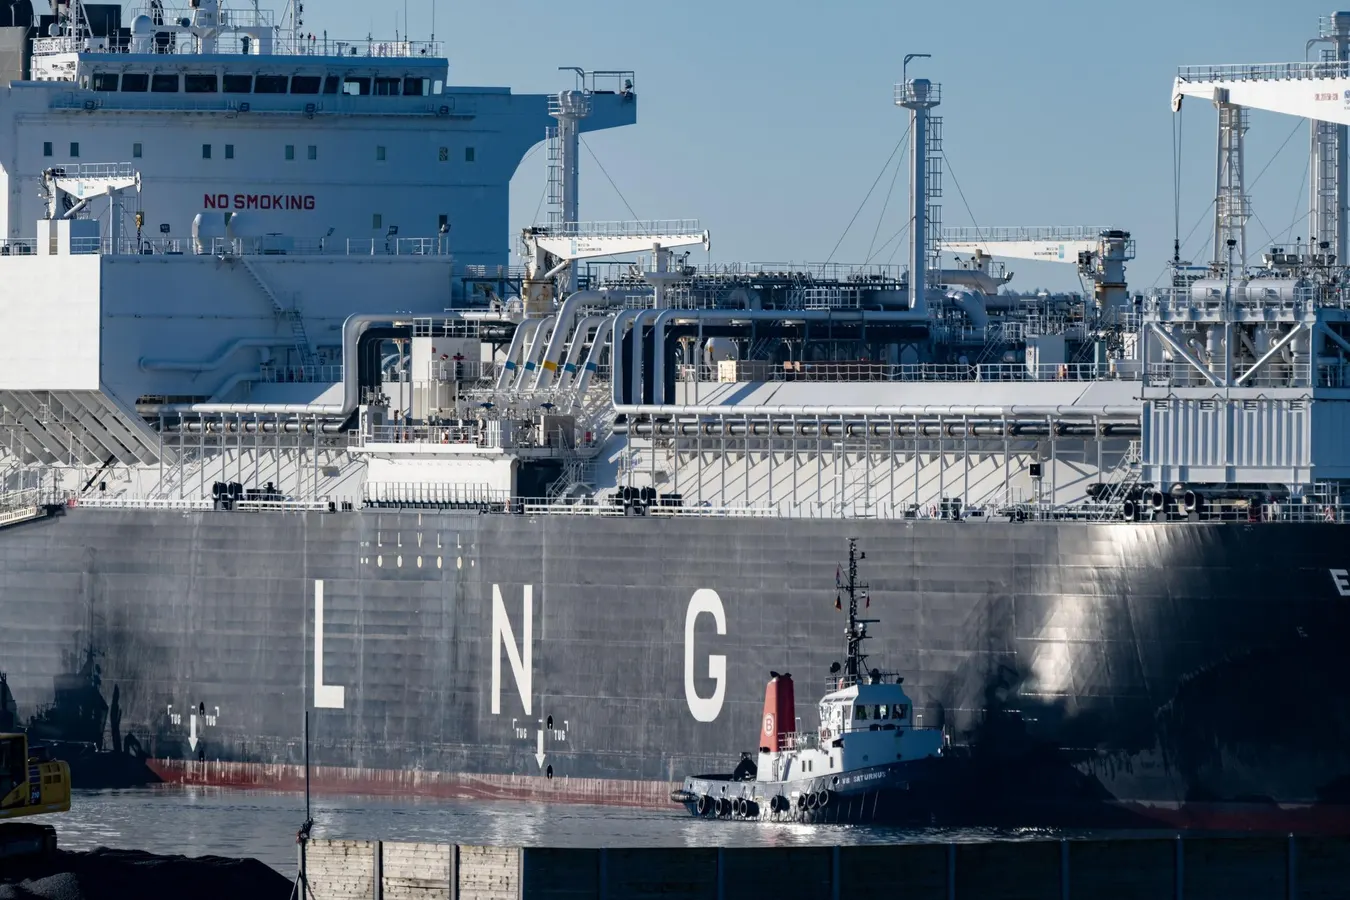
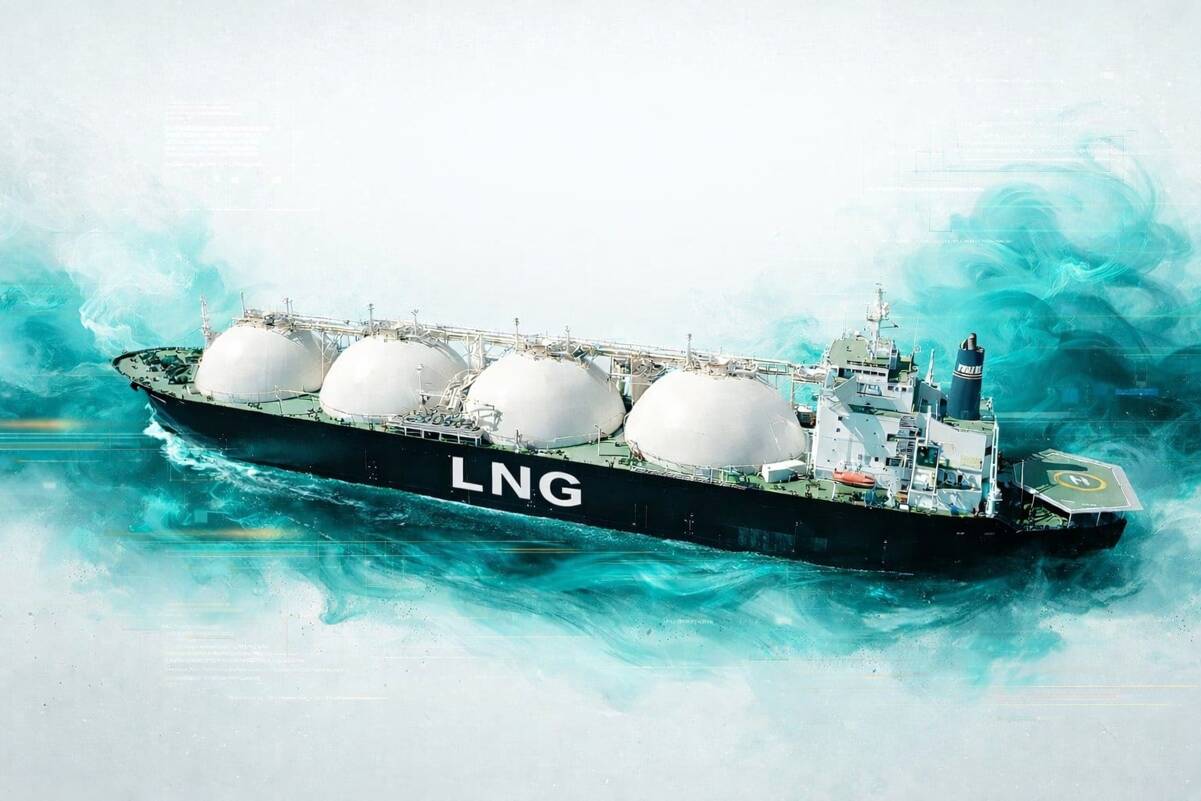
- There is no change to the Morningstar DBRS NYMEX gas price forecast of $3.50/mcf in 2026. US LNG export capacity is nearly fully utilized, preventing US producers from responding to much higher overseas prices.
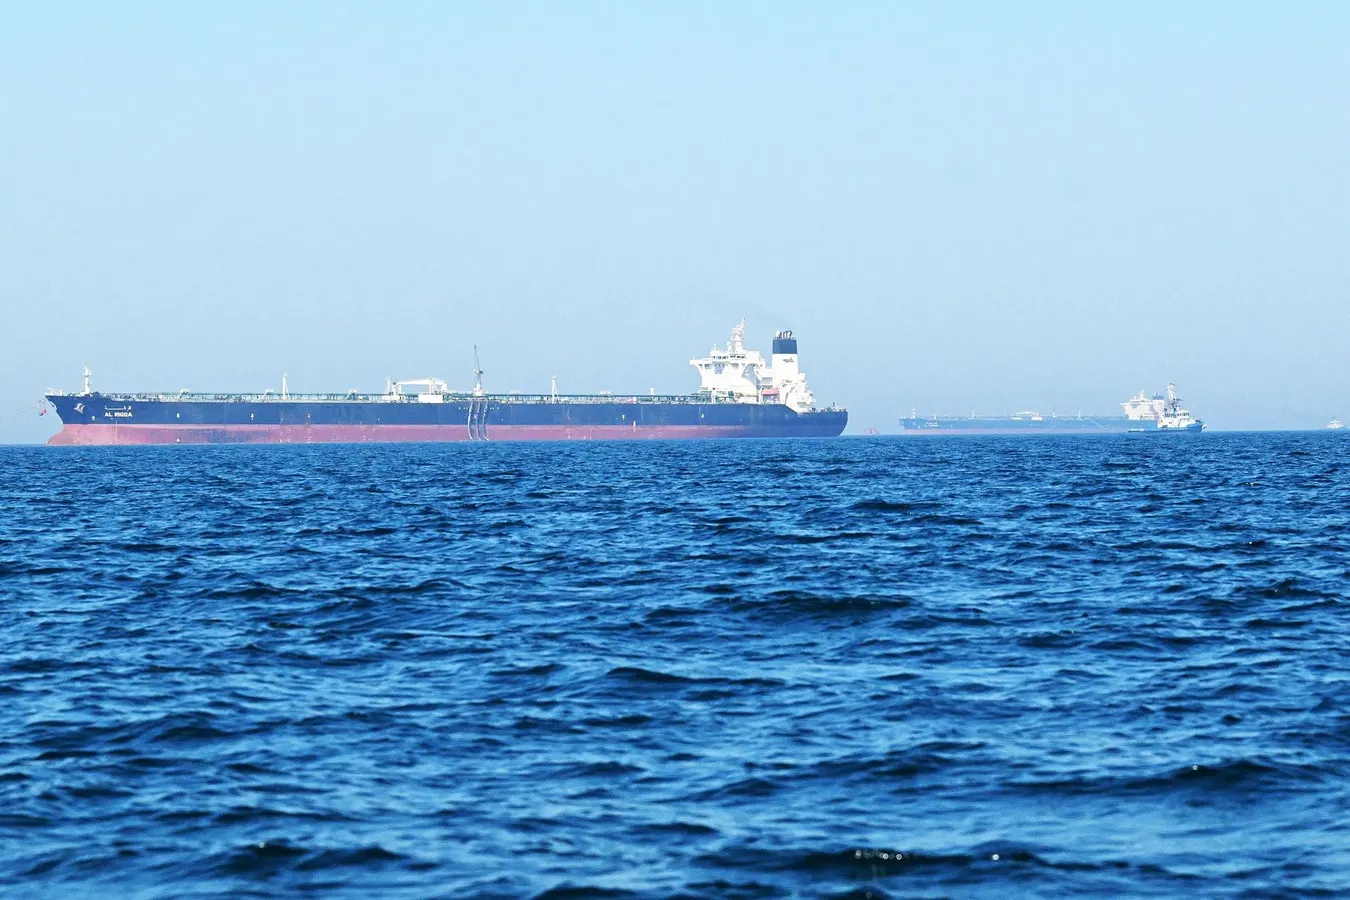
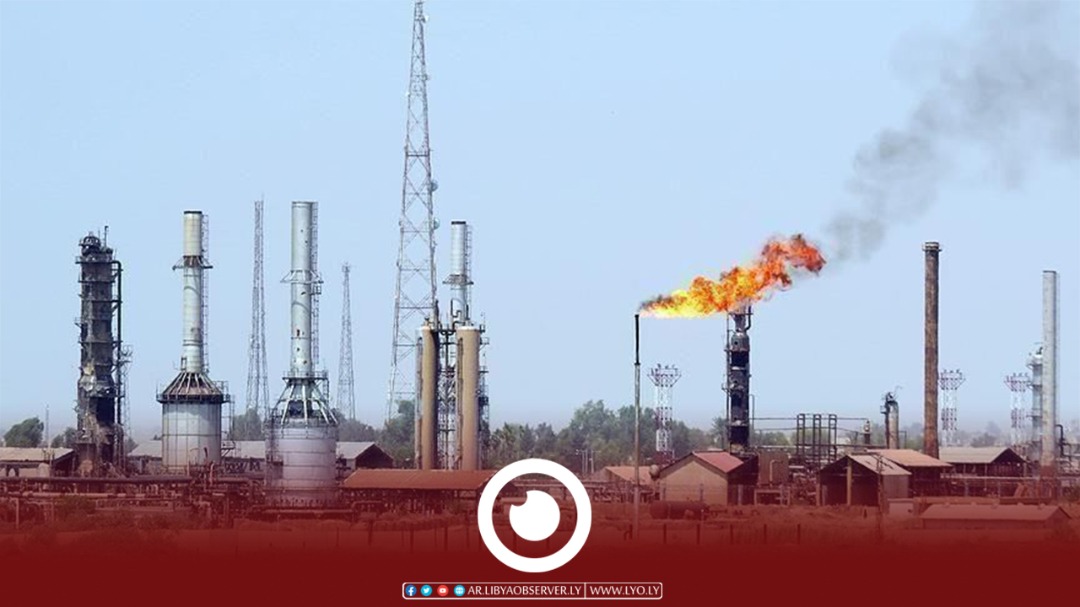
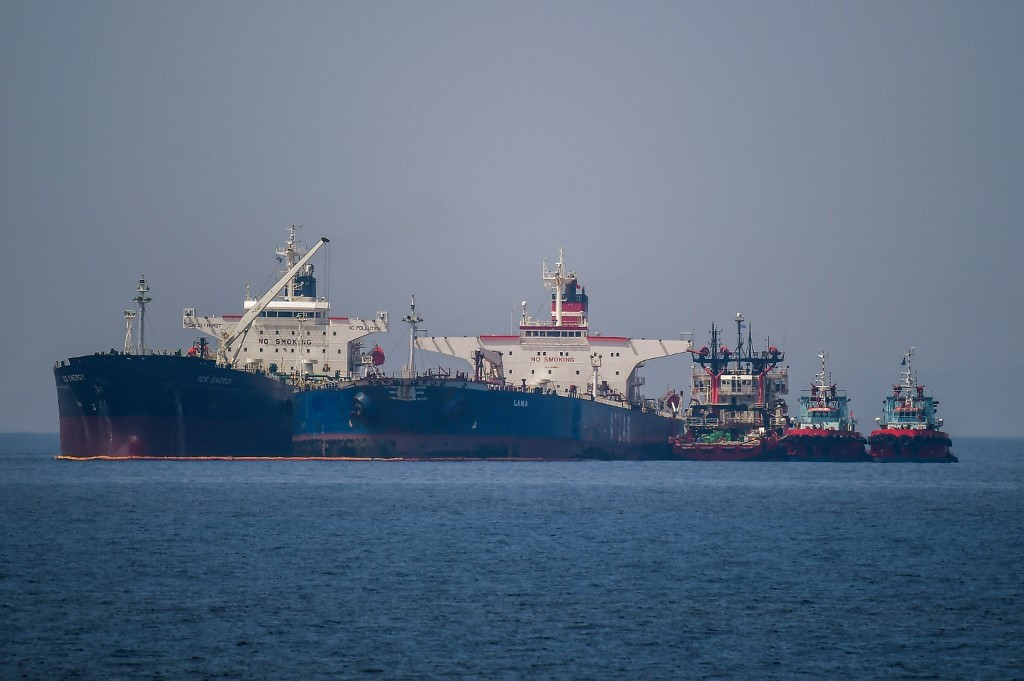
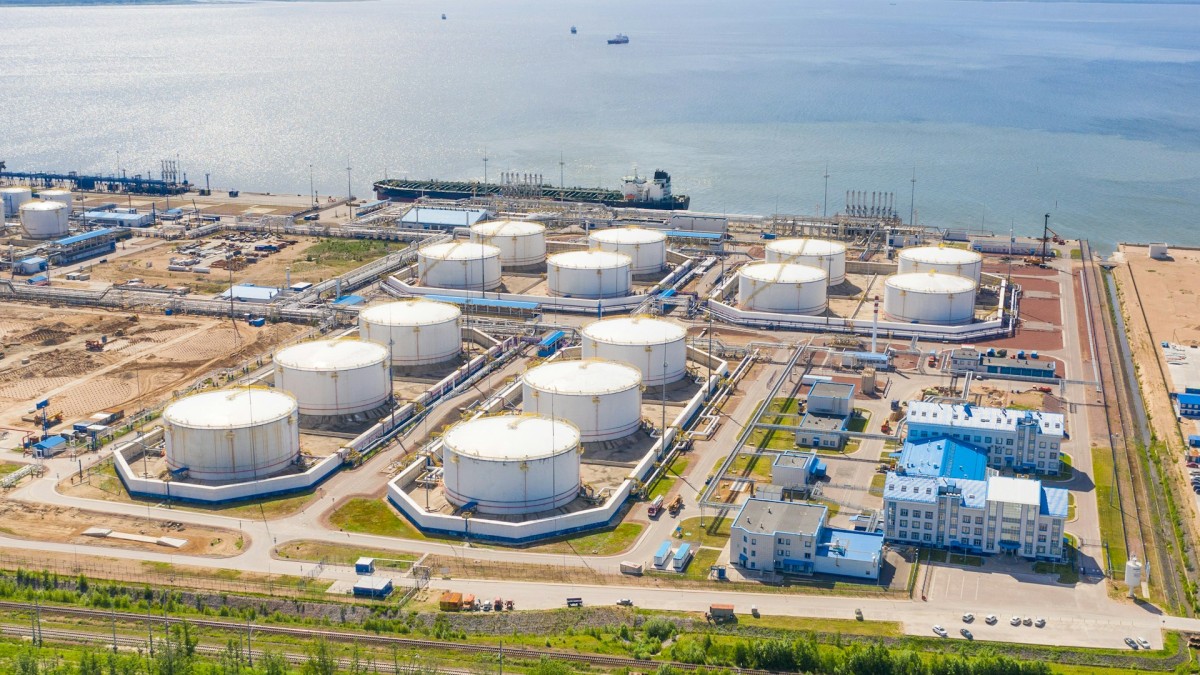
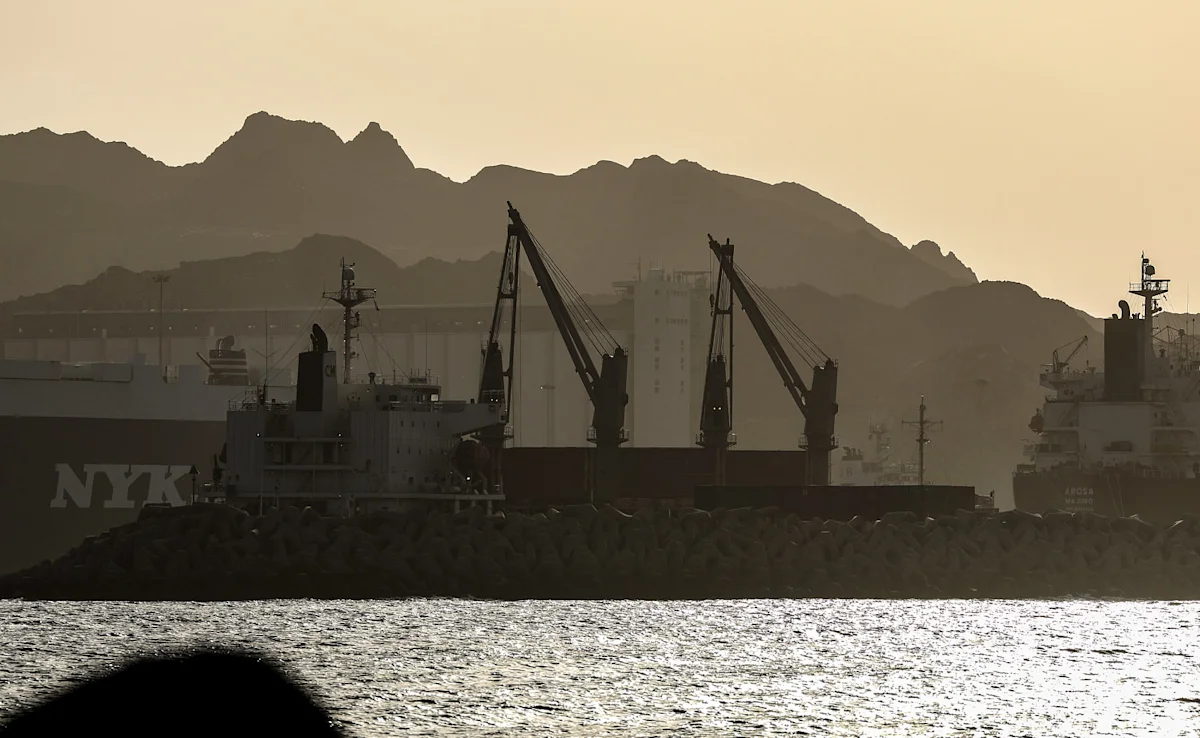
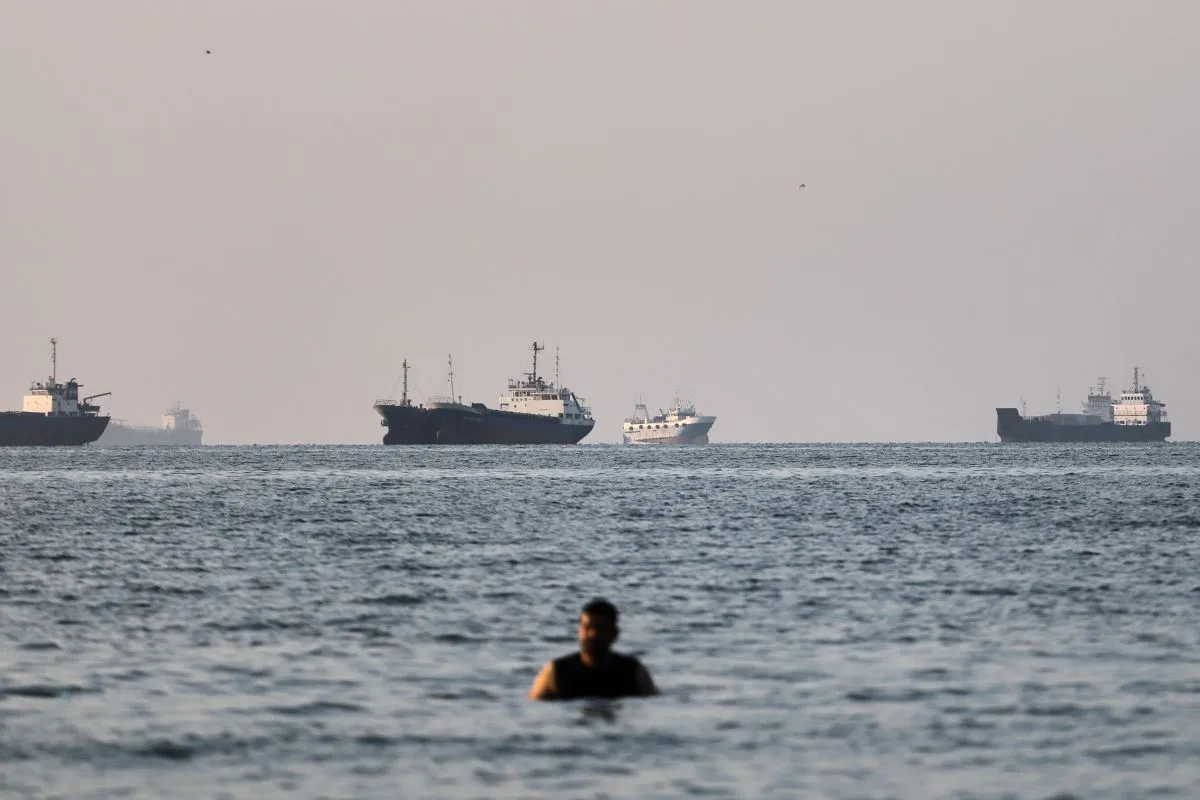
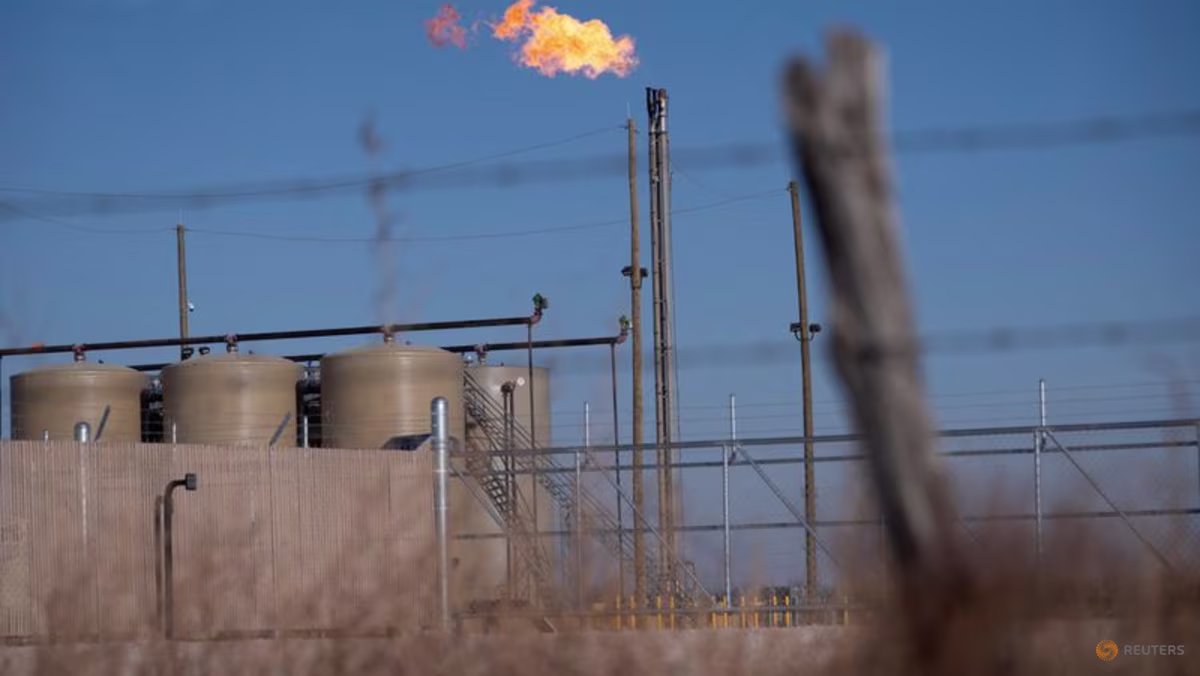
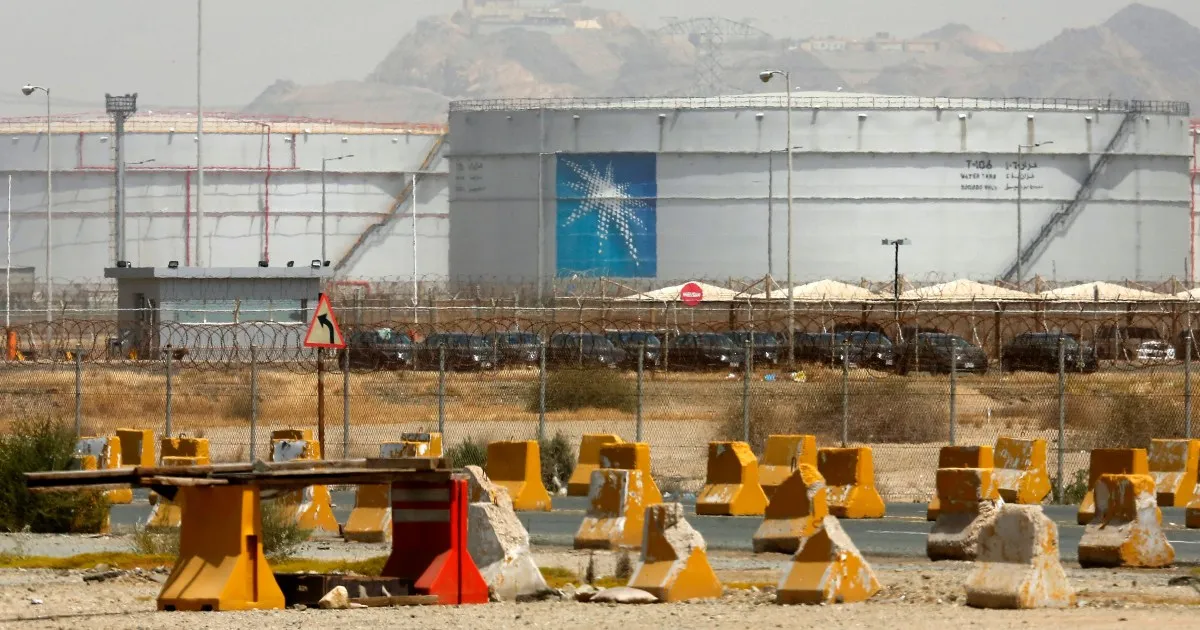
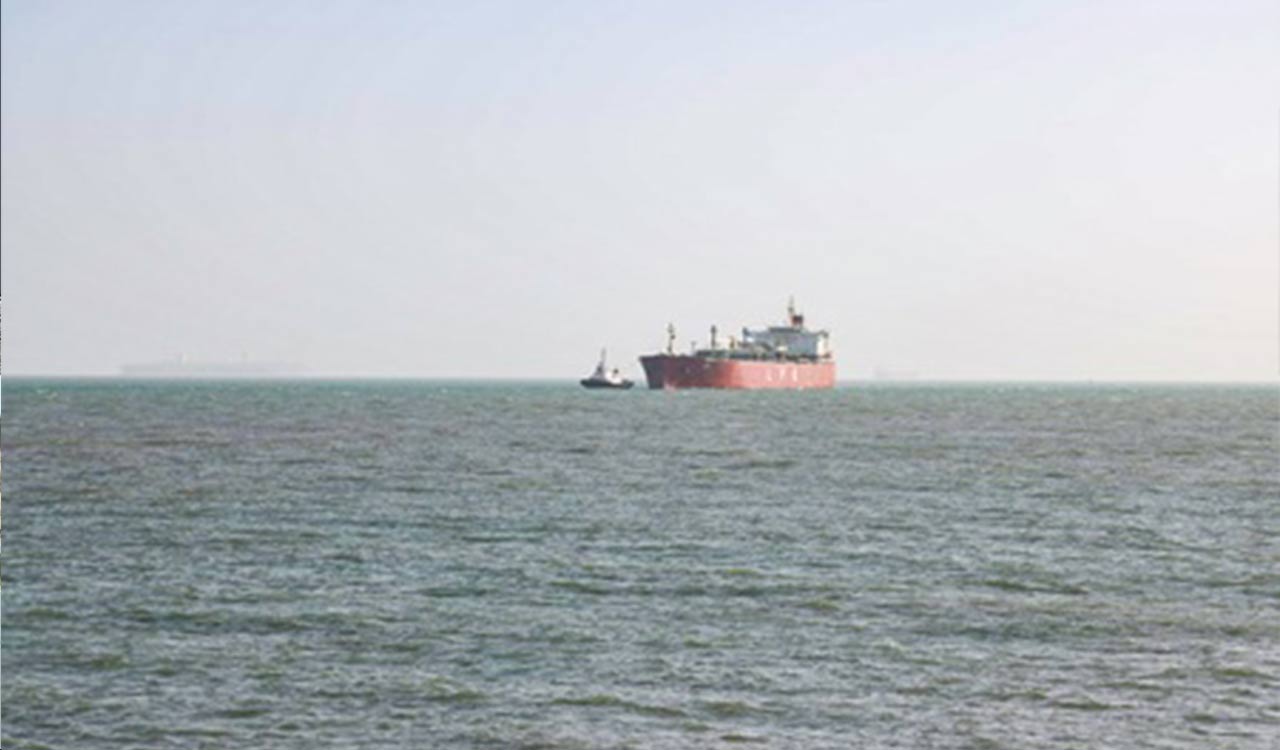
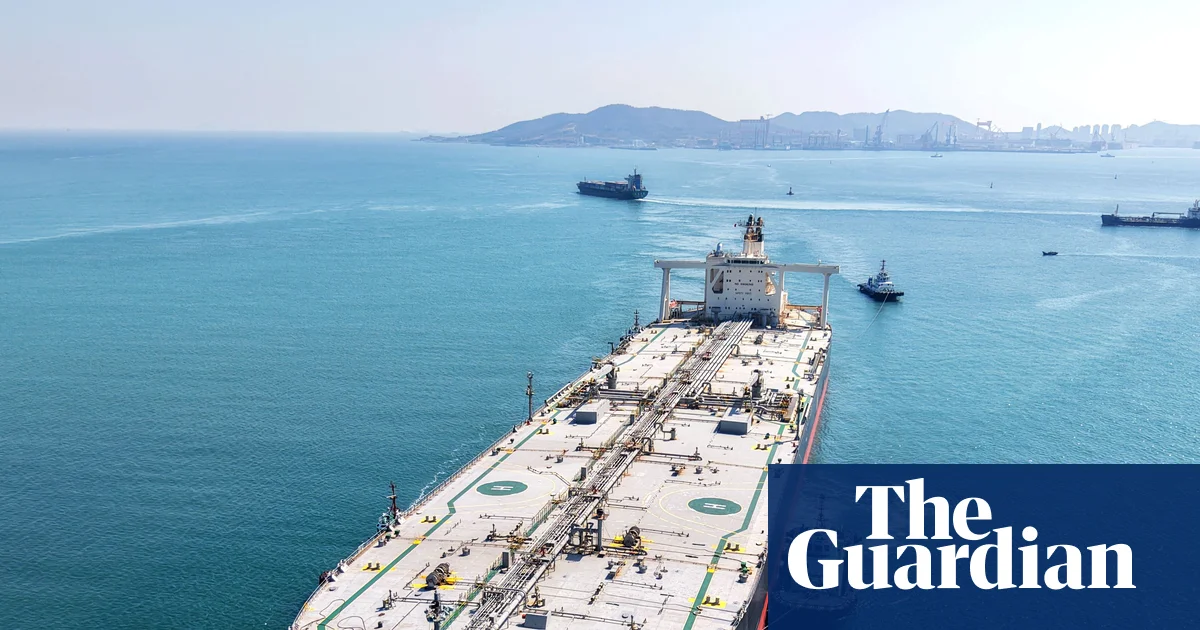
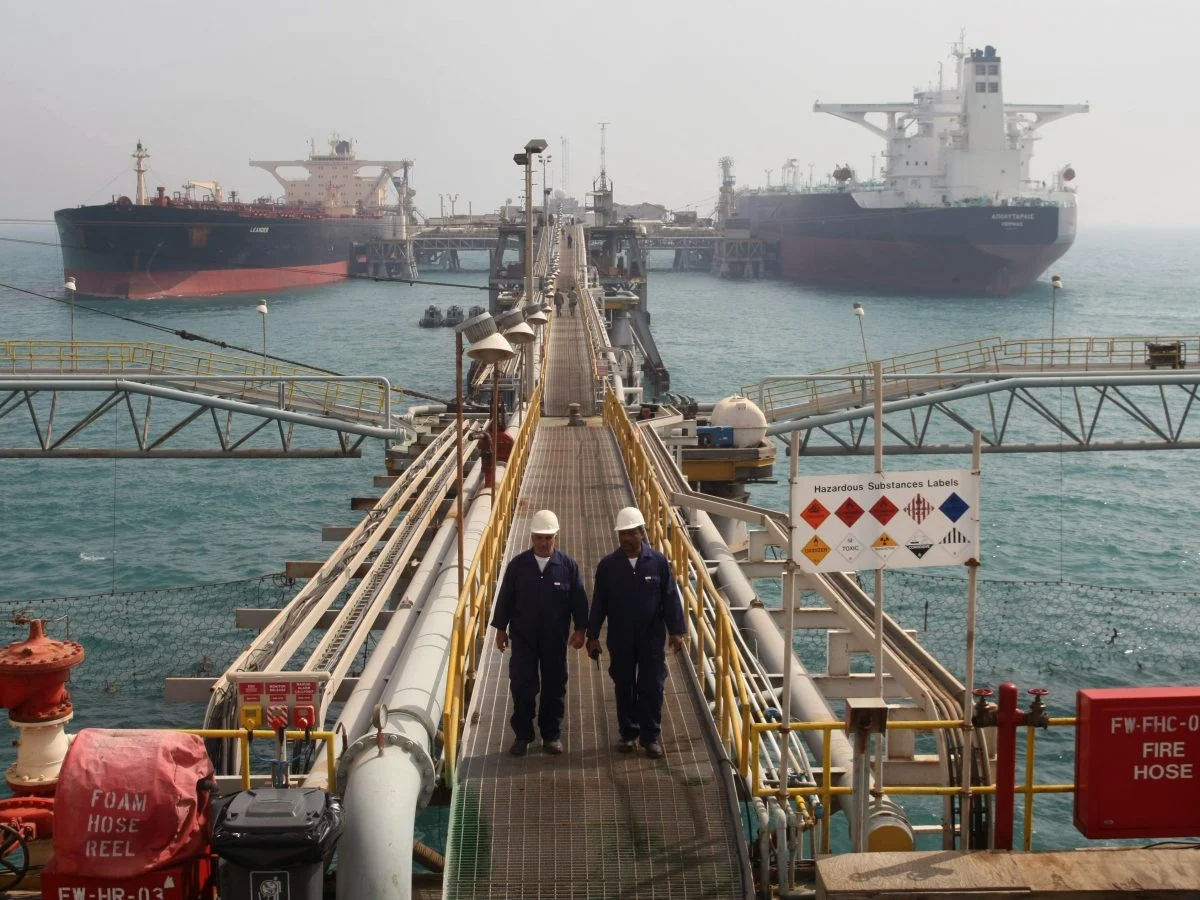
The ongoing Middle East conflict and effective closure of the Strait of Hormuz have badly constrained crude oil exports from the Persian Gulf, resulting in a sharp drawdown of global crude oil inventories and a spike in prices.
Even if the conflict ends soon and the Strait is reopened, we believe high oil and overseas liquified natural gas prices will persist for at least a few months until confidence in the security of the Strait is restored and the resuscitation of Gulf energy production is well underway. Depleted private and government strategic oil reserves have left the market with little room for error in the near term.
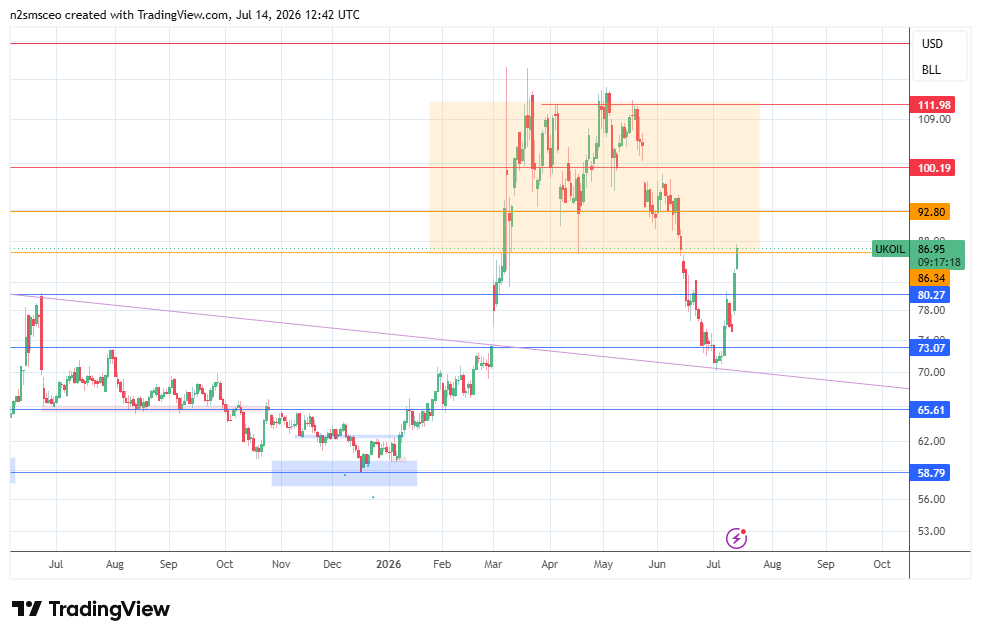
Assuming the conflict ends in June, we forecast that the global crude oil shortage will peak in the second quarter of 2026, then ease through the year-end. After an adequate crude supply has been reestablished, the eventual replenishment of government inventories by countries wary of future disruptions could continue to support higher prices. After hitting $115 per barrel in April, the spot West Texas Intermediate oil price is hovering around $100/bbl.
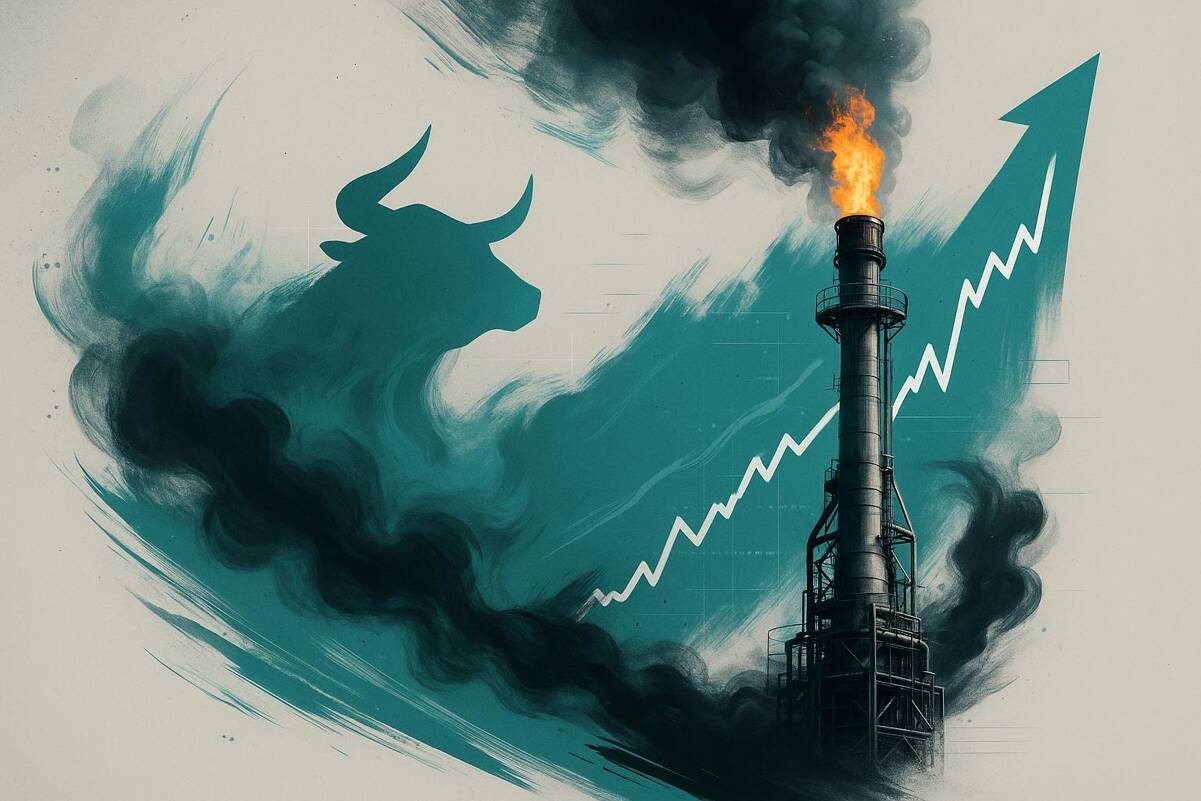
From Excess Oil Supply to Shortages
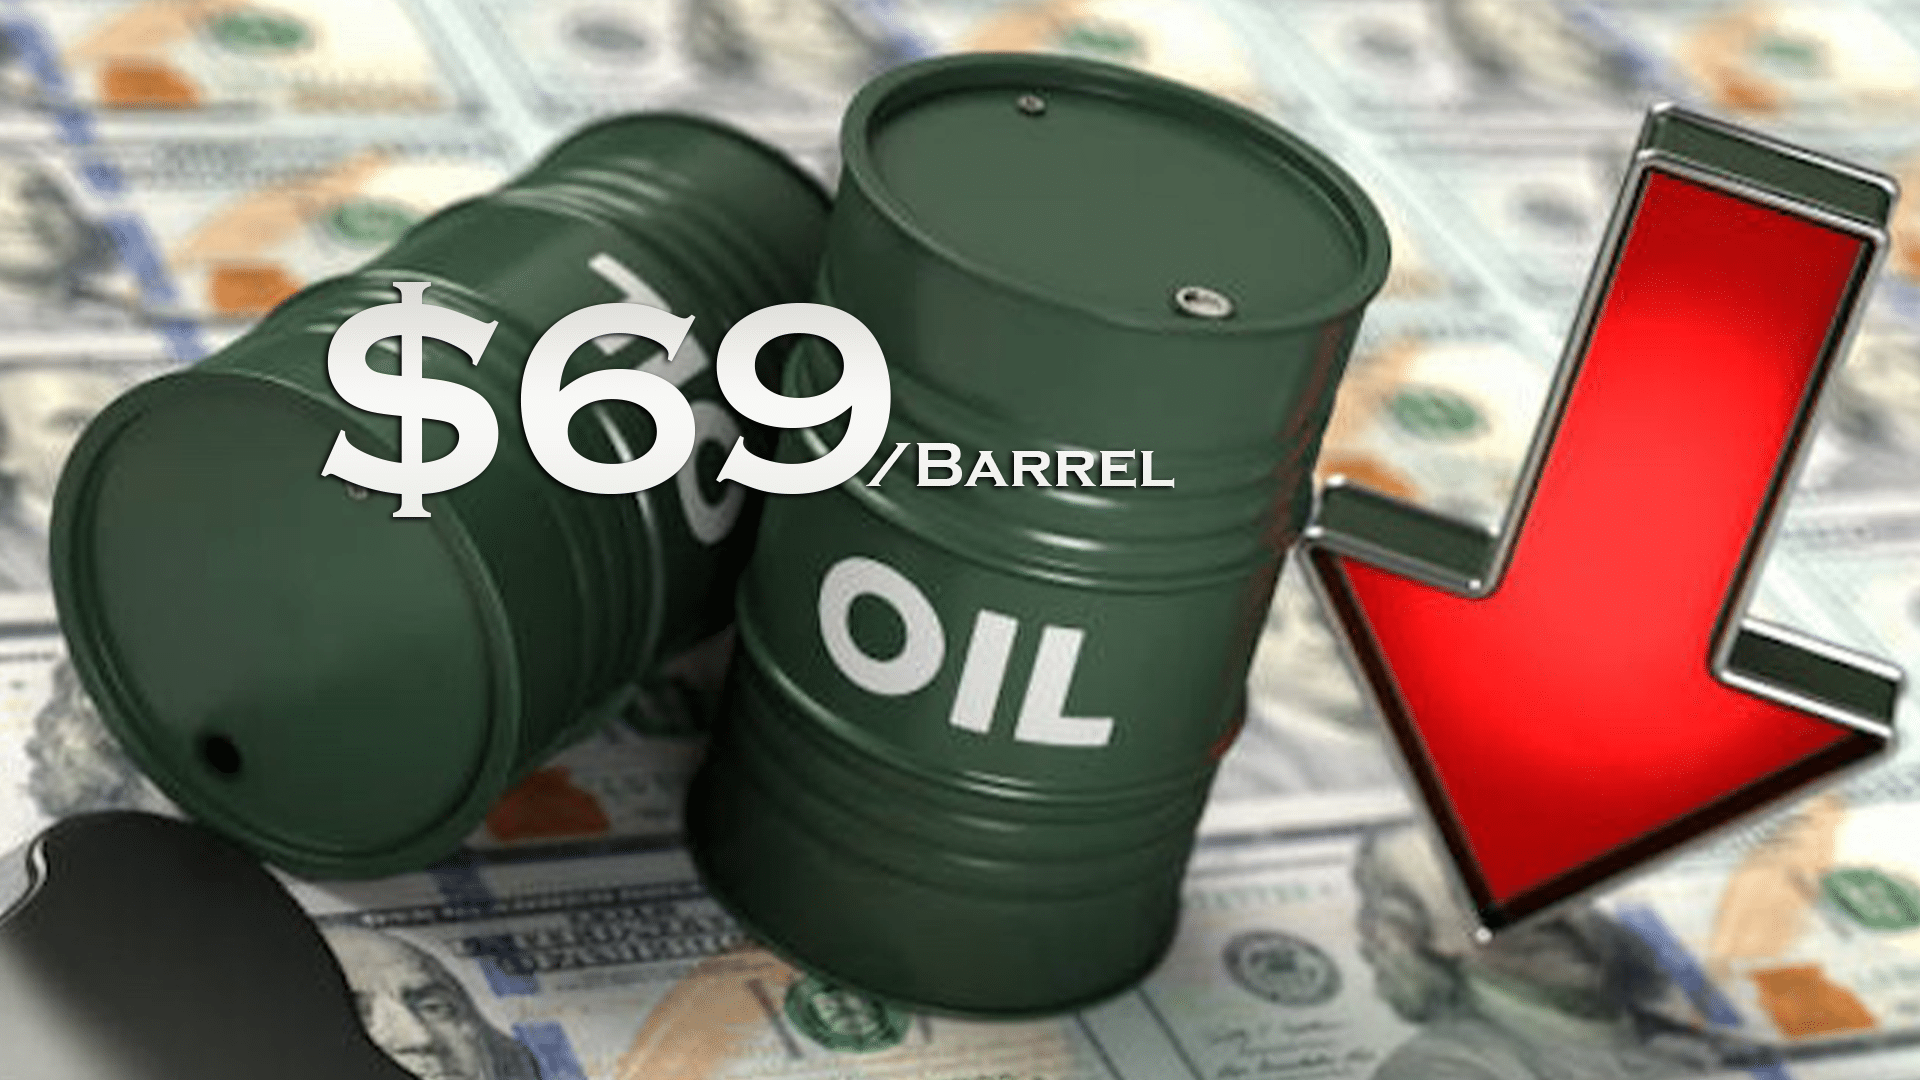
In 2025, both Brent- and WTI-basis crude oil prices declined as global supply exceeded demand, with WTI bottoming out at $55/bbl in mid-December. However, after US threats against Iran in early 2026, crude oil prices began to creep higher in anticipation of a military intervention.
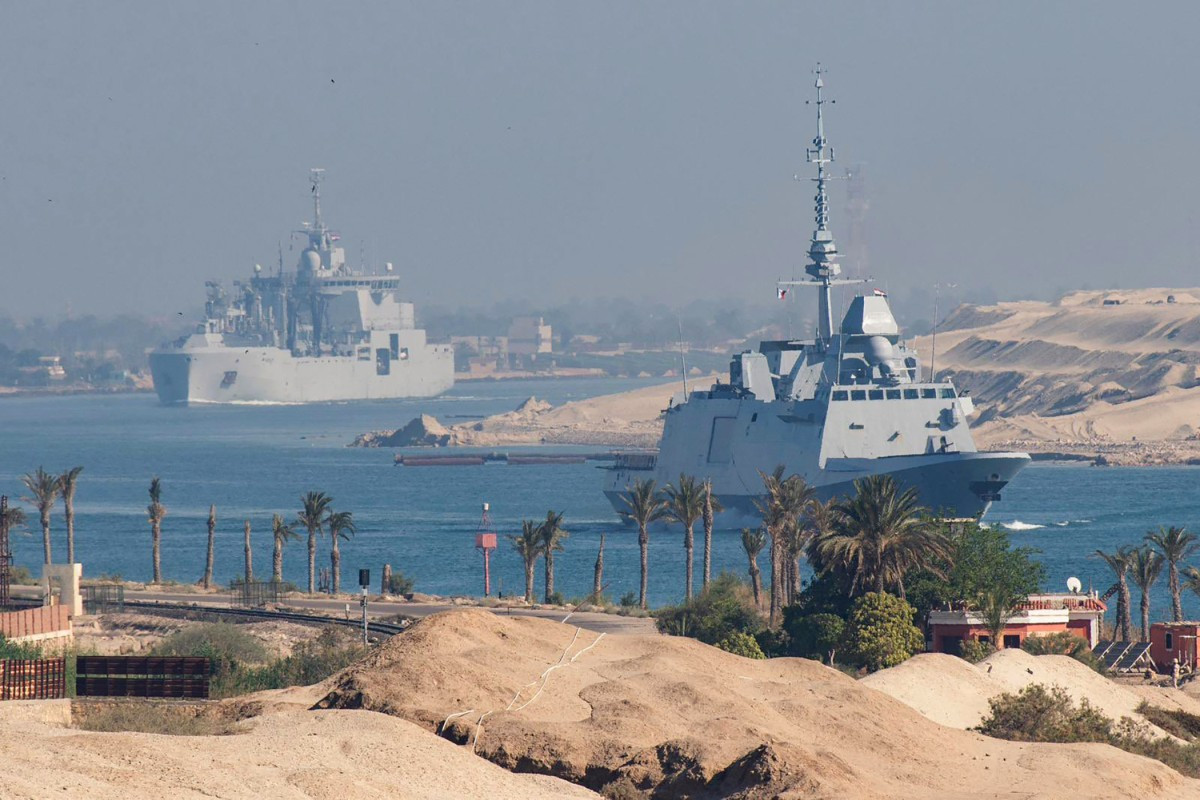
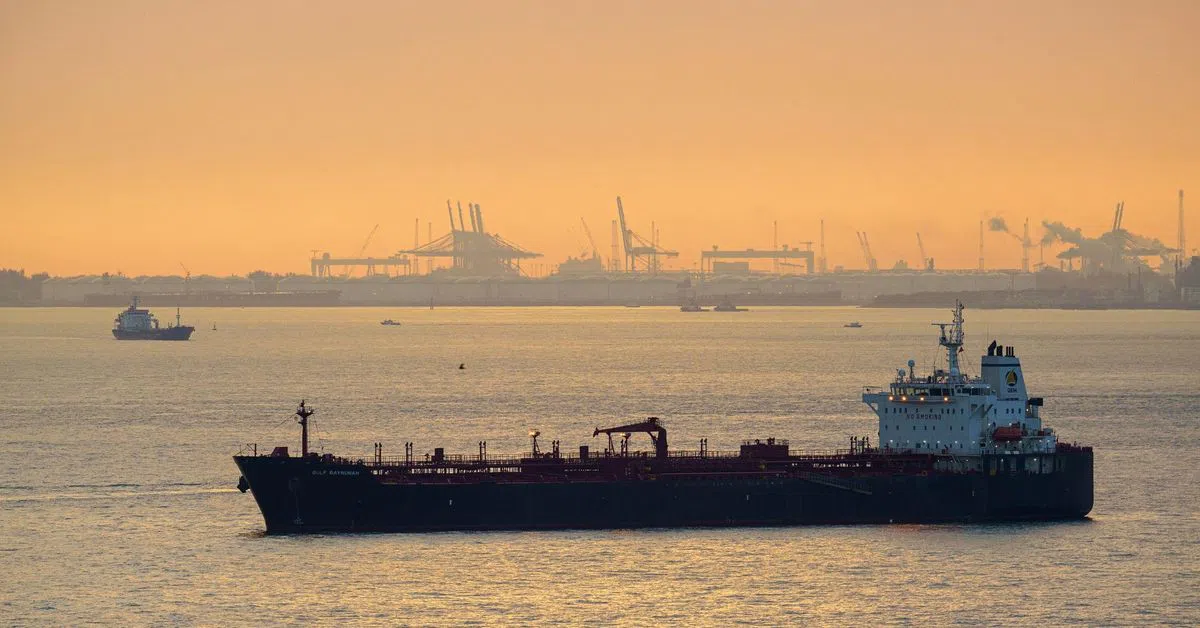
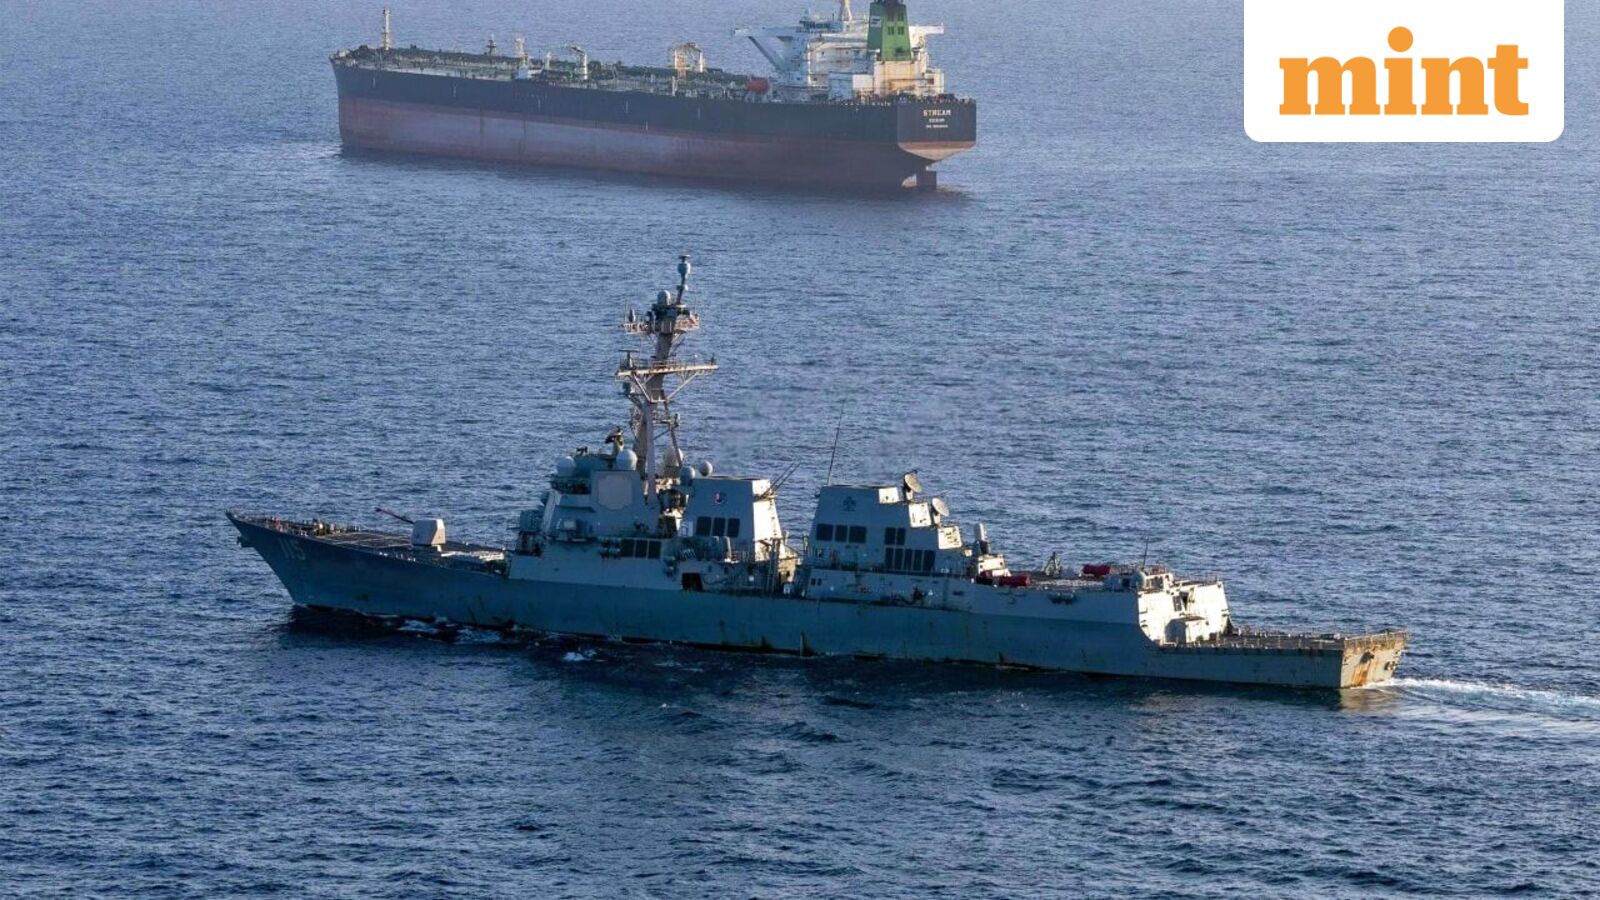
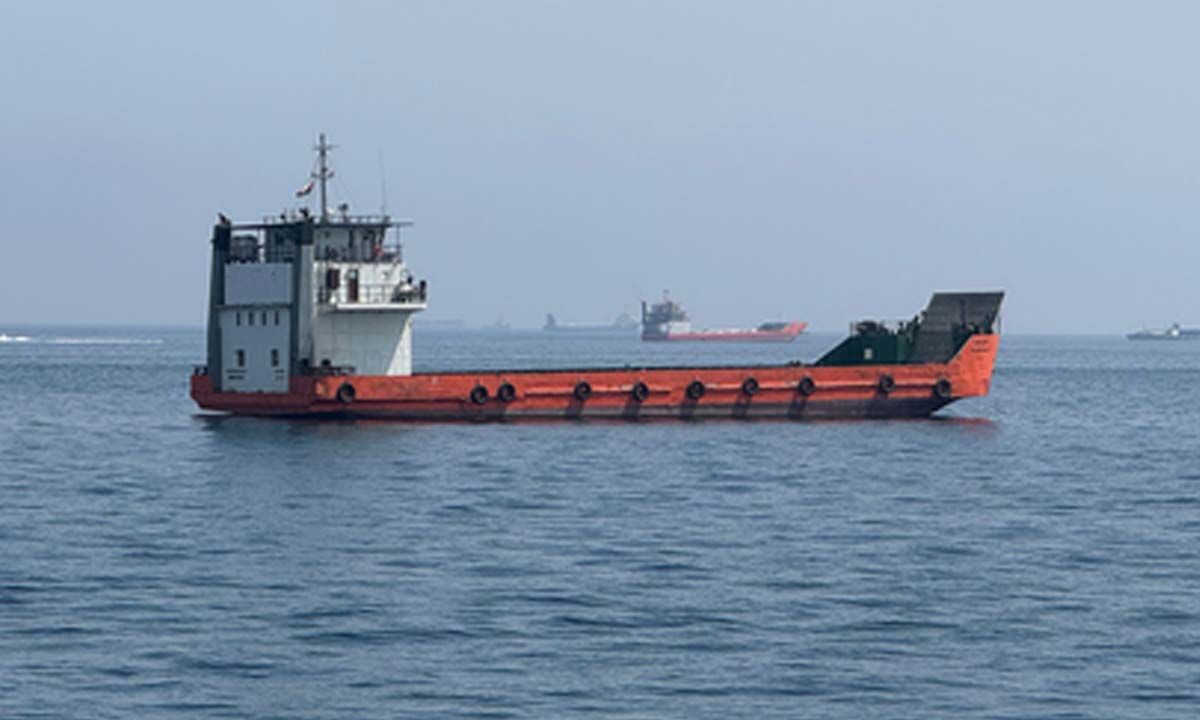
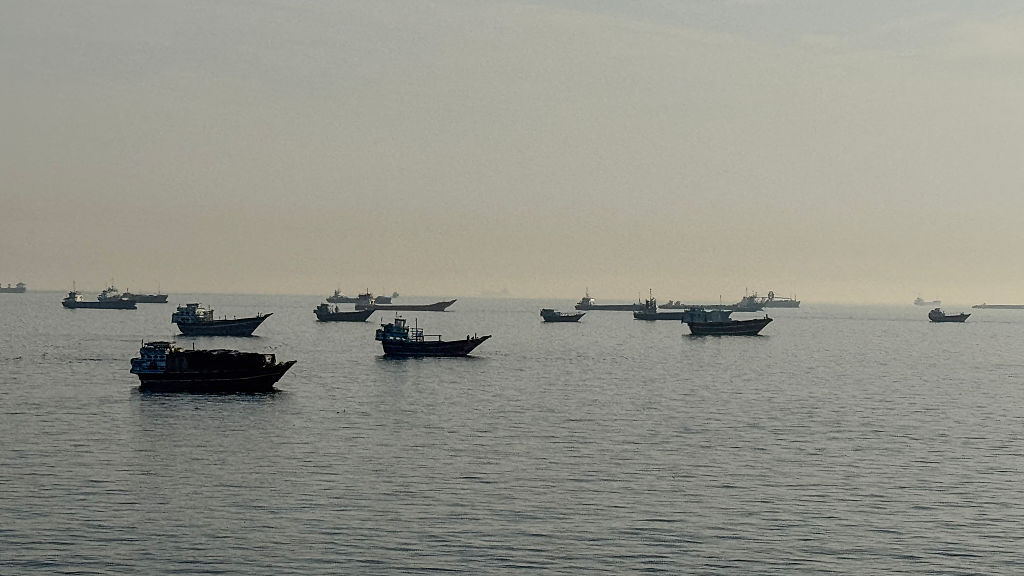
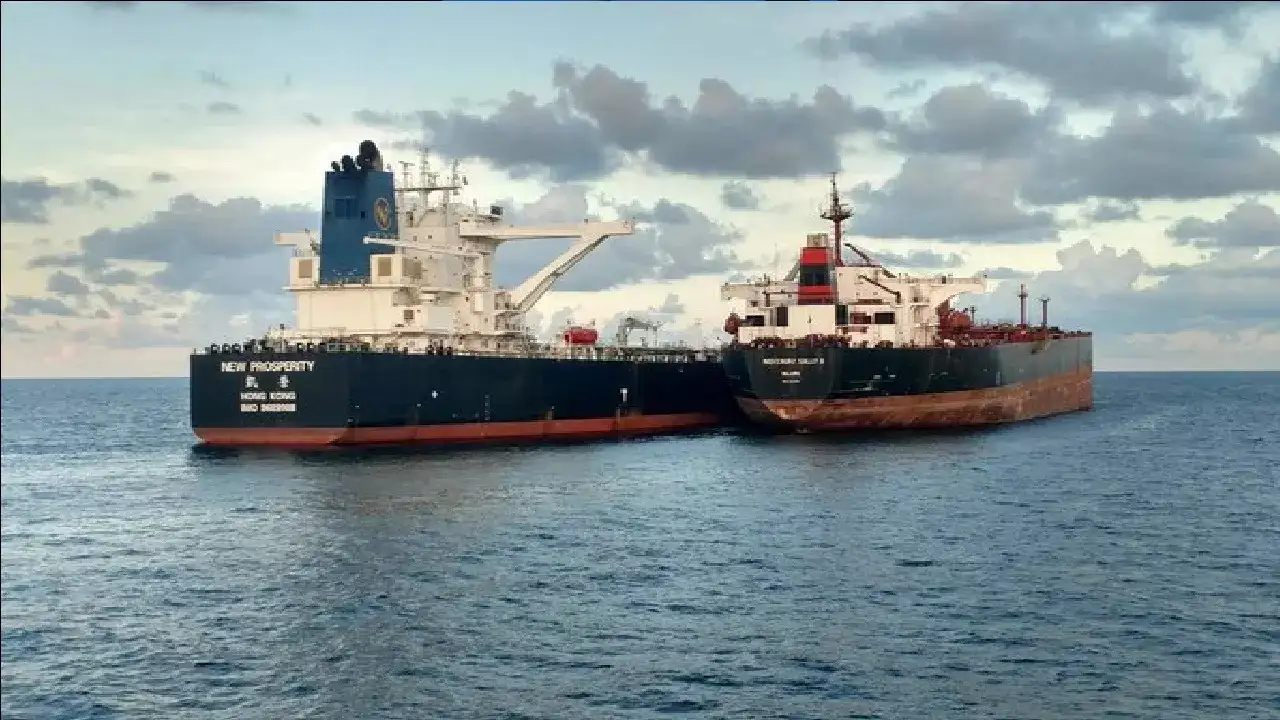
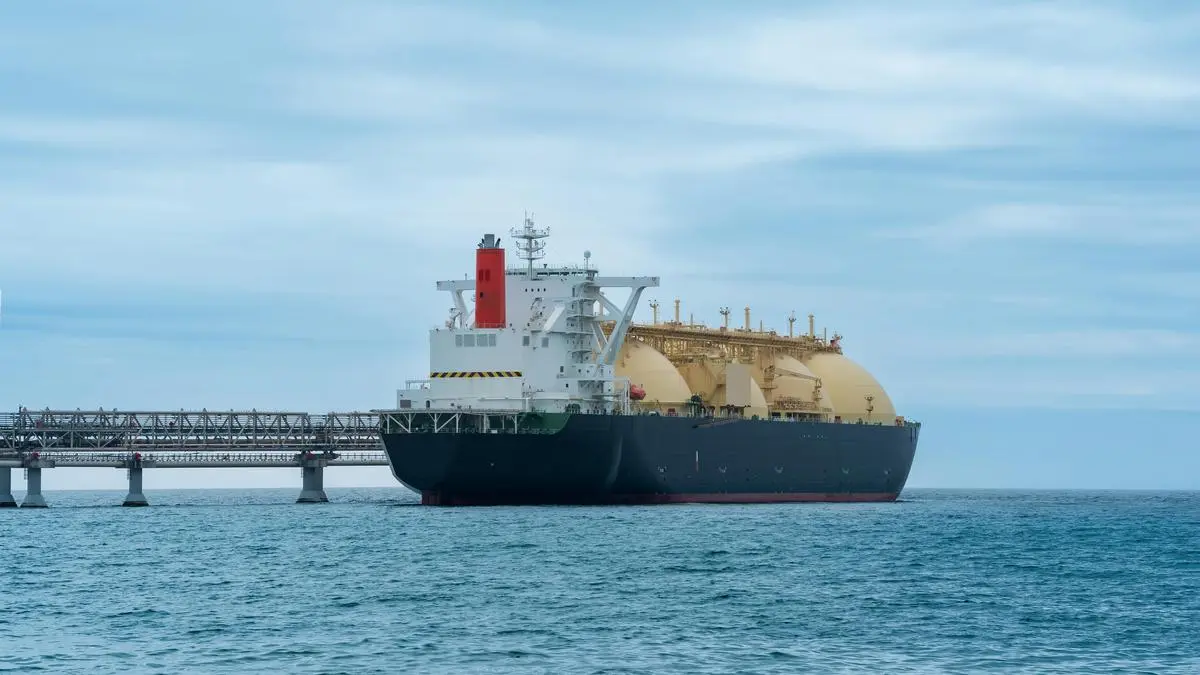
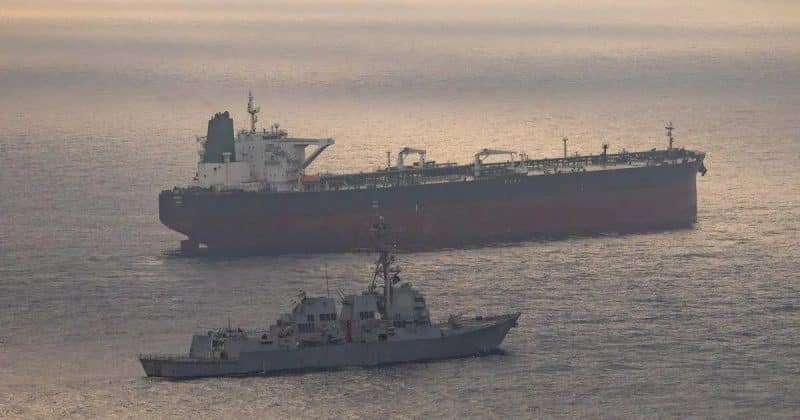
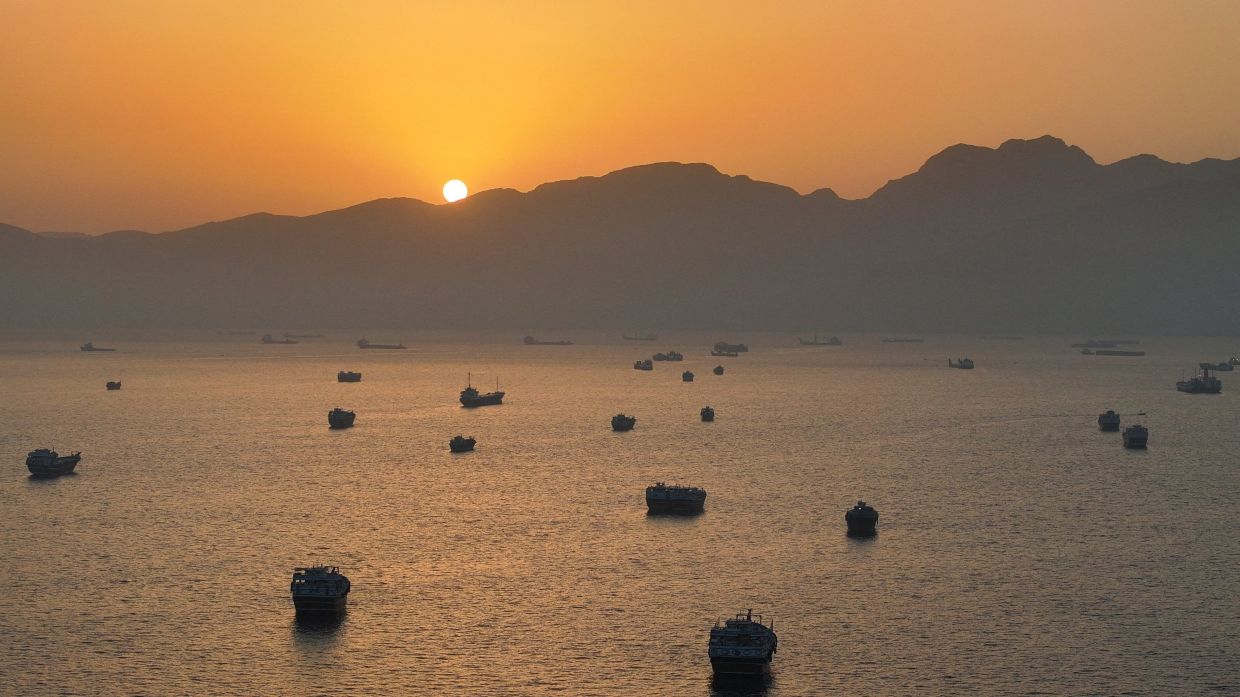
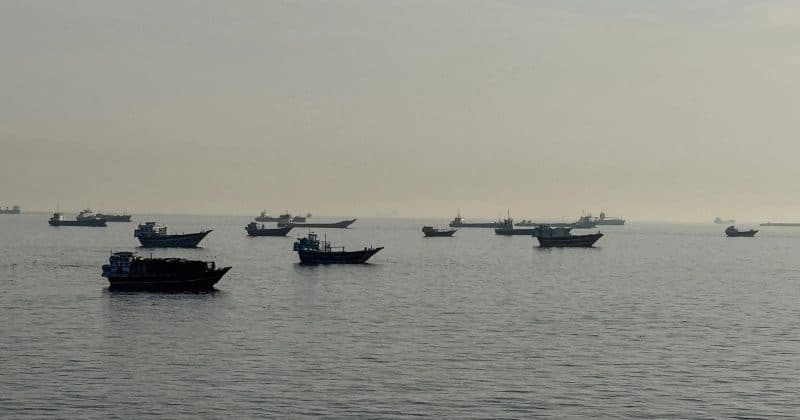
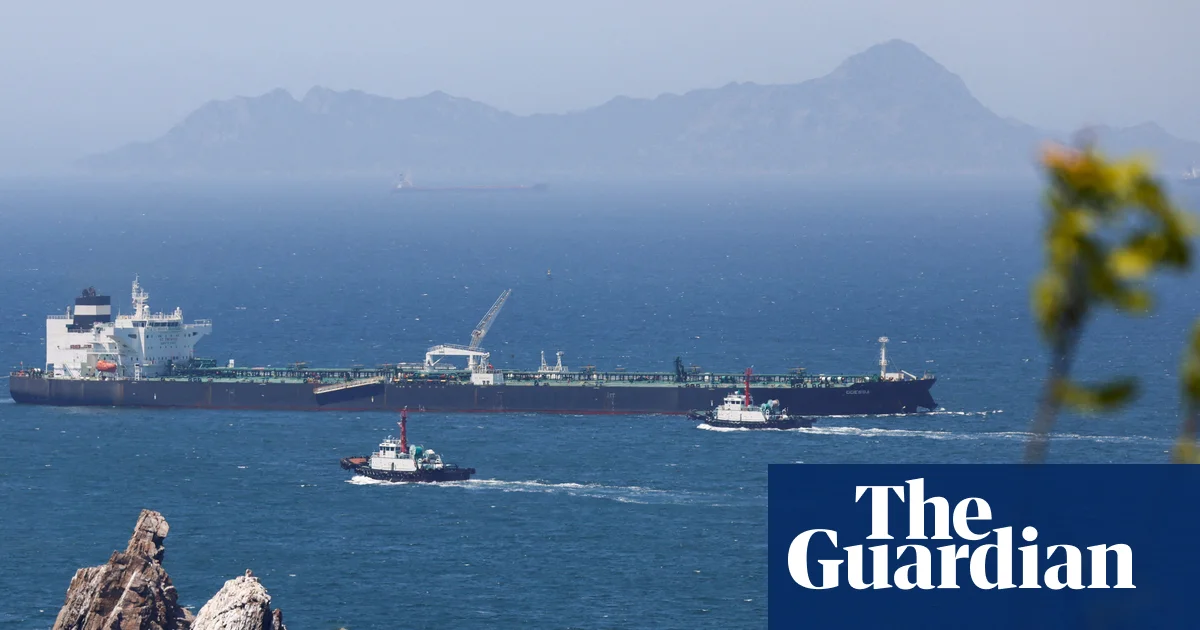
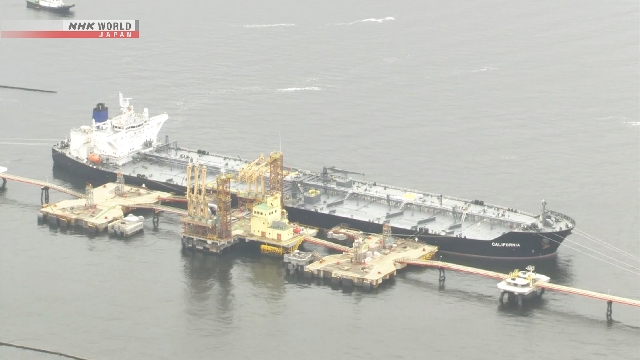
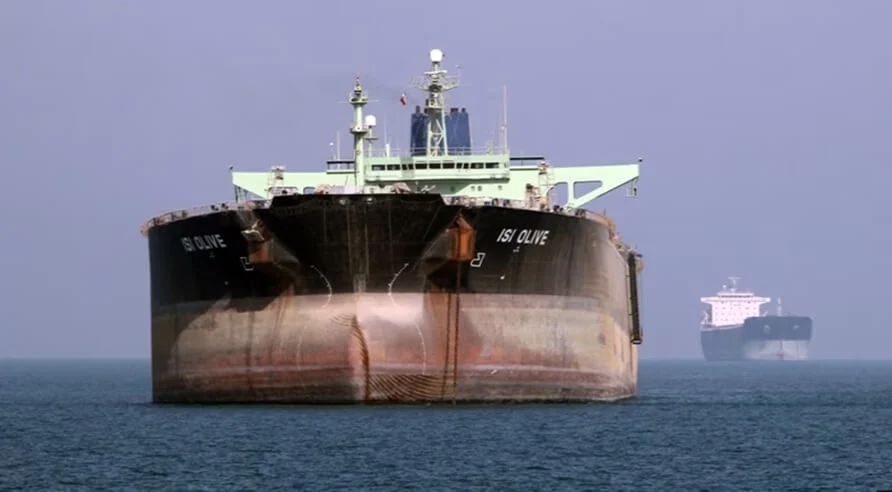
Since the war between the United States, Israel, and Iran broke out on Feb. 28, the Strait of Hormuz has been effectively closed, choking off exports of crude oil and LNG from the Persian Gulf. Crude oil prices have surged to four-year highs, with WTI hitting $115/bbl on April 7 and now hovering around $100/bbl. The shutdown of the Strait is unprecedented. During the 1980s Tanker War, oil shipments continued despite a series of attacks from Iran and Iraq against merchant vessels in the Gulf and Strait.
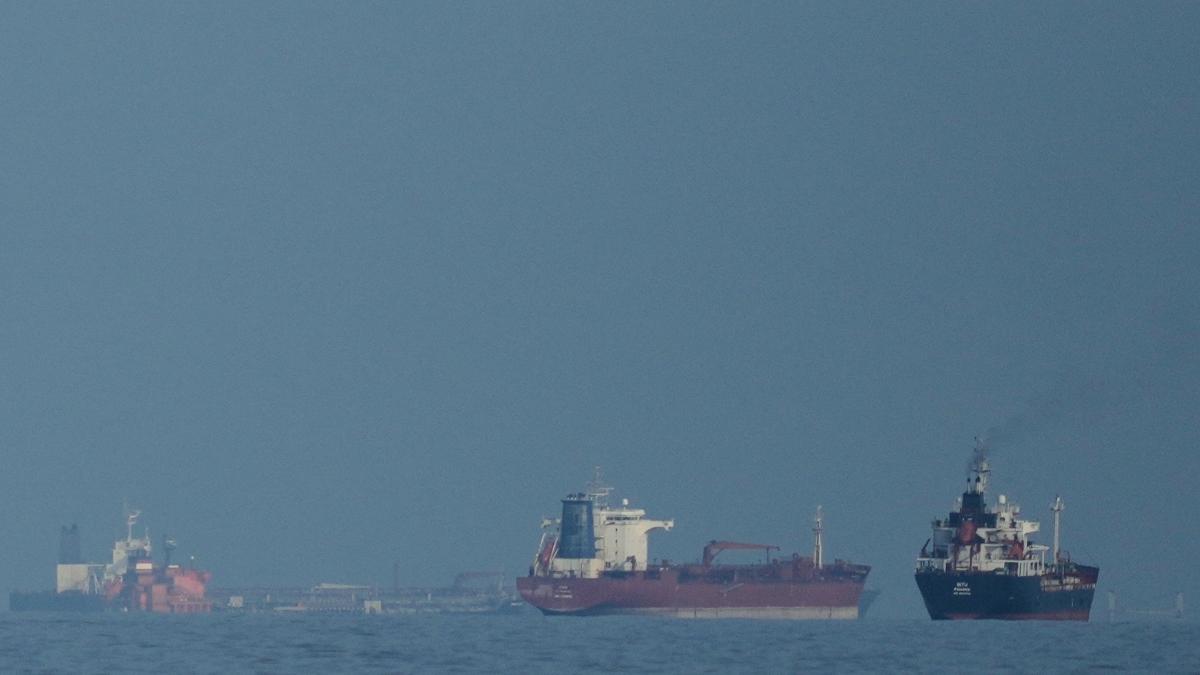
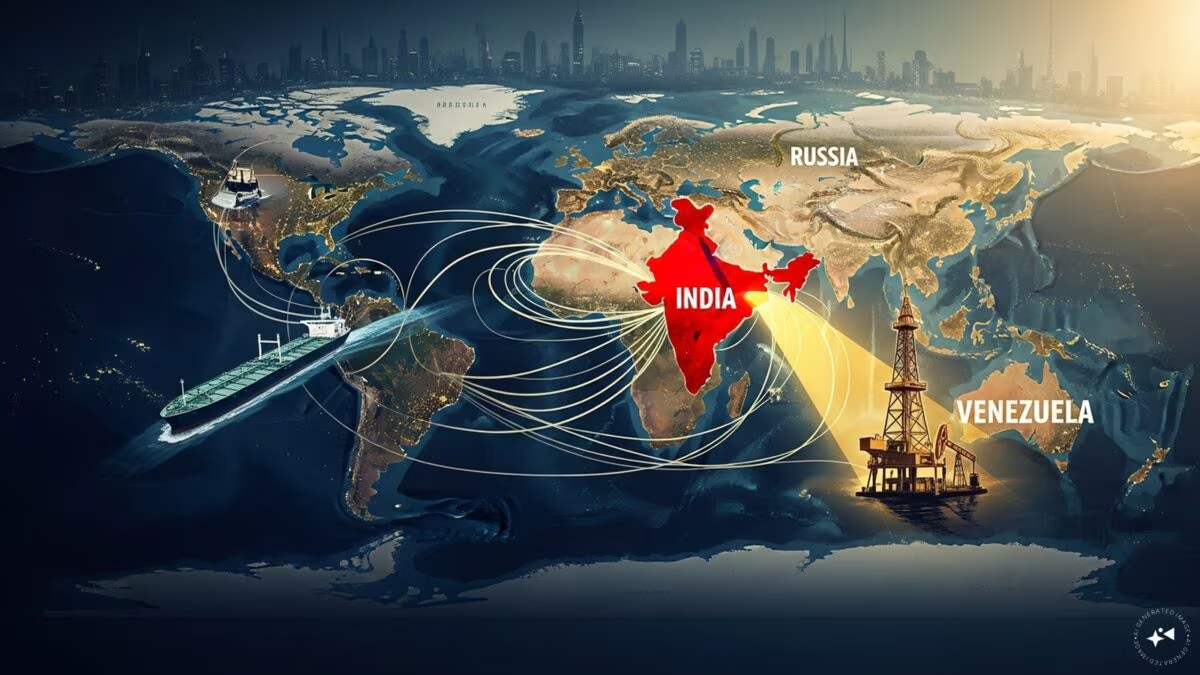
Before the war, roughly 20% of both global crude oil and seaborne gas flowed from Persian Gulf producers through the Strait, primarily to Asian markets. Although crossings have recently increased, the Strait remains severely constricted, with a dual blockade obstructing tankers and other merchant shipping. According to The Wall Street Journal, an Iranian official recently stated that the Strait is open for all commercial vessels, but they must cooperate with Iran’s navy, while brokers say that ships have paid tolls to Iran of up to $2 million per ship. A counter-blockade enforced by the US Navy on Iranian ports has left the Strait tightly constrained.
Although the US and Iran agreed to a temporary ceasefire on April 8, the Strait and the surrounding region remain an active military theater. Assuming an eventual end to hostilities, it may take a long time to restore confidence for shippers to believe it is safe to trade through the Strait.
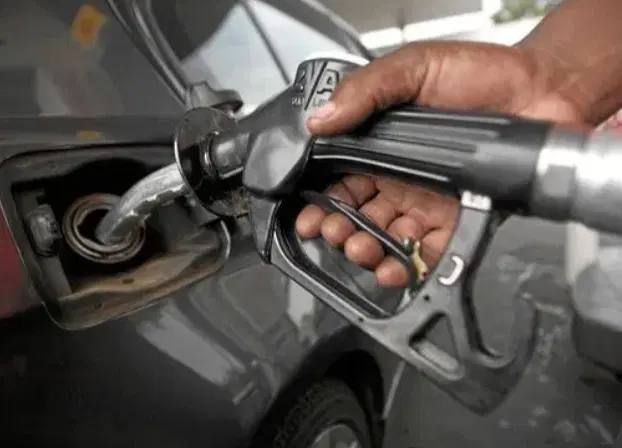
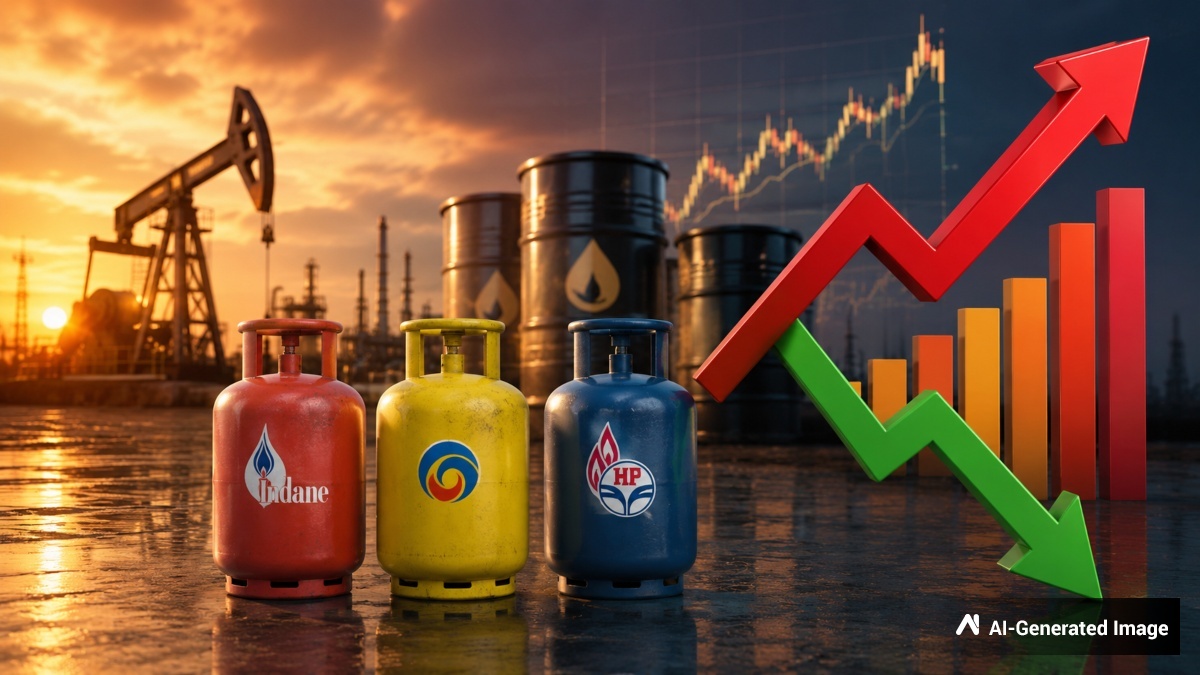
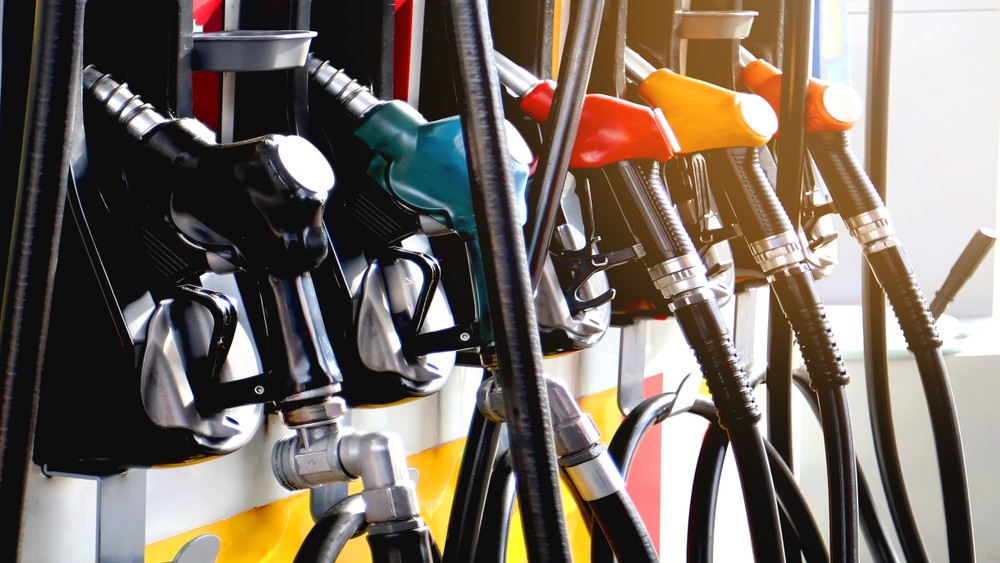
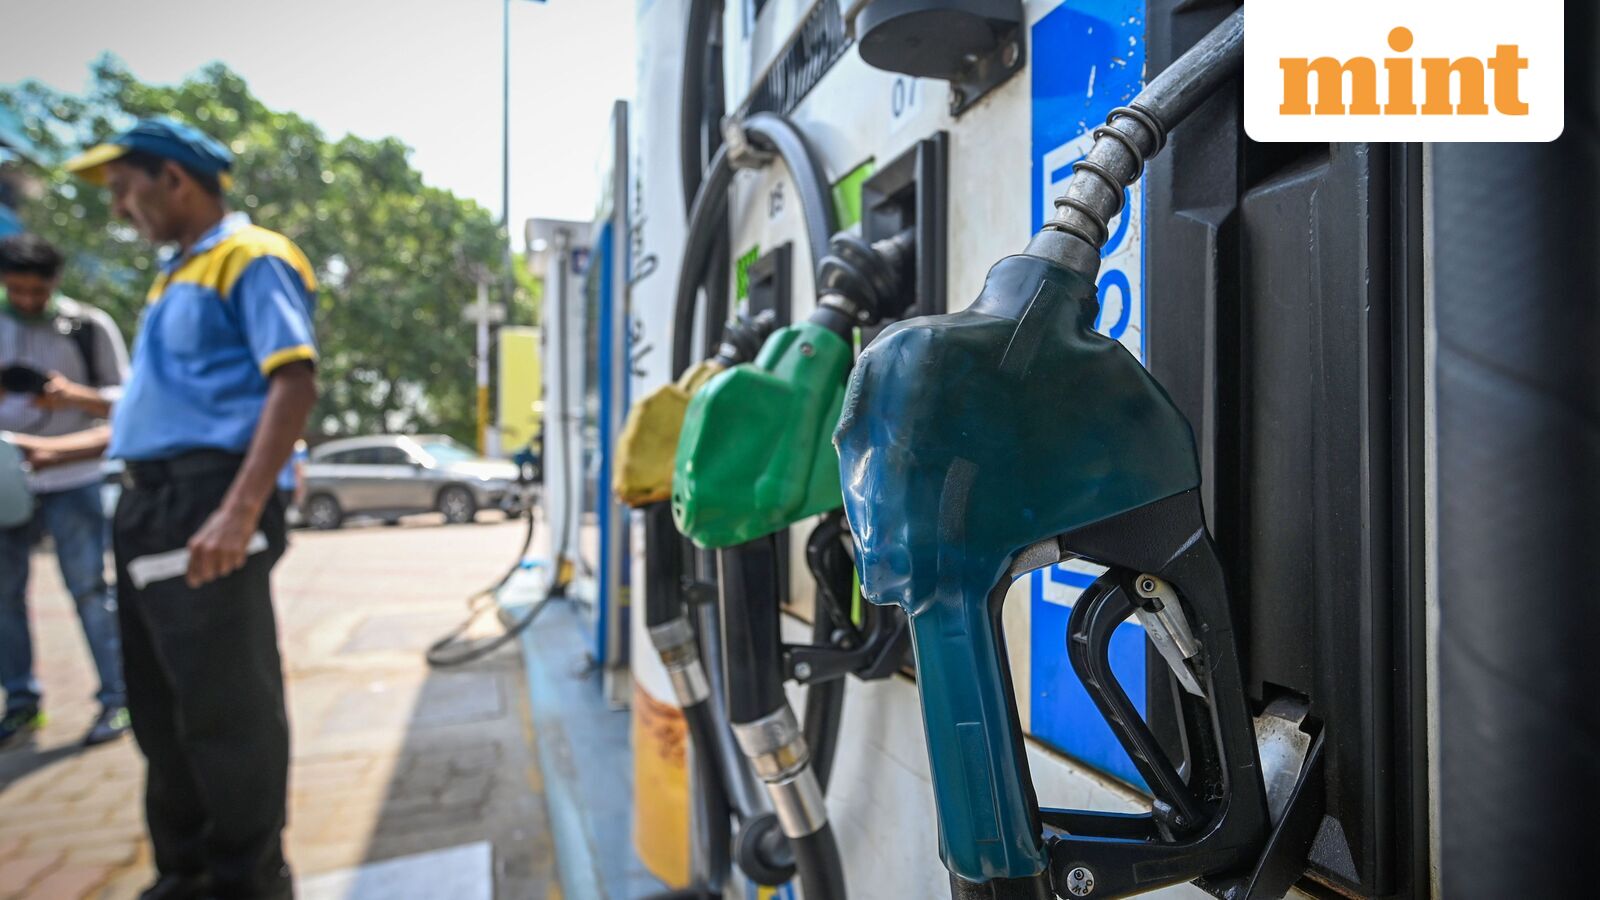
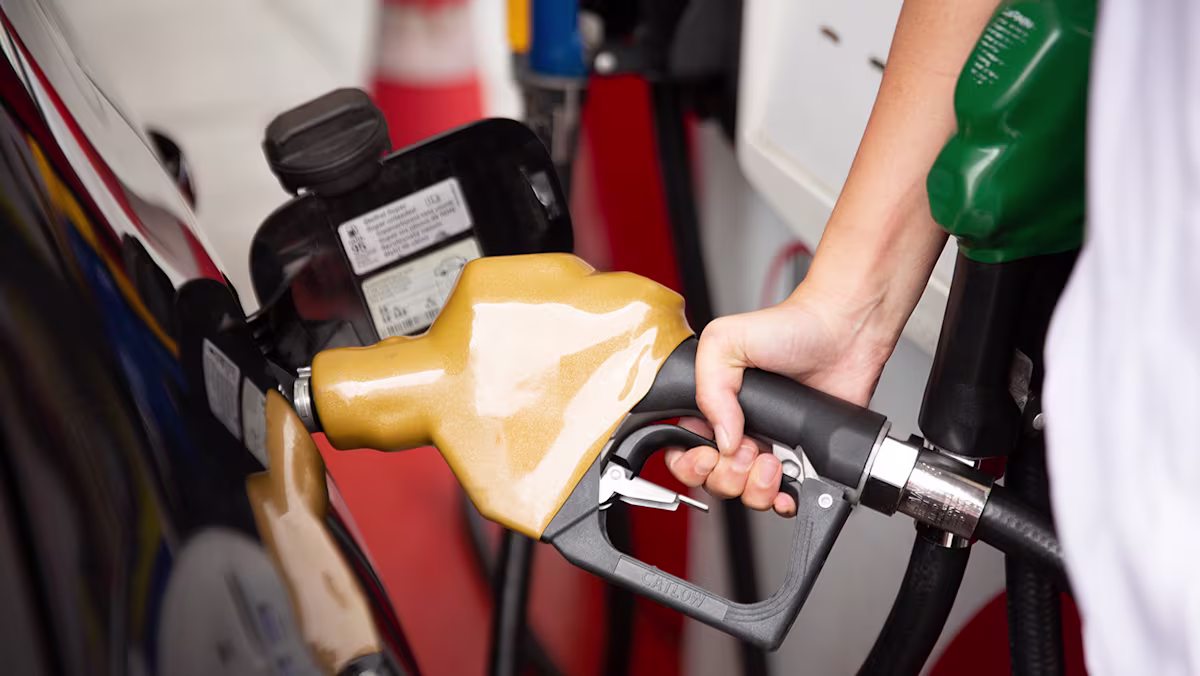
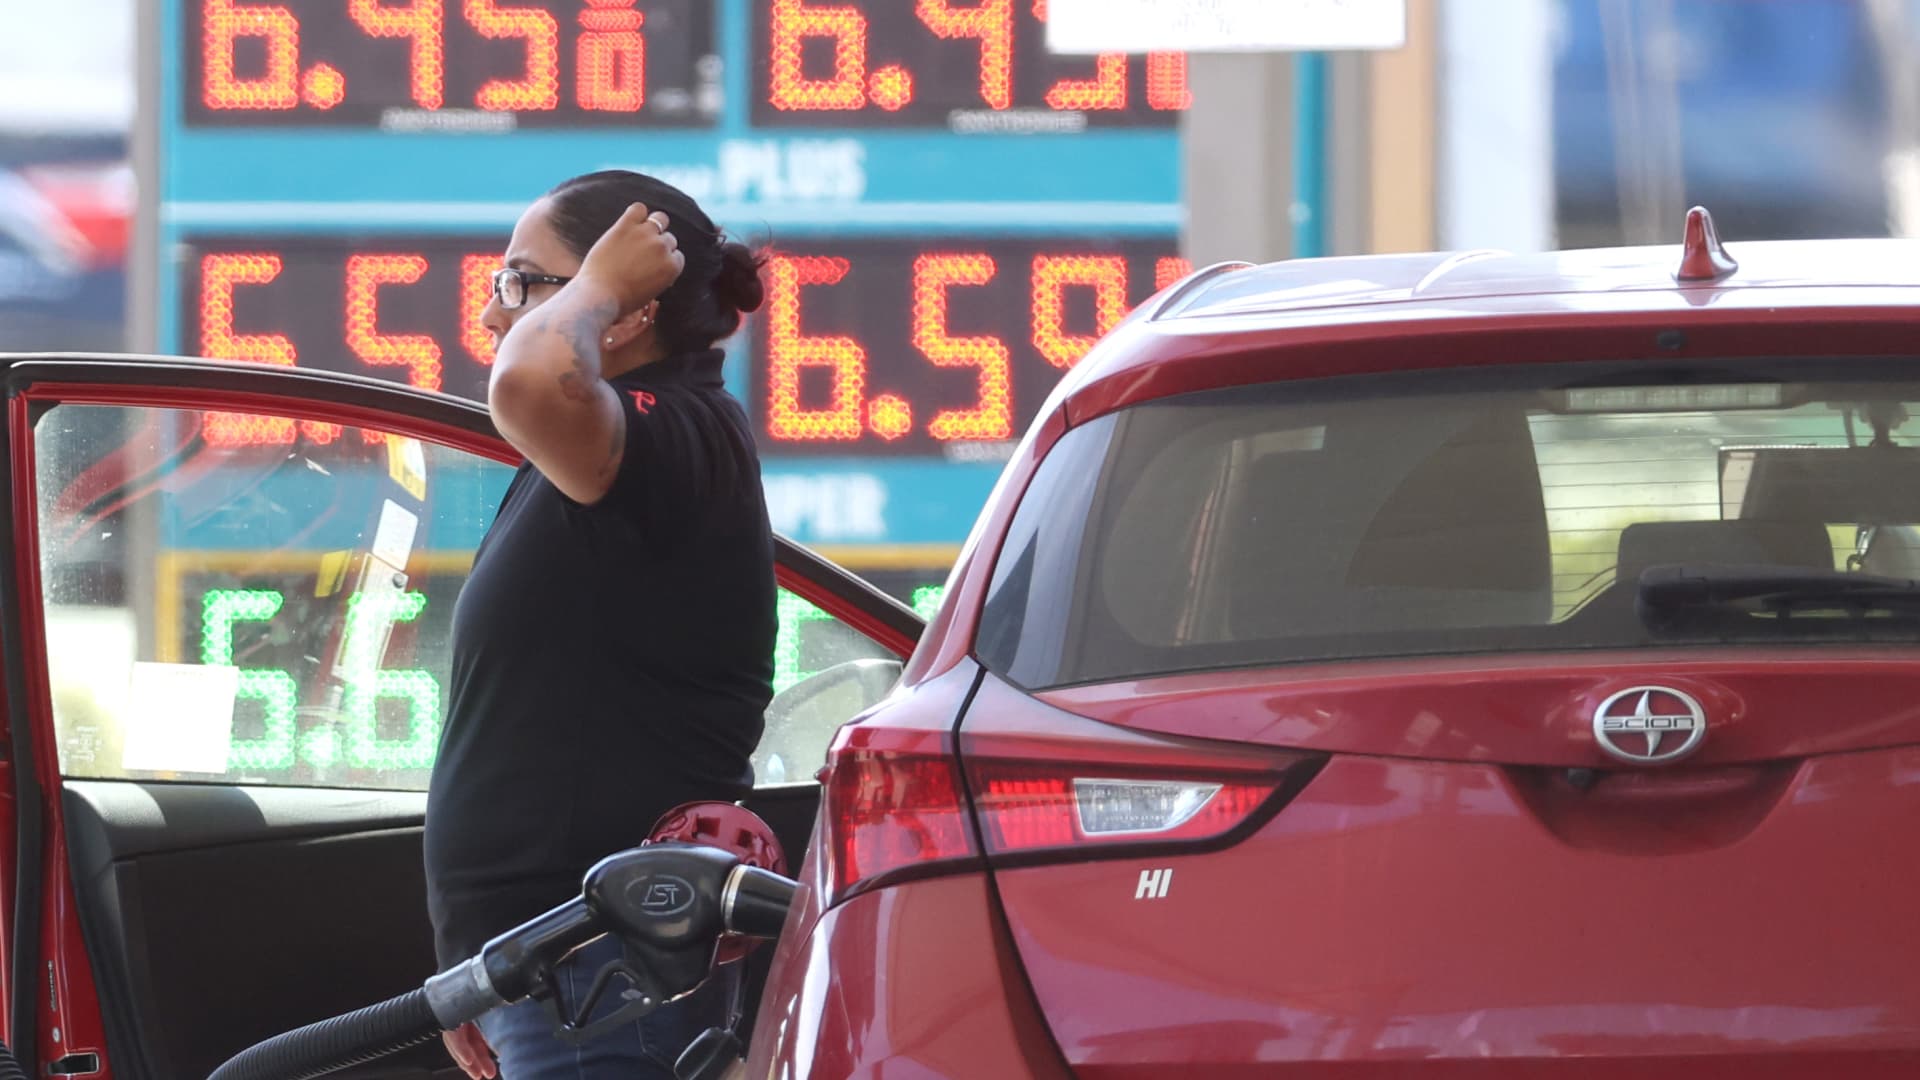
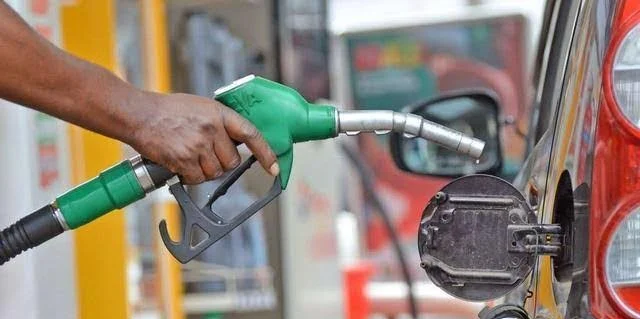
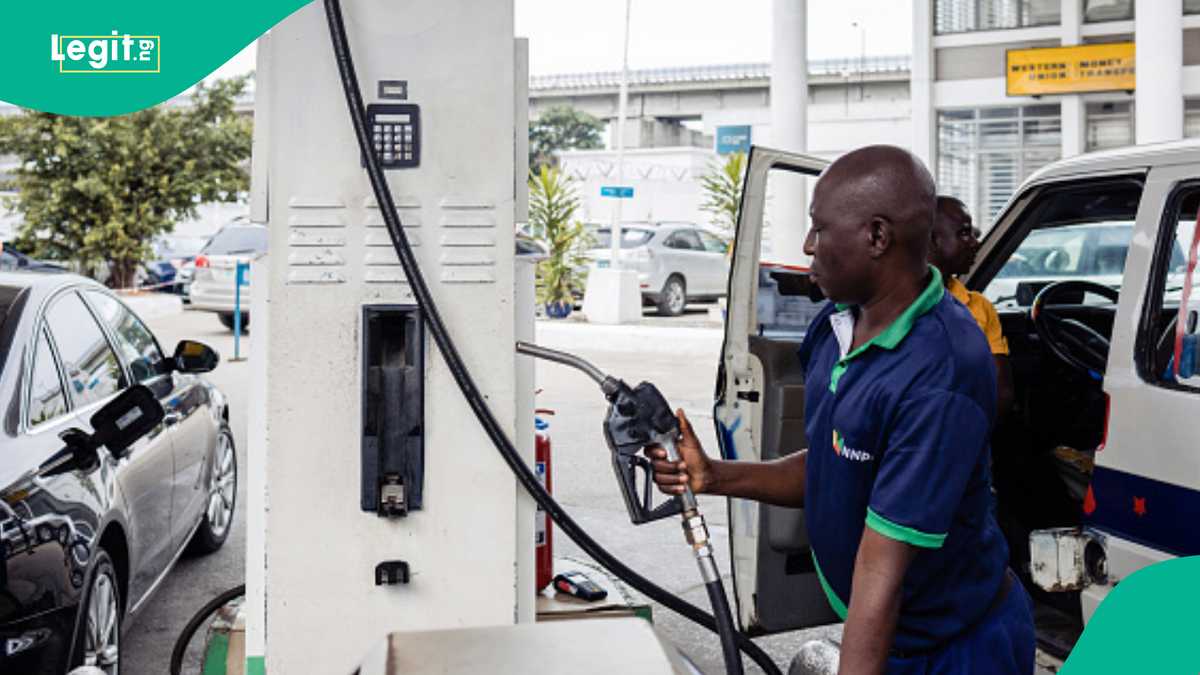
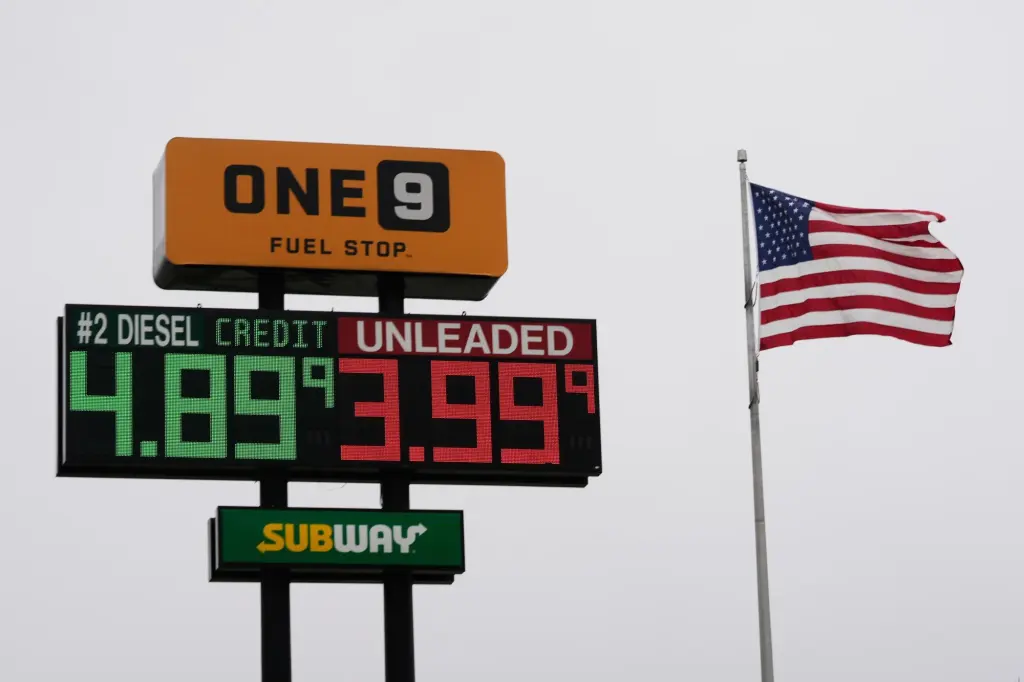
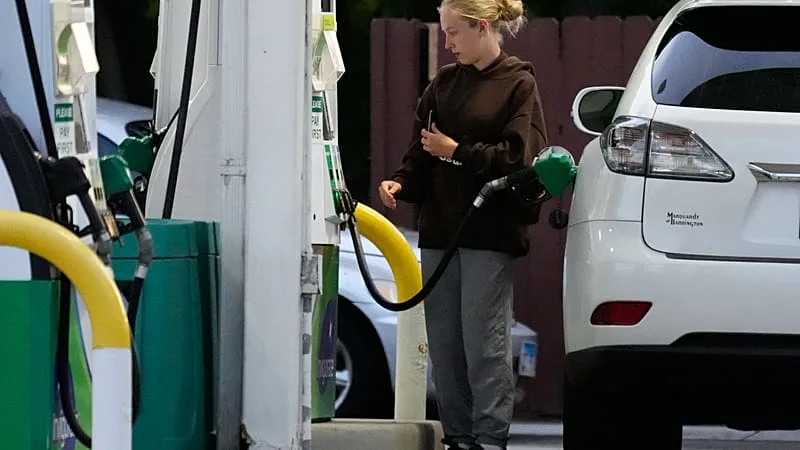
Fuel Prices Spike Ahead of the Summer Driving Season
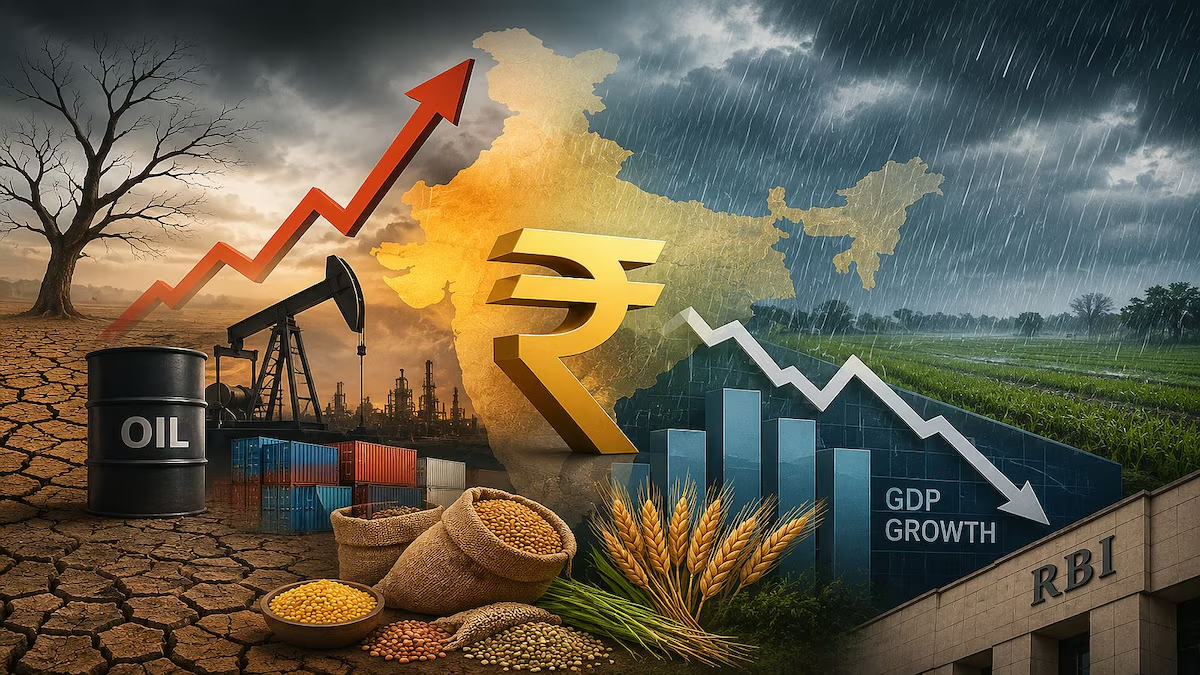
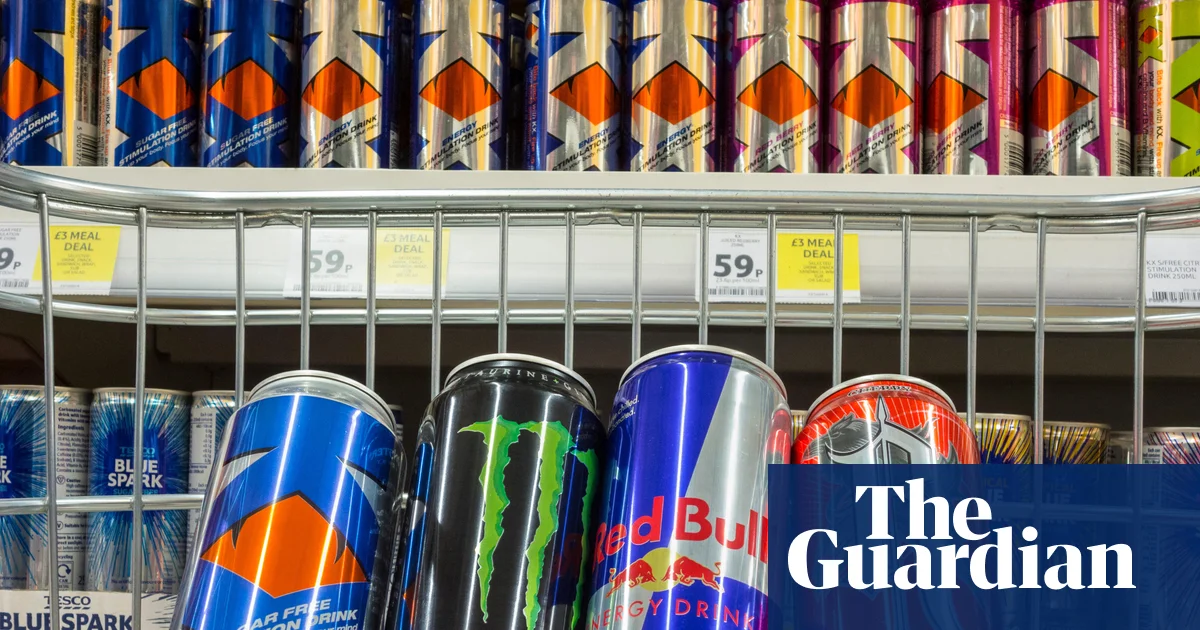
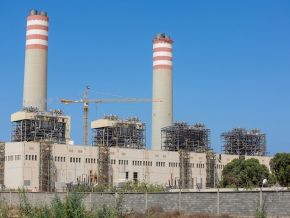
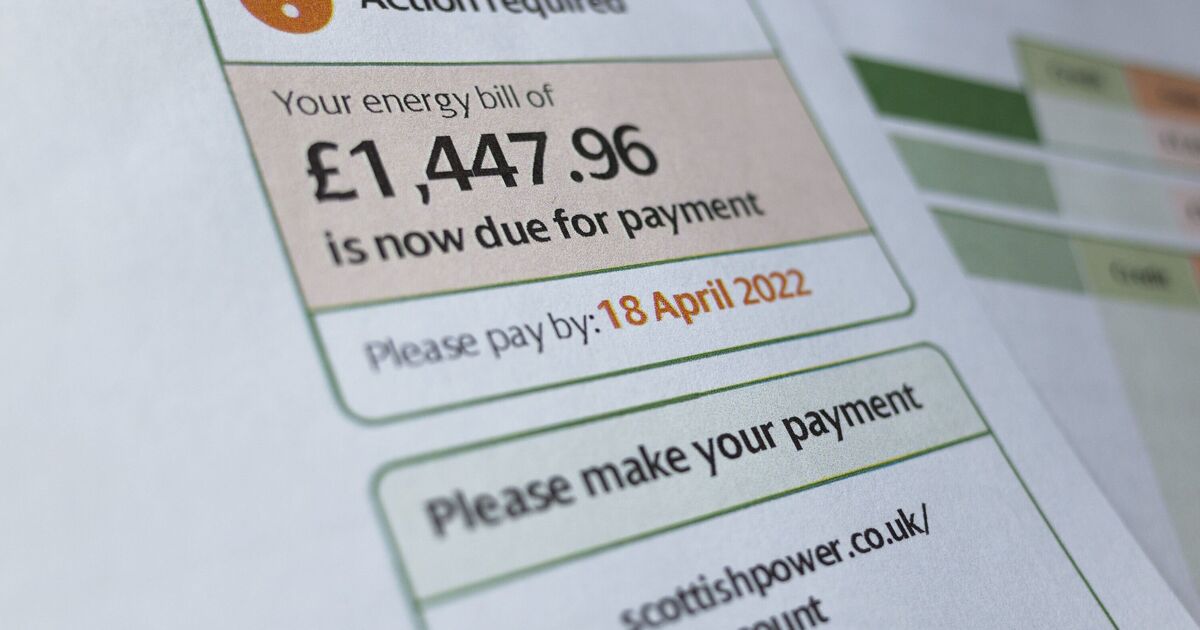
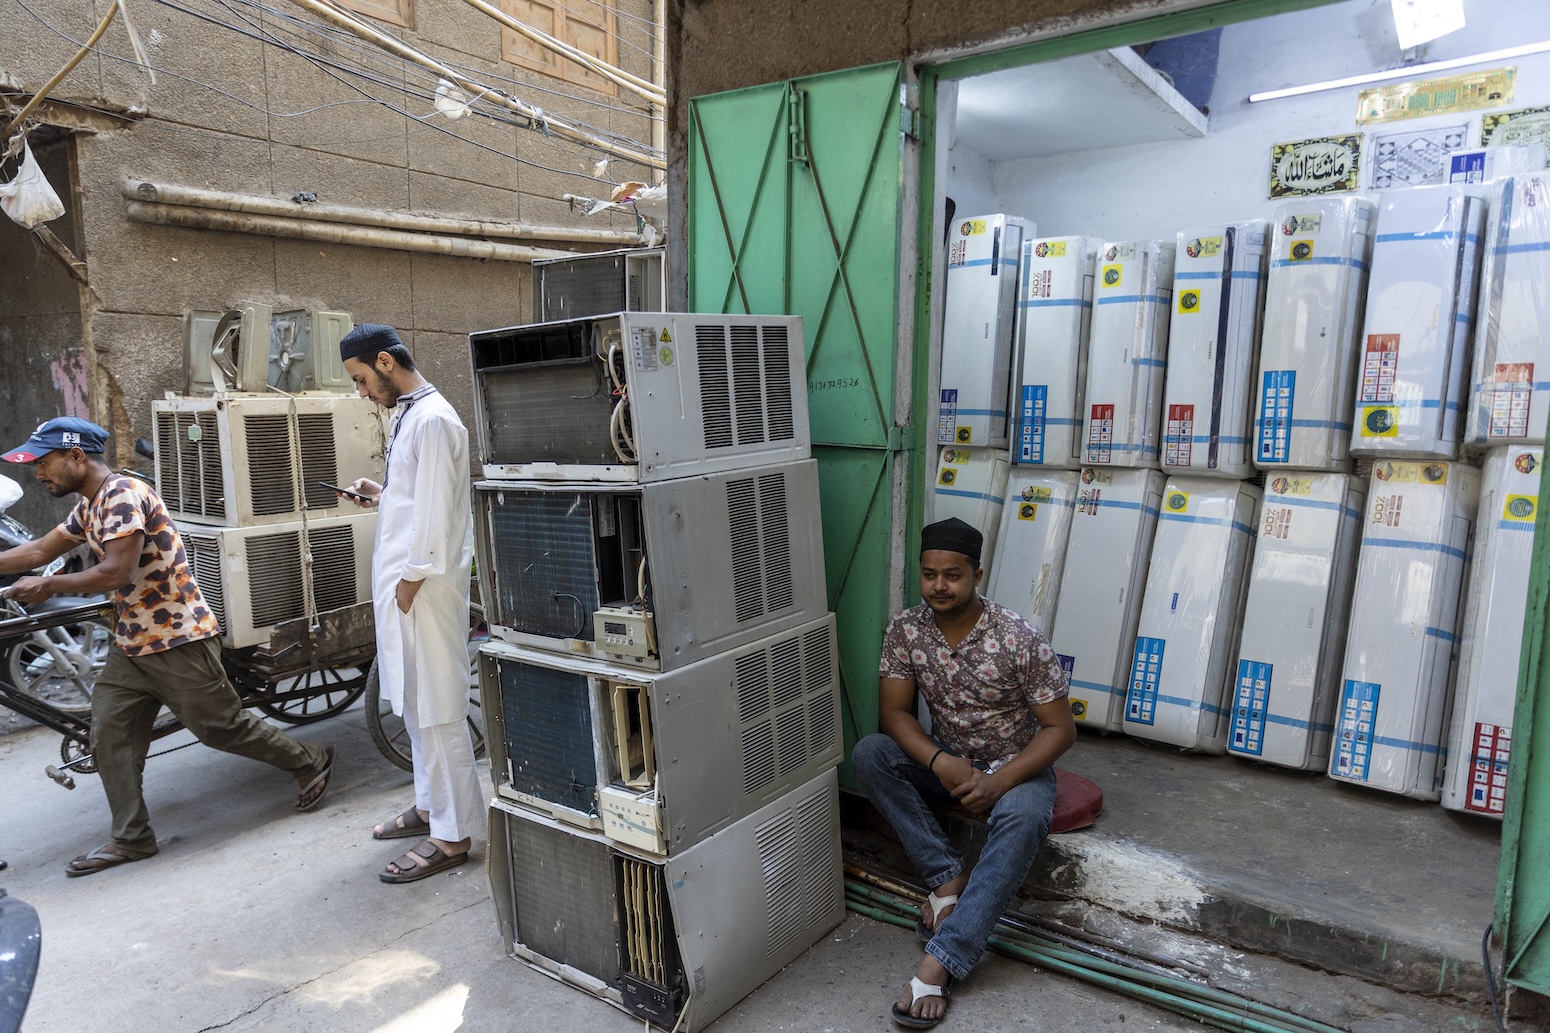
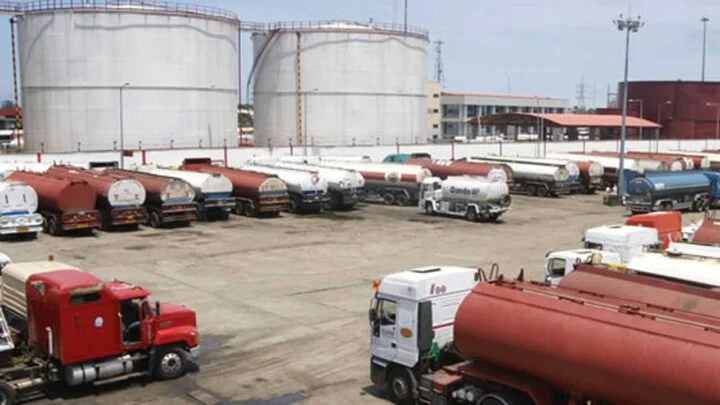
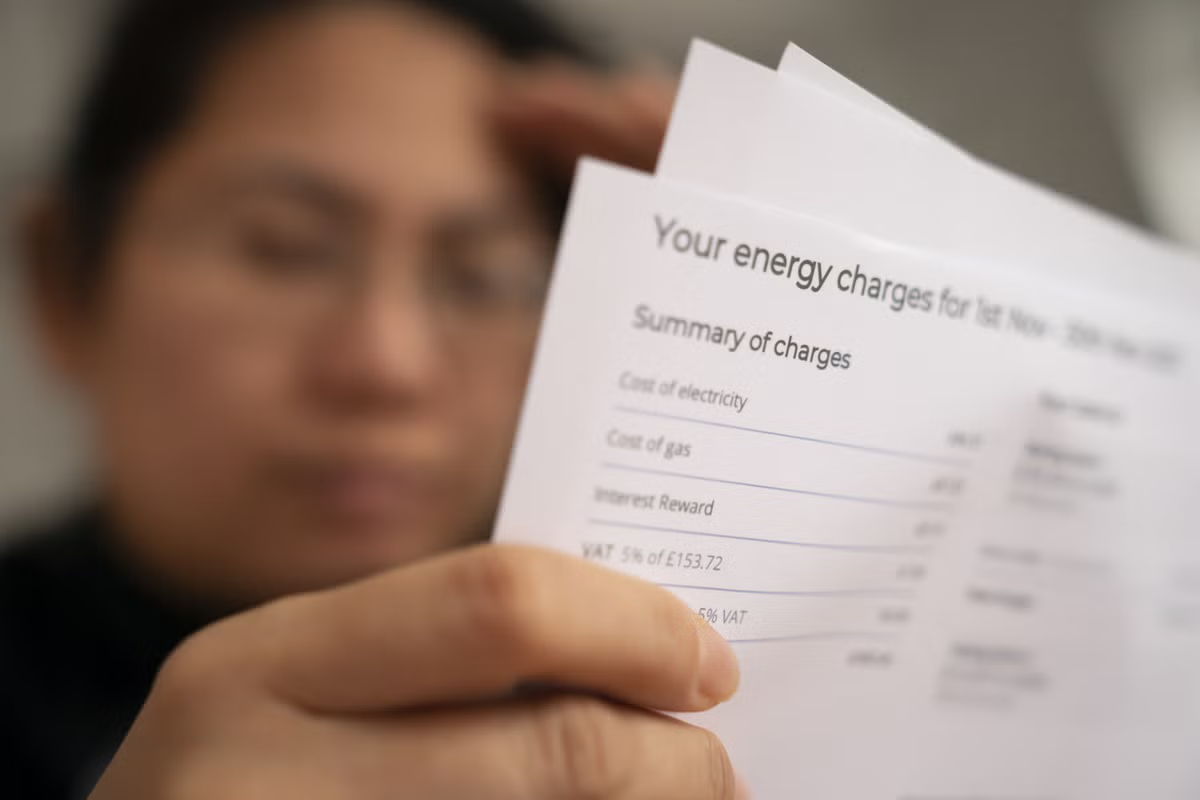
The current surge in oil and LNG prices has hurt energy-intensive sectors, including transportation (airlines, shipping, trucking), petrochemicals, manufacturing, and agriculture, causing ripple effects for suppliers worldwide. Consumers are also contending with a sharp uptick in gasoline and diesel prices just before the peak summer driving season in the northern hemisphere. The energy price shock has increased headline inflation in many countries and dampened global growth prospects. If sustained, central banks may become more hawkish until we have greater clarity on the economic and labor market effects of the shock. A prolonged closure of the Strait could ultimately create conditions for stagflation.
How Long Until Global Crude Oil Supply and Demand Are Balanced?
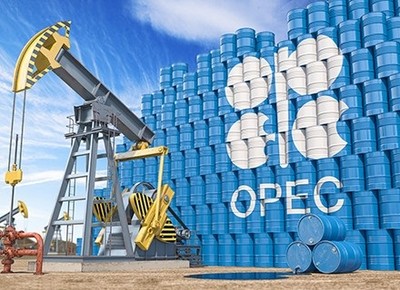
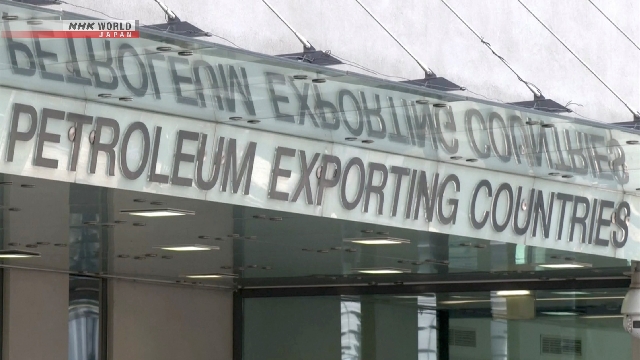
Based on OPEC’s most recent market report, the actual global shortage of crude oil was 2.9 million barrels per day in the first quarter of 2026. Assuming the Middle East conflict ends in June, we forecast that due to demand destruction and the constriction of Persian Gulf supply, the global shortage of crude oil will peak at 4.6 million bpd in the second quarter. Following this, we assume that a gradual rebound in Persian Gulf exports will allow crude oil rationing and demand-saving measures to ease, letting world oil demand rebound and the shortage gradually ease through year-end 2026. However, as the conflict is ongoing and the Strait remains largely blocked, the magnitude of the global crude oil shortage could still be greater and its duration longer.
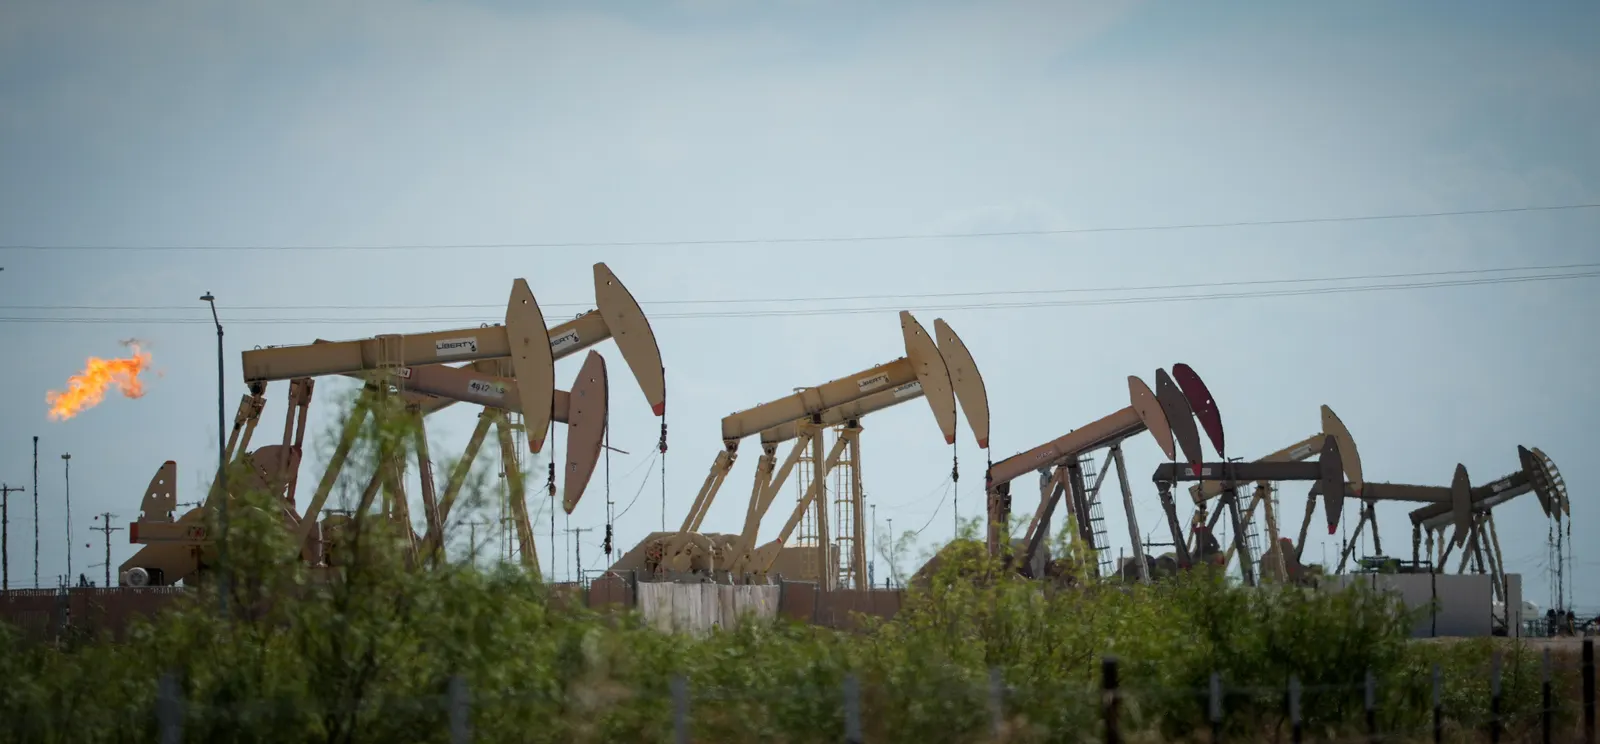
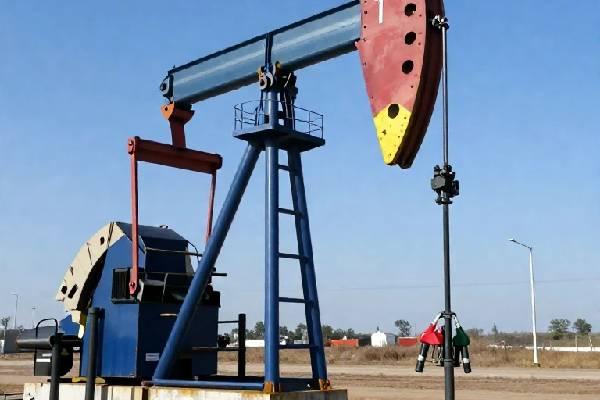
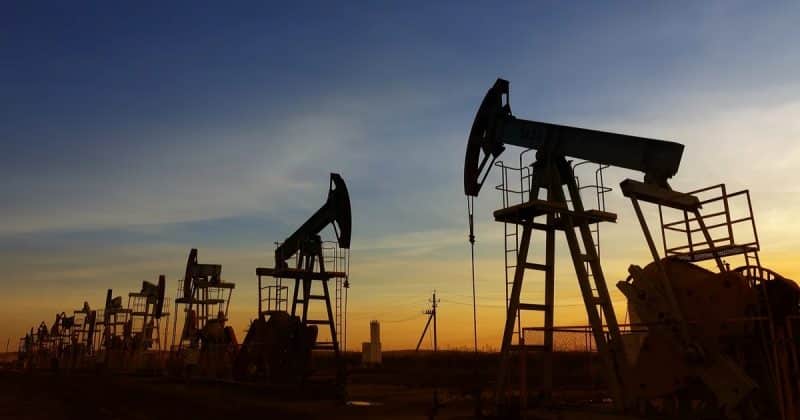
Despite the sharp increase in the WTI price (recently ranging from $95/bbl to $105/bbl), many non-OPEC+ producers do not plan on increasing production any time soon—despite a potential windfall profit opportunity—because of uncertainty about the long-term price outlook, infrastructure constraints, and capital discipline. In a survey recently conducted by the Federal Reserve Bank of Dallas, most US energy company executives expect domestic oil production to increase only 1% in 2026 and 2% in 2027 in response to the Iran war.
Currently, the Federal Reserve estimates the profitable breakeven oil price for drilling new US wells at $62/bbl-$70/bbl. The delayed non-OPEC+ supply response will likely help prolong the global crude oil shortage and support higher oil prices for longer. Reflecting the current squeeze on global crude oil production and the steep drawdown of crude oil inventories, near-term oil prices remain much higher relative to those for oil deliveries in the future— that is, a backwardation market structure. In the current extraordinary environment, crude oil producers are incentivized by a steeply declining futures price curve to sell production into the marketplace immediately, rather than store crude oil and sell later at lower prices.
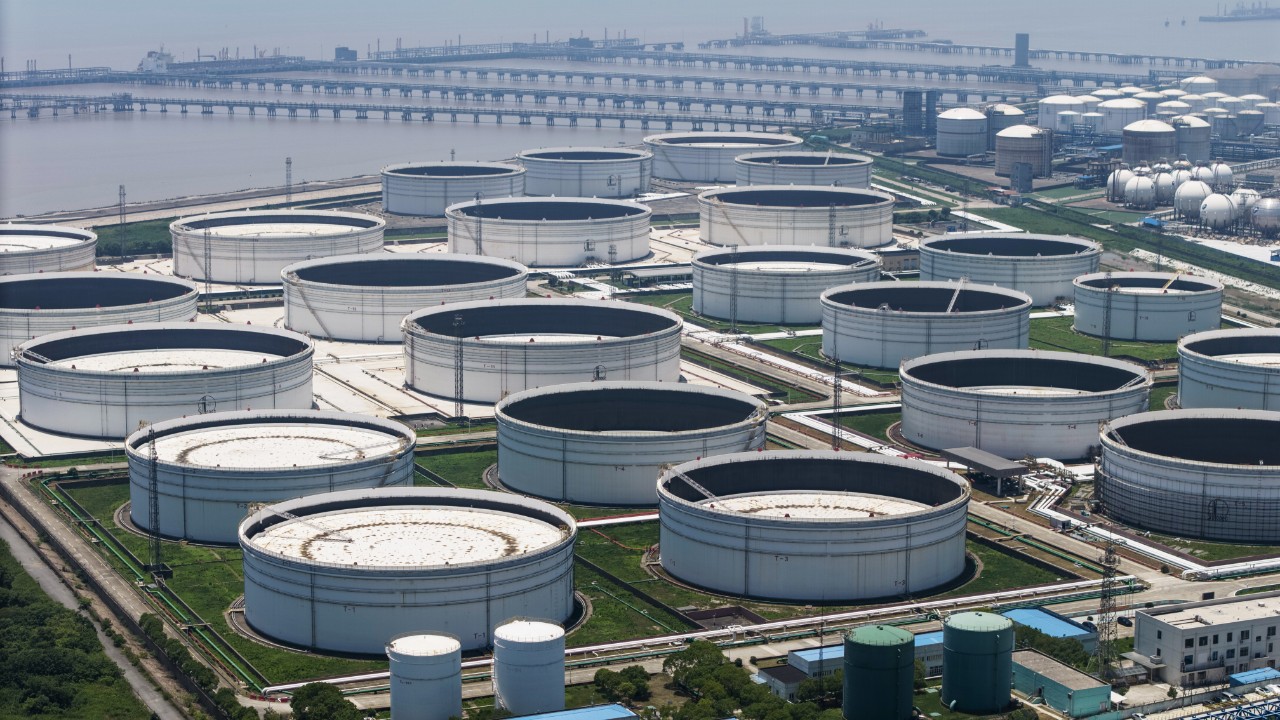
Rapid Drawdown of Global Crude Oil and Oil Product Inventories Since the Beginning of the Iran War
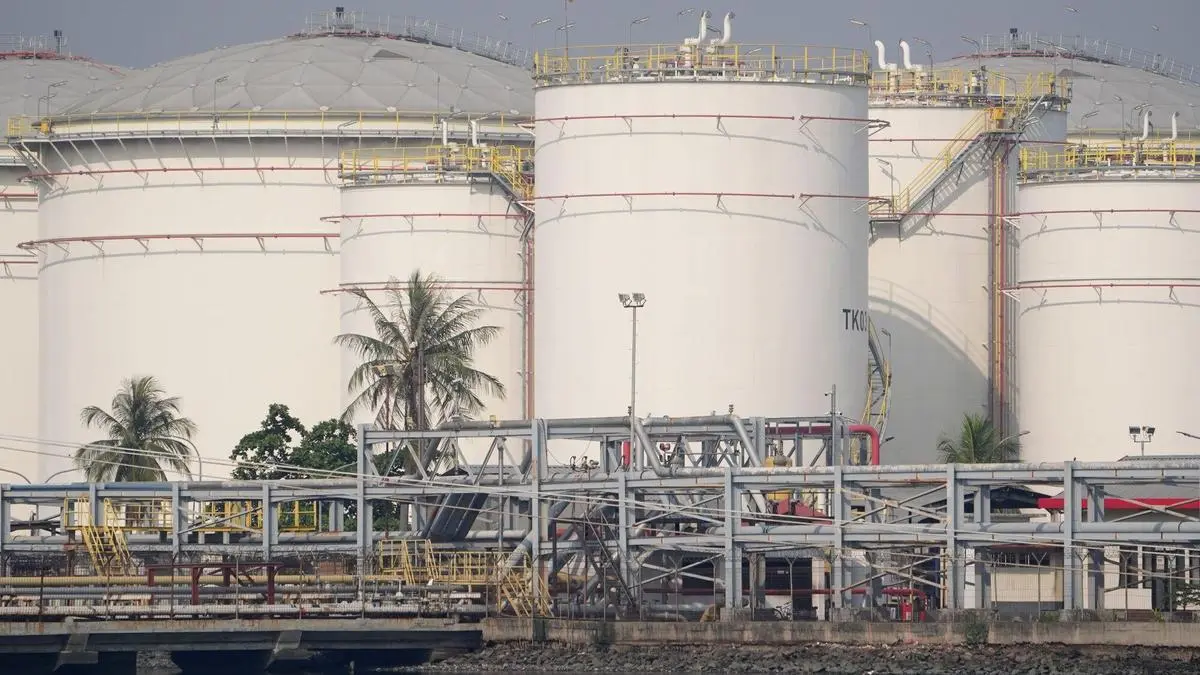
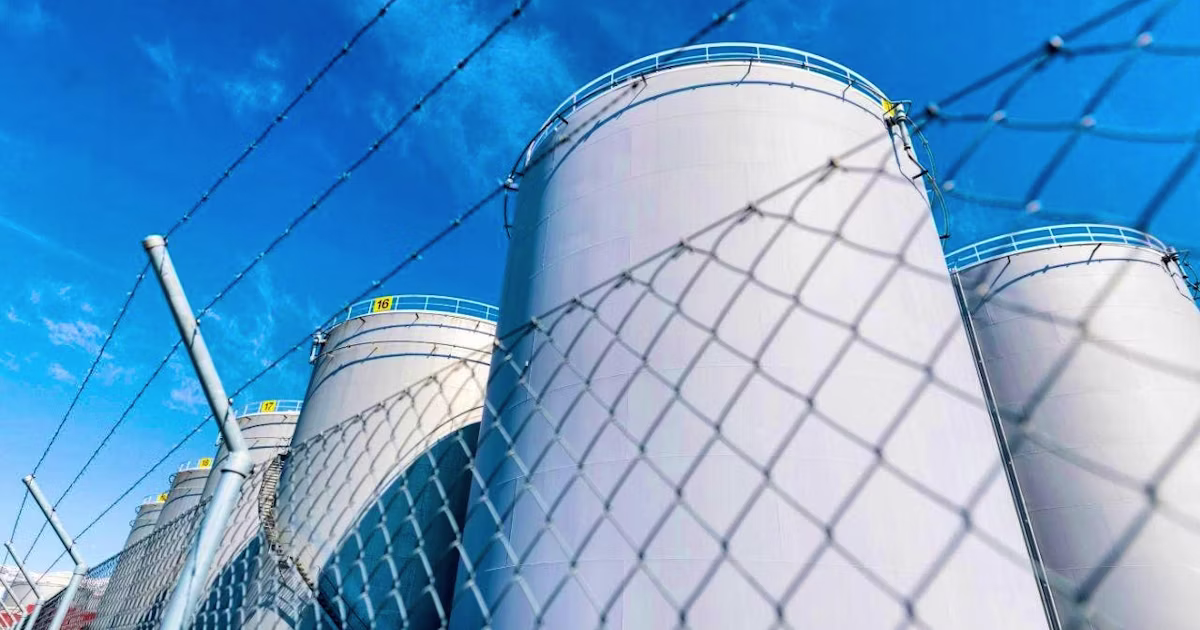
The International Energy Agency estimates that total global observed inventories of crude oil and oil products in February 2026 were approximately 8.2 billion barrels, the highest level since February 2021. Total inventories include OECD inventories, non-OECD inventories, strategic reserves, and oil in storage/floating stock. Within total inventories, there are operational minimum inventories (i.e., a non‑withdrawable base needed to run the system) and usable inventories (i.e., the flexible portion that can be used to offset supply shocks).
Although total global observed inventories can appear large, operational minimum inventories typically make up most of them. Therefore, inventory draws must come from usable inventories, a smaller portion of the total. Crude oil inventories in 2026 have undergone a sharp two-phase shift. The year began with a relatively comfortable supply, as inventories entered January at elevated levels following strong builds through late 2025, supported by robust non-OPEC production and moderate demand growth.
Through January and February, stocks remained high or continued to build modestly, with OECD inventories near historical averages and global balances still reflecting surplus conditions. However, from late February onward, the market experienced a dramatic reversal driven by the conflict, forcing a heavy reliance on inventories. As a result, global oil stocks saw exceptionally large drawdowns, falling by roughly 85 million barrels in March and a further 117 million barrels in April, with OECD inventories alone declining by about 146 million barrels in April.
This tightening trend is also reflected in US data, where early-year inventory builds transitioned into sustained weekly declines through April and May, alongside falling Cushing storage levels. As of May 2026, inventories continue to draw at a rapid pace (EIA estimate of 8.5 million b/d in the second quarter of 2026), leaving the global oil market significantly tighter than at the start of the year and increasingly dependent on the resolution of supply disruptions.
Midcycle Oil Price Expectations Are Unchanged
Our midcycle or normalized long-term price band of $50/bbl-$70/bbl for WTI crude oil remains unchanged. The band reflects our best judgment of the marginal cost of adding new crude oil supplies from sources such as US shale resource plays and a global market that is reasonably well-balanced. Reflecting the extreme market conditions, our forecast for 2026 is above this band. Thereafter, with the expectation that market conditions normalize, our 2027 and 2028 forecasts fall within this band.
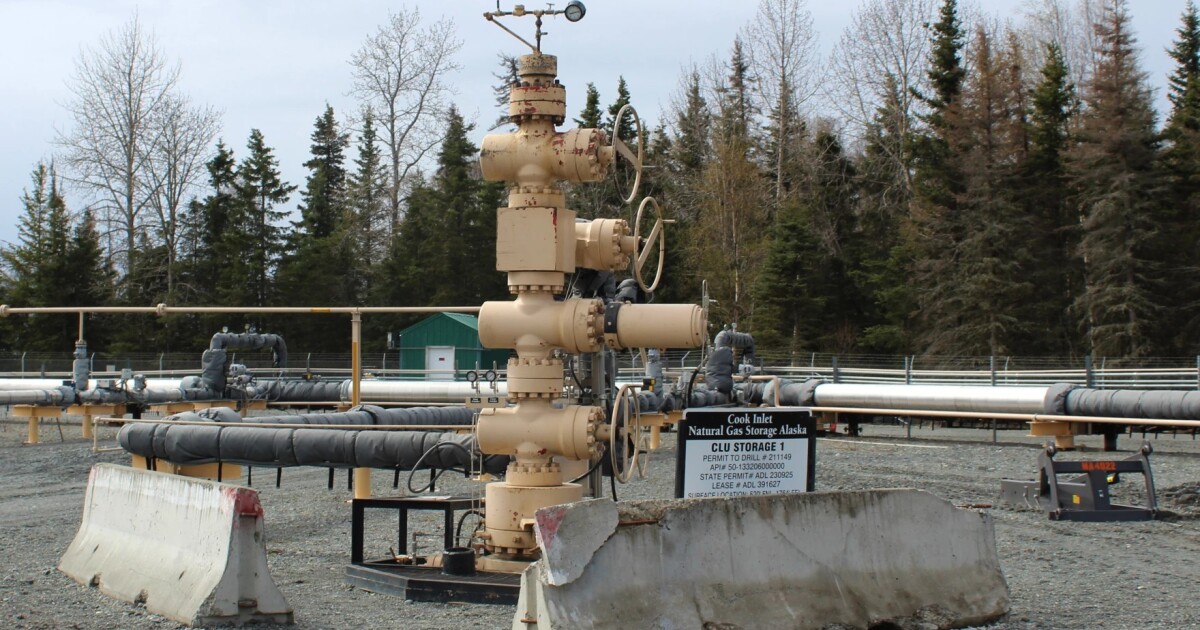
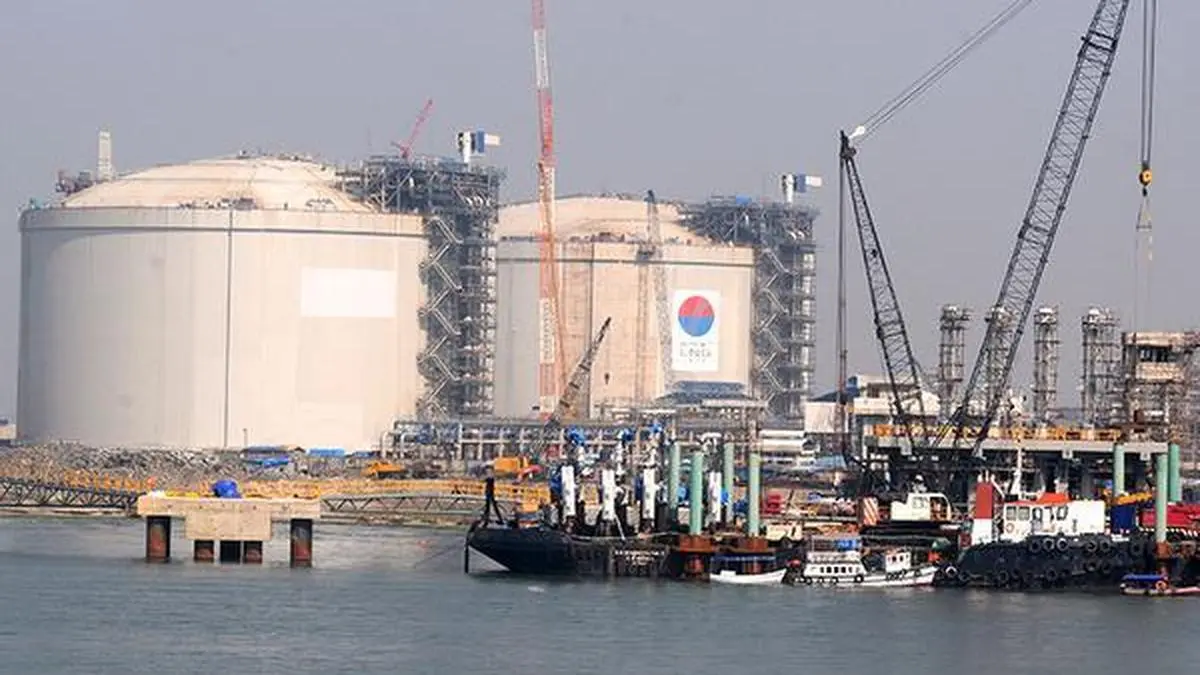
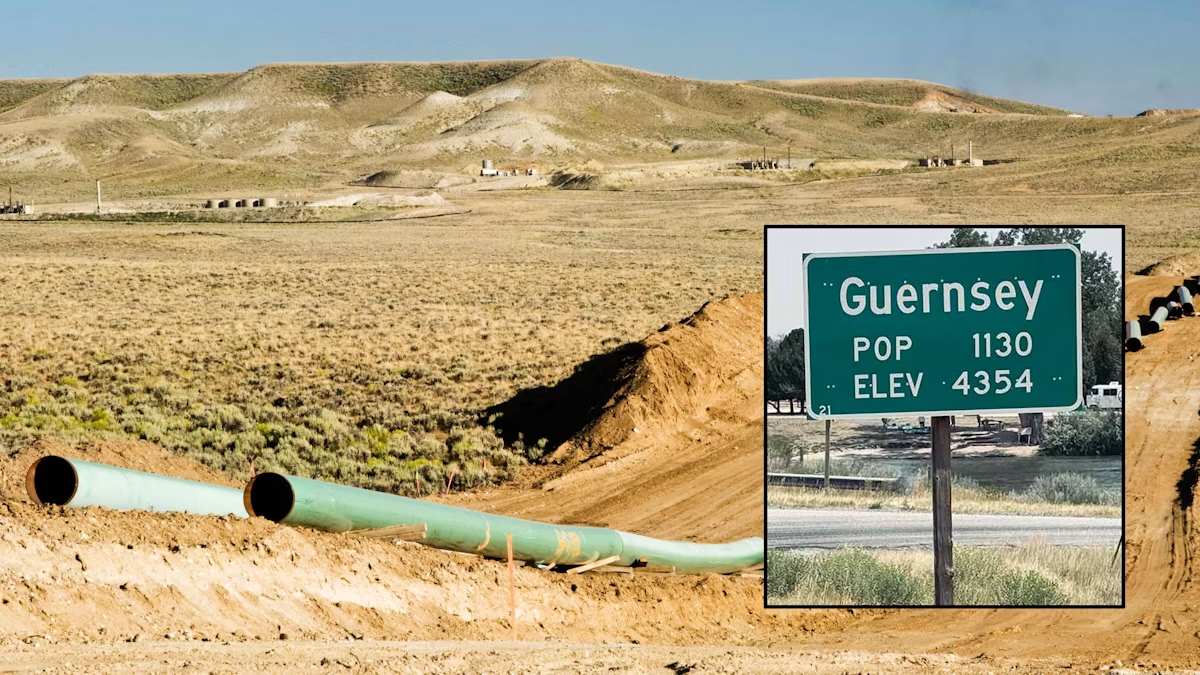
US and Canadian Natural Gas Supply/Demand Analysis
The first few months of 2026 have been characterized by continued robust US and Canadian natural gas production and ample gas storage inventory, collectively tending to hold back gas prices. We expect US gas production to persistently increase this year, partly driven by the rising output of associated gas from gradually expanding crude oil production supported by higher oil prices. Currently, US underground gas storage inventories hold 2,391 billion cubic feet, about 1% more than year-ago stocks and 7% more than the five-year average for this time of year. After hitting an interim peak of $31.89/mcf on Jan. 23, 2026, from an early winter cold snap, the NYMEX spot price cycled lower, ranging between $2.64/mcf and $3.39/mcf during the past several weeks, and currently resting at $3.00/mcf.