Double Bottom Pattern Supports Bullish Reversal
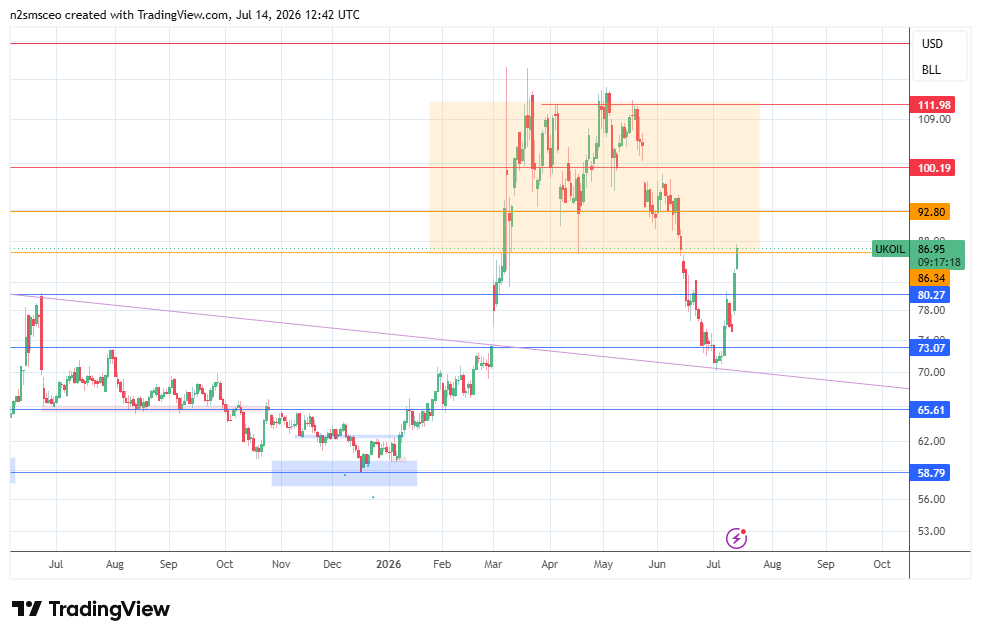
In addition, the advance above the swing high at $78.44 triggered a large double bottom pattern. A breakout of that pattern provides additional technical evidence supporting the possibility of a long-term bullish reversal.
Follow-Through Will Determine Trend Strength
Despite the longer-term bullish implication of today’s price action, follow-through will provide important indications. If support is retained at or near the 200-week average, bullish continuation may result. A failure of support at the 200-week average could lead to a deeper decline and test of support near the long-term downtrend line. Currently, it is approximately $70.49, which matches Tuesday’s low.
Comparing Prior Upswings Confirms Buyer Strength
Another sign of strength can be seen when comparing prior upswing within the larger downtrend structure, beginning from the $131.31 peak in 2022. Specifically, the most recent rally that began in April 2025 completed a 42.4% advance. The prior advance from 2023 completed a 50% advance. Note that the current rally is almost an exact match of the largest upswing within the long-term downtrend. This provides further evidence that the buyers may be taking control of the long-term trend.