Triangle Pattern Builds Pressure
A symmetrical triangle pattern is a great way for the recent high volatility environment to eventually stabilize. As the price range narrows within the confines of the triangle, uncertainty increases and demand builds in preparation for a move out of consolidation. Given the timing of reaching the triangle apex, one of the two pattern boundary lines will be broken before June 4. Once there is a decisive breakout, volatility should spike again in the direction of the breakout.
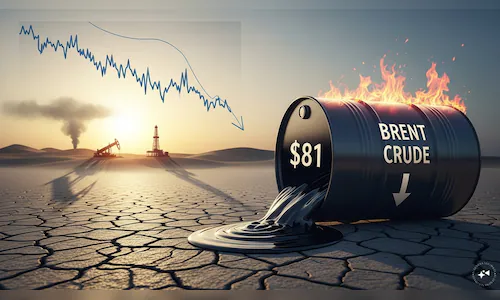
If instead, this week’s low of $90.05 is broken, then the prior low of $81.94 becomes a target, followed by the rising 100-day moving average, currently at $77.97 and rising. Since this week’s low is not yet confirmed as a swing low, that possibility needs to be considered. Otherwise, crude oil is anticipated to further consolidate within the developing triangle pattern.
Bullish Hammer Points to Upside Test
Thursday’s inside day took the form of a bullish hammer candlestick pattern, which will trigger above the day’s high concurrent with a reclaim of the 20-day moving average. That would strengthen the bullish case for a continuation toward the upper boundary of the triangle pattern, tying back to the developing consolidation structure highlighted earlier. An upside target is near the top boundary line. There is also a prior weekly high at $105.99, marking a potential upside target.
If you’d like to know more about how commodity markets work, please visit our educational area.