Support Confluence Forms Near Short-Term Base
Nevertheless, crude oil has reached a short-term potential support zone that could lead to a bounce attempt that tests prior support as resistance. There is the confluence of support indicators from the $90.05 swing low down to an internal uptrend line (dashed) that is also the bottom boundary of a possible symmetrical triangle consolidation pattern. The midline of a falling trend channel is also present, showing potential support.
Bounce Scenarios into Resistance Zones
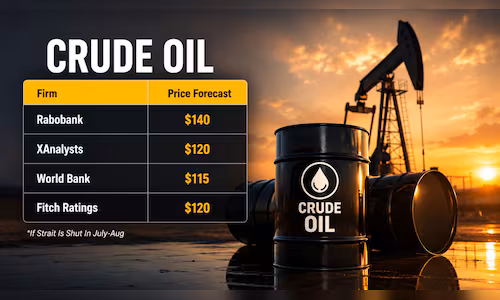
Key potential bounce targets include the 50-day moving average at $99.47 and last week’s high of $100.80. However, that strength is anticipated to lead to further weakness, as rallies are expected to be sold into within the broader bearish structure, as price turns back down to continue the bearish correction. It remains to be seen whether a continuation of the correction will occur with lower prices or sideways consolidation. The presence of a falling channel suggests lower prices or through further sideways consolidation.
Correction Phase Extends
A bounce from near current levels would confirm the integrity of the falling channel, with the top boundary line then a potential target. Further consolidation in crude oil is healthy longer-term as it keeps the price from getting too extended. Once the current correction is complete, crude oil looks set to make another run towards new highs, though timing will depend on whether support zones continue to hold in the near term.
If you’d like to know more about how commodity markets work, please visit our educational area.