The main trend is down according to three metrics: the swing chart, a trend line and the 50-day moving average.
The near-term range is $2.888 to $2.561. Its 50% level at $2.725 is the first resistance. The next resistance is a downtrend angle at $2.835, followed by a main top at $2.888 and the 50-day moving average at $2.949. Additional resistance is the intermediate pivot at $3.025.
Buyers face a series of headwinds and any rally is likely to be labored. The market is likely to remain in sell-the-rally mode unless a fundamental event is big enough to support a bullish trend.
The best thing that can happen for bullish traders heading into the summer cooling season is for a support base to form, highlighted by a series of higher-tops and higher-bottoms. That pattern slowly removes the shorts and possibly sets up a heat-driven rally. But it takes time. Be patient.
Weather and Supply Tell Different Stories
Forecasts for April 22 through April 26 call for above-average heat across the Southeast and Midwest. That’s driving expectations for stronger cooling demand and shifting sentiment after recent weakness. It’s what pushed prices higher into the end of last week.
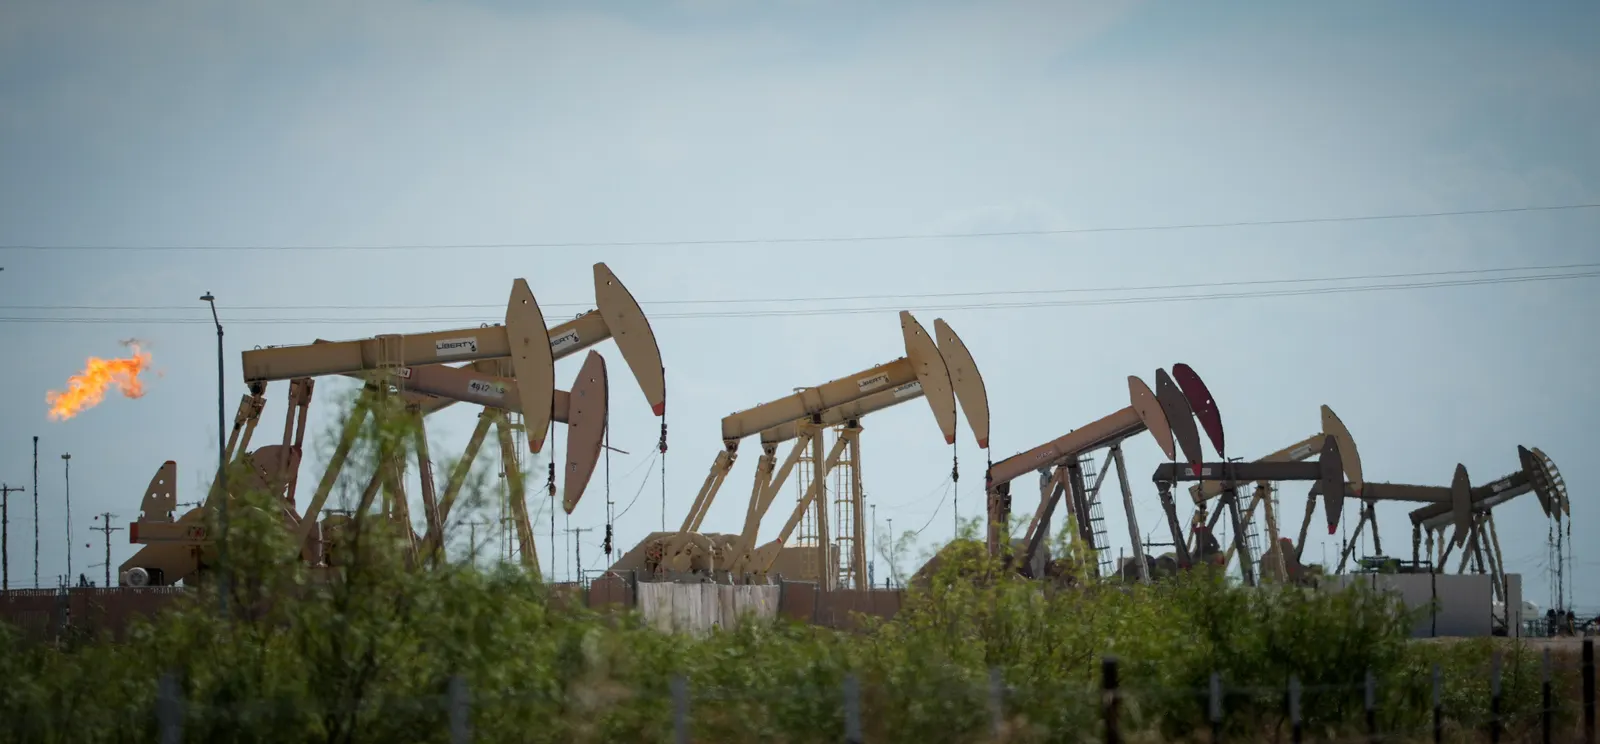
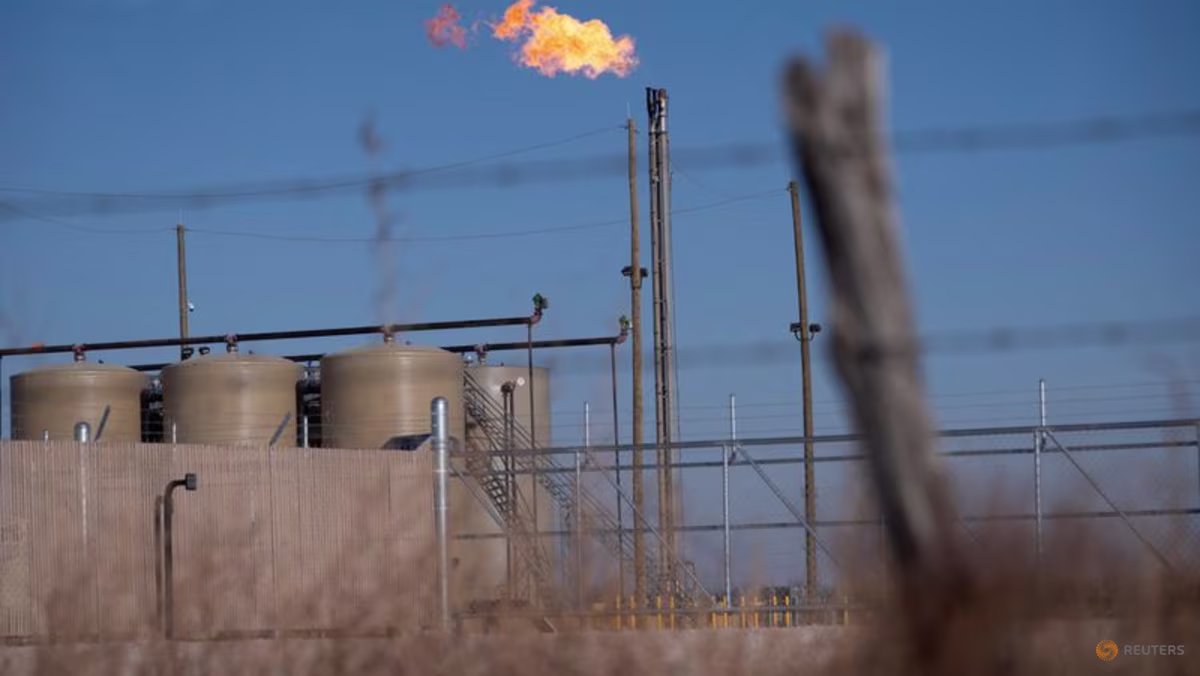
The supply picture tells a different story. US output is running near record levels above 111 Bcf per day with forecasts pointing to further increases. Inventories sit nearly 6% above the five-year average. That oversupply is a ceiling on any rally.