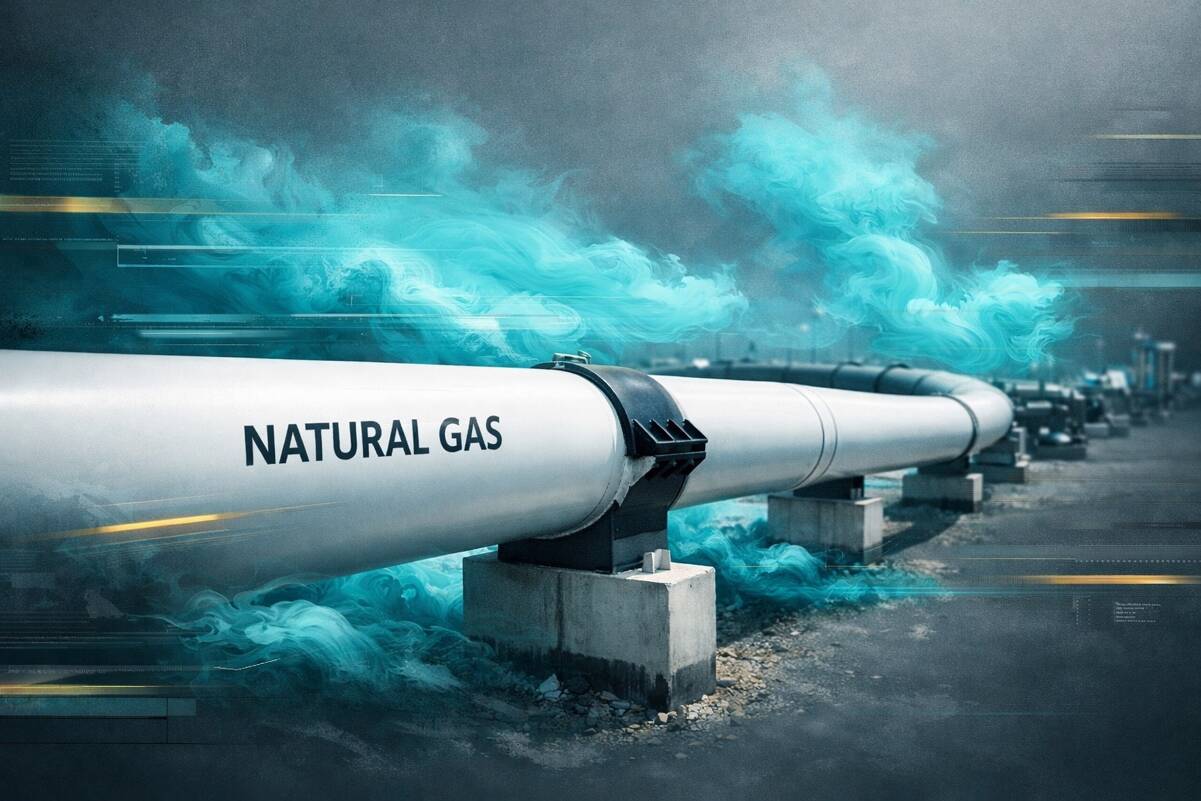
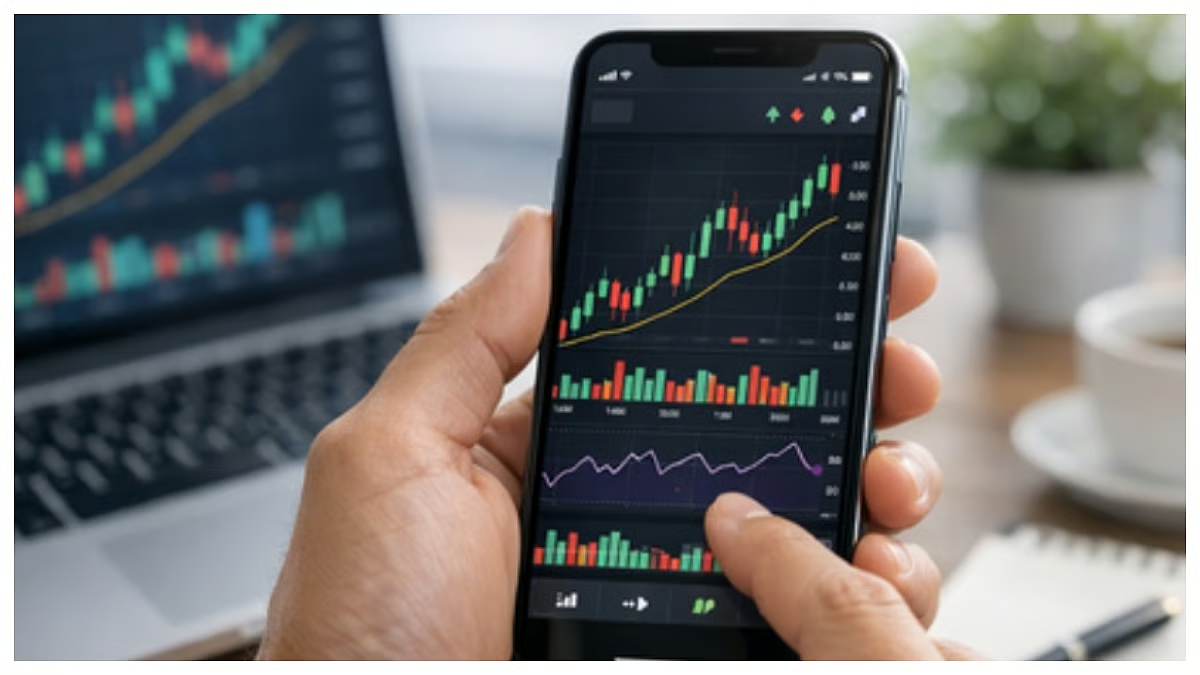
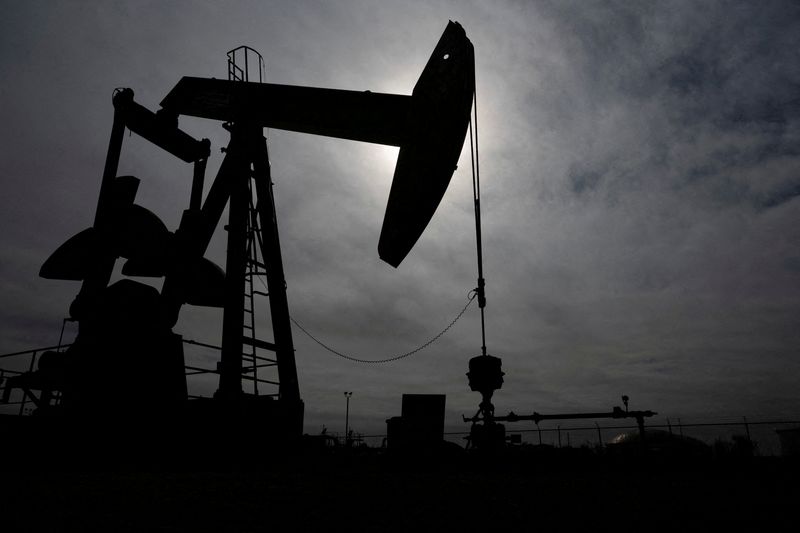
Upside Objective Still Intact Despite Pullback
Although a Fibonacci retracement target was reached following the breakout, the pattern’s minimum objective has not been reached. This suggests that another leg up may follow a short pullback. An upper target zone is potentially near the long-term uptrend line, which previously marked trend support. The current upswing will test it as resistance; the question is how close price may get to the line. Also, the potentially significant 200-day moving average shows possible resistance around $3.43. It is close to the beginning of the falling wedge at $3.49, that triggered three weeks ago.
Weekly Close Risk Signals Pattern Resolution
Of concern is the potential for a bearish shooting star candlestick pattern to end the week. It is present on Thursday, but if strength returns before Friday’s close, the pattern may change character.
If you’d like to know more about how to trade natural gas, please visit our educational area.