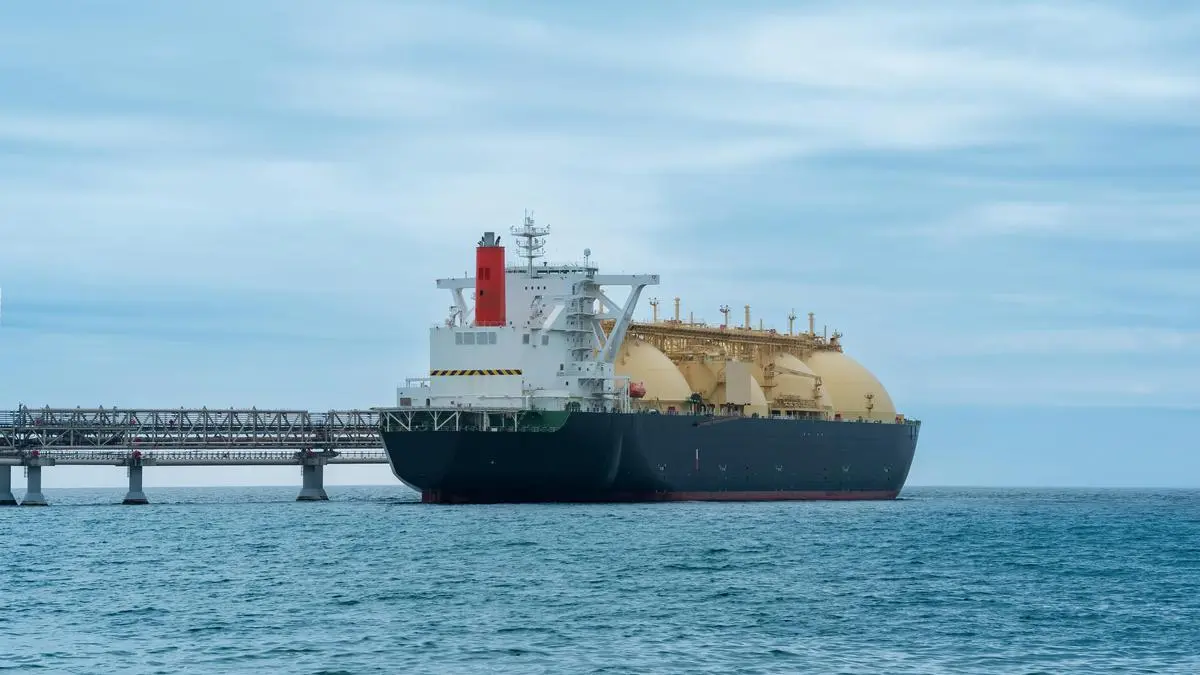
Support Zones Under Pressure
Near-term support is around the current low of $2.98, supported by the nearby 50% retracement at $2.98 and the 50-day moving average, now near $2.97. Lower potential targets are near the 61.8% Fibonacci retracement at $2.90, followed by the 78.6% Fibonacci retracement at $2.79. There is also the initial breakout level for a falling bullish wedge that triggered at the end of April. That price level is around $2.85.
Rejection From Higher-Timeframe Resistance
Last week’s lower swing high of $3.31 may have completed the pullback to test prior dynamic support as resistance. Once the 78.6% Fibonacci retracement was reached in a near-direct move, sellers quickly regained control, as the prior day’s low failed shortly afterward, reinforcing downside momentum. Resistance near the high was further validated by the 100-week moving average near $3.33. The subsequent bearish reaction confirms a successful retest of that former support level as resistance.
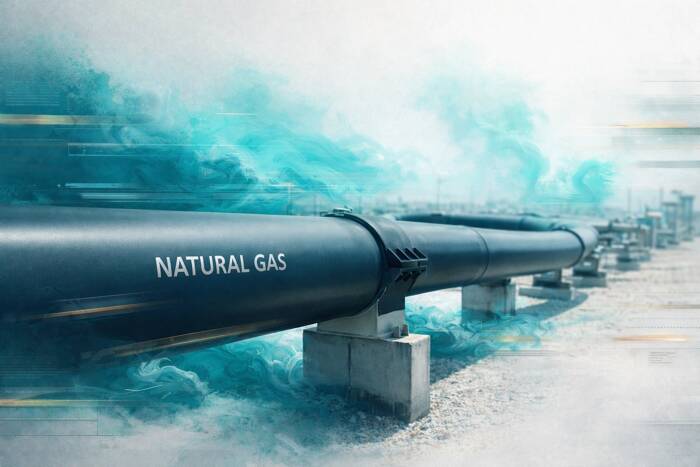
If you’d like to know more about how to trade natural gas, please visit our educational area.