200-Day Cluster Still Overhead
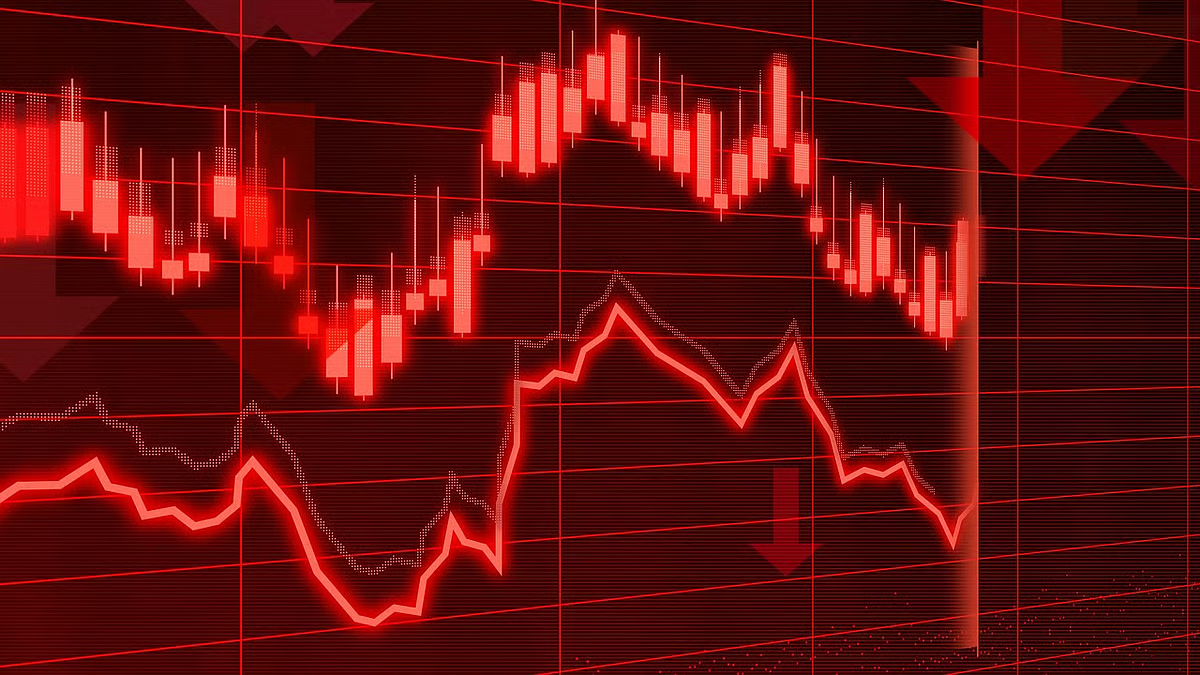
The answer to that question is that the resistance zone may be significant, since it is highlighted by three indicators. There is a prior lower swing high at $71.56, a 50% retracement of a prior downswing at $72.08, and the 200-day moving average near $72.44 and rising. Either the area around the 200-day moving average can be further tested before support at the 20-day moving average fails, or further signs of strength may follow Monday’s low, generating a higher swing low and another leg up in the uptrend.
Traders will watch price action around Monday’s low and the 20-day moving average for confirmation of the next swing. In that way, the test of the 20-day moving average that opened this week also closes the near-term question: whether the advance that began from the mid-July low remains intact.