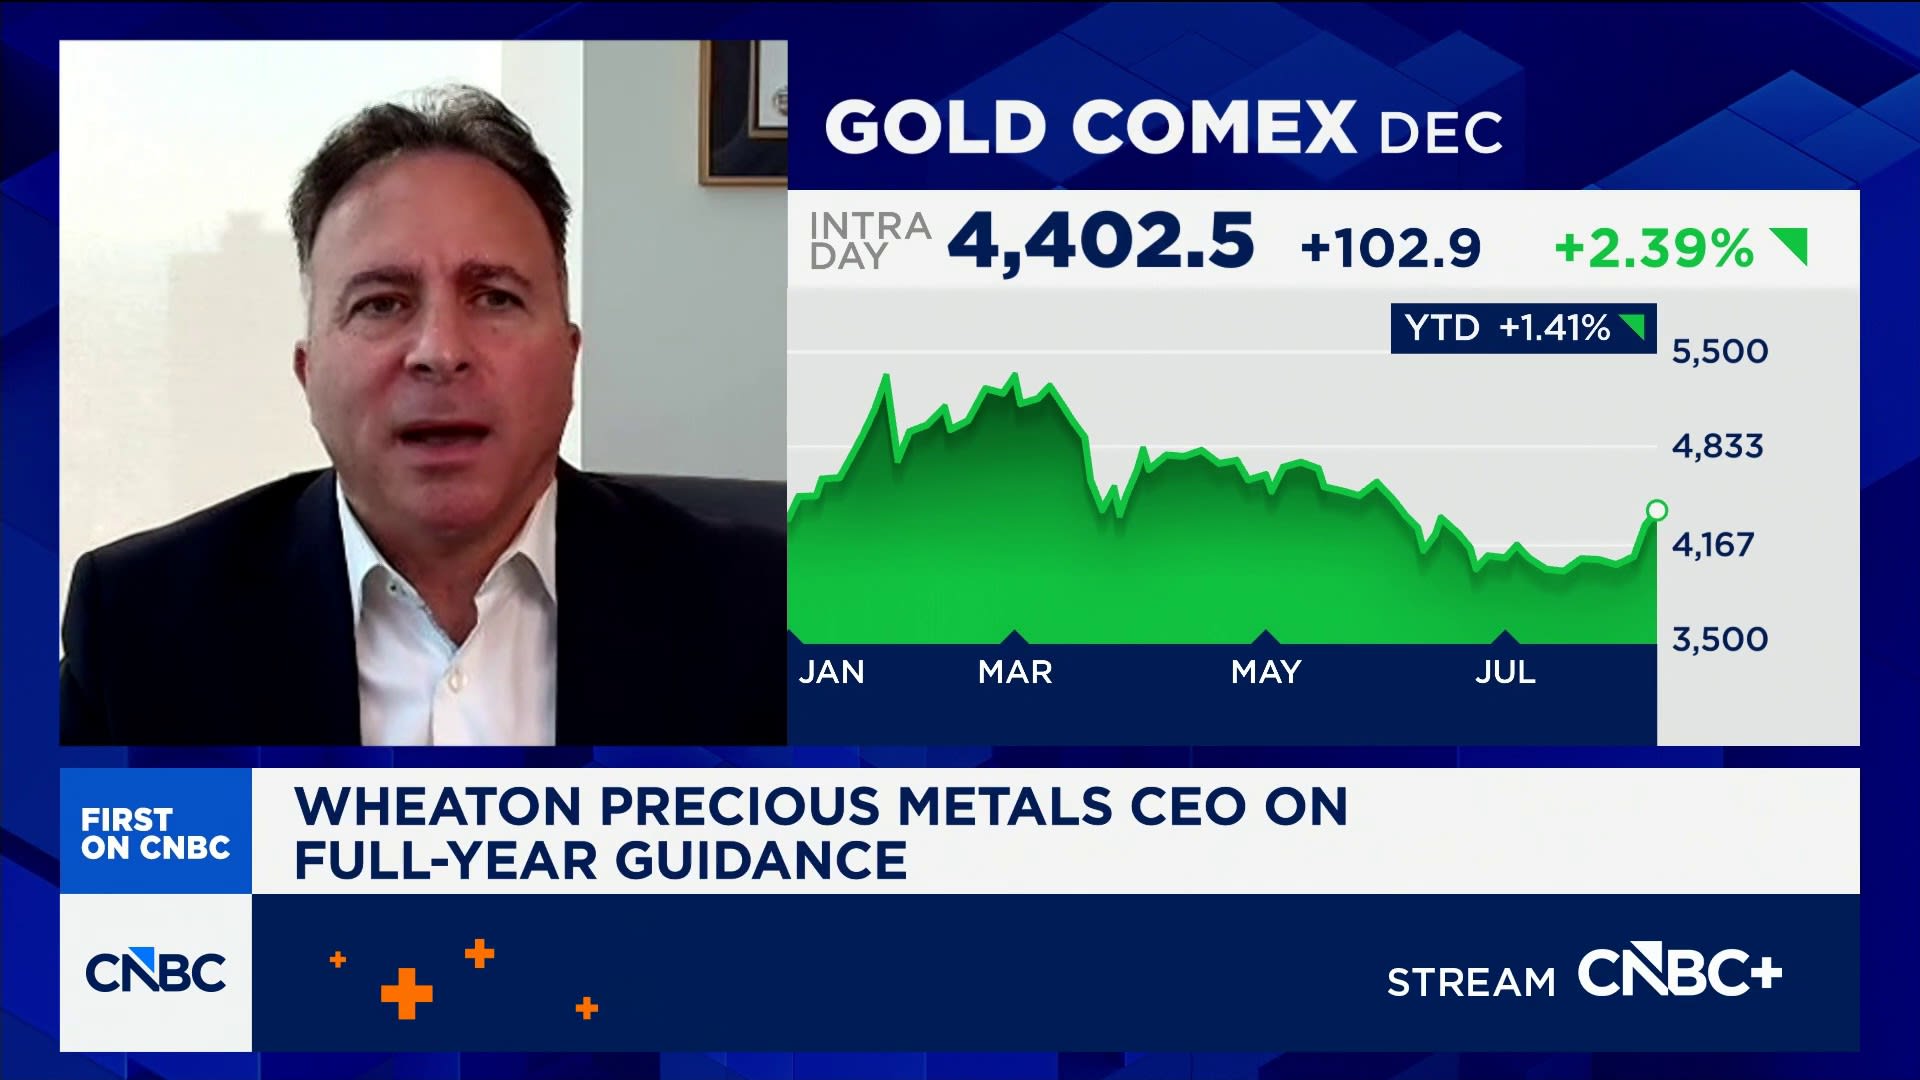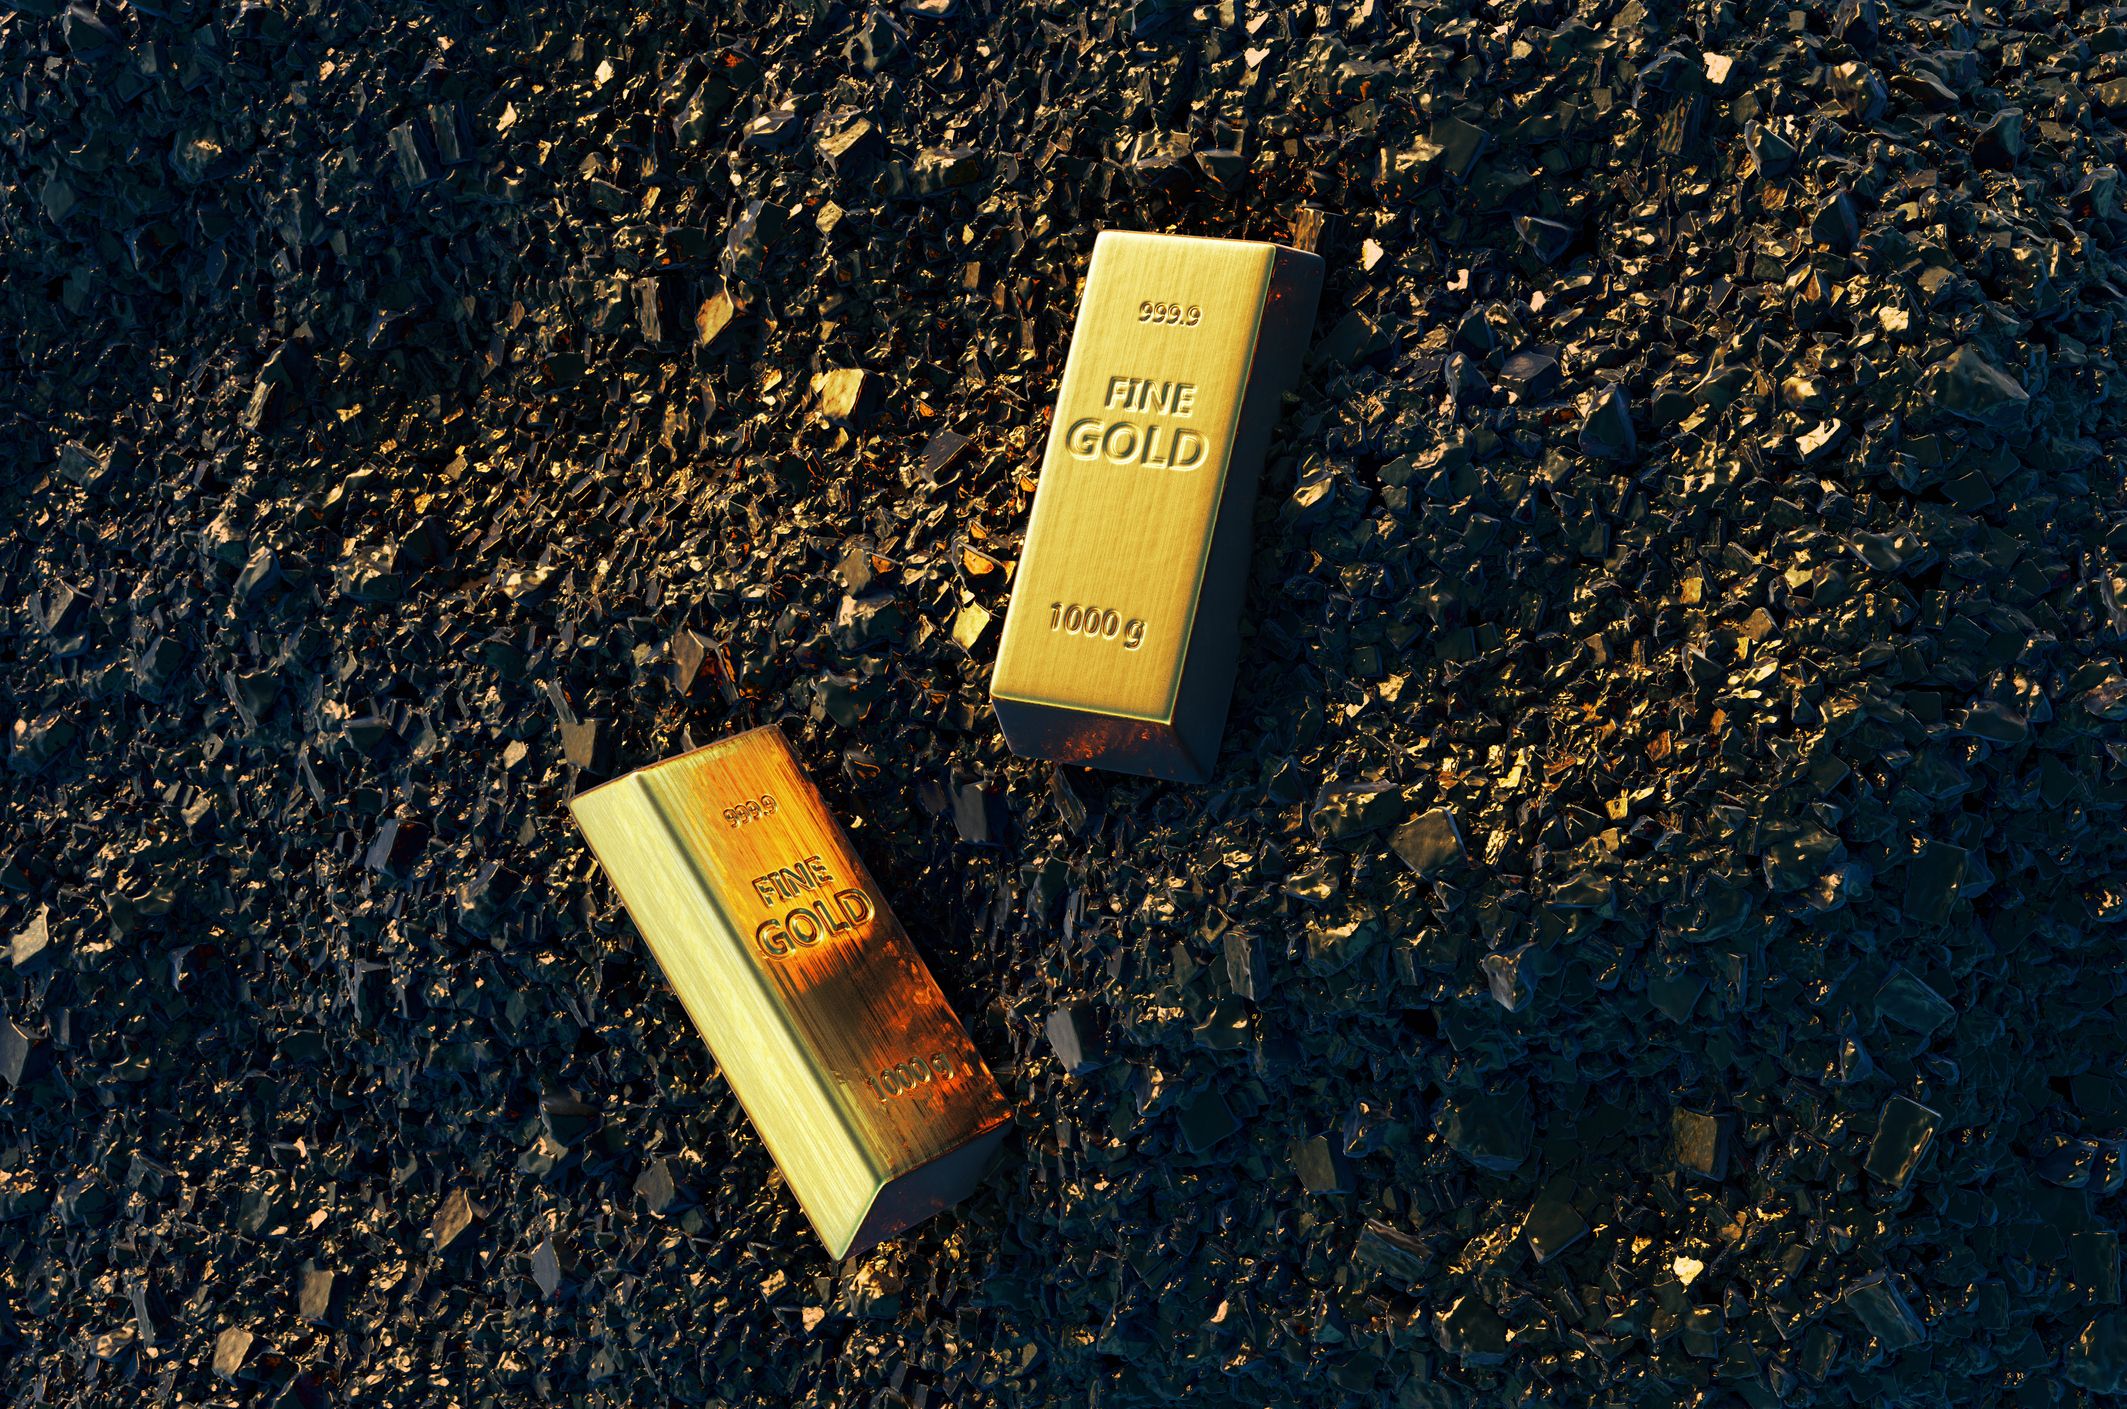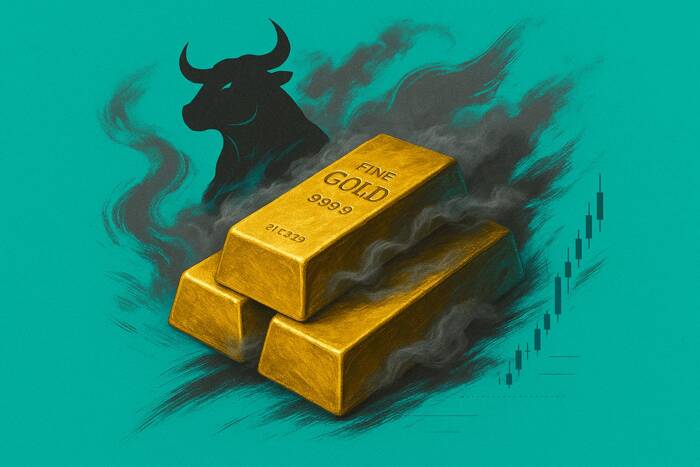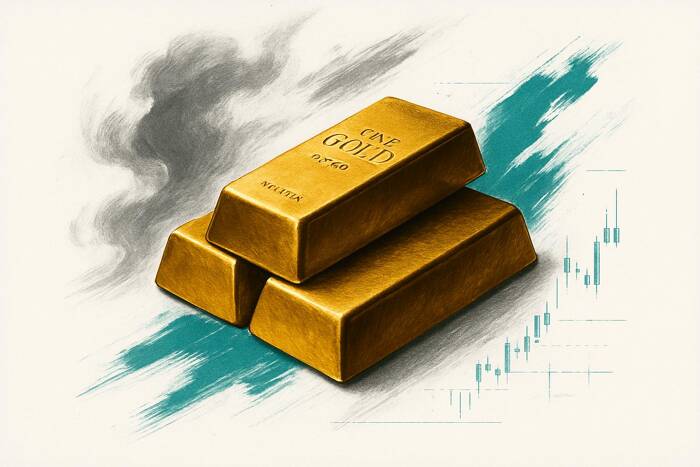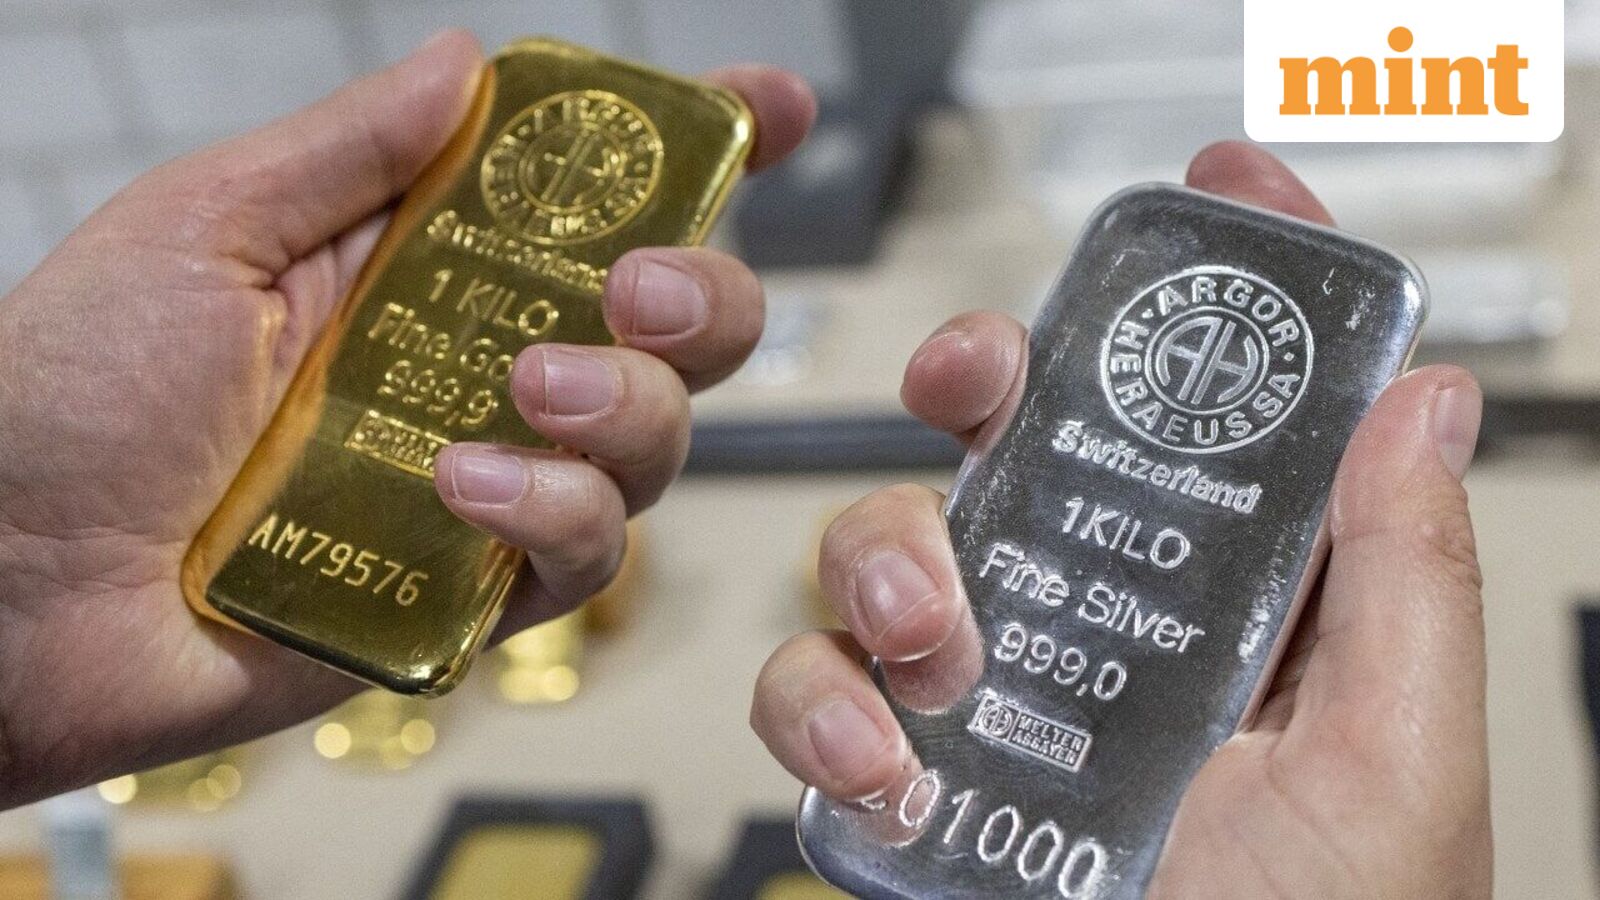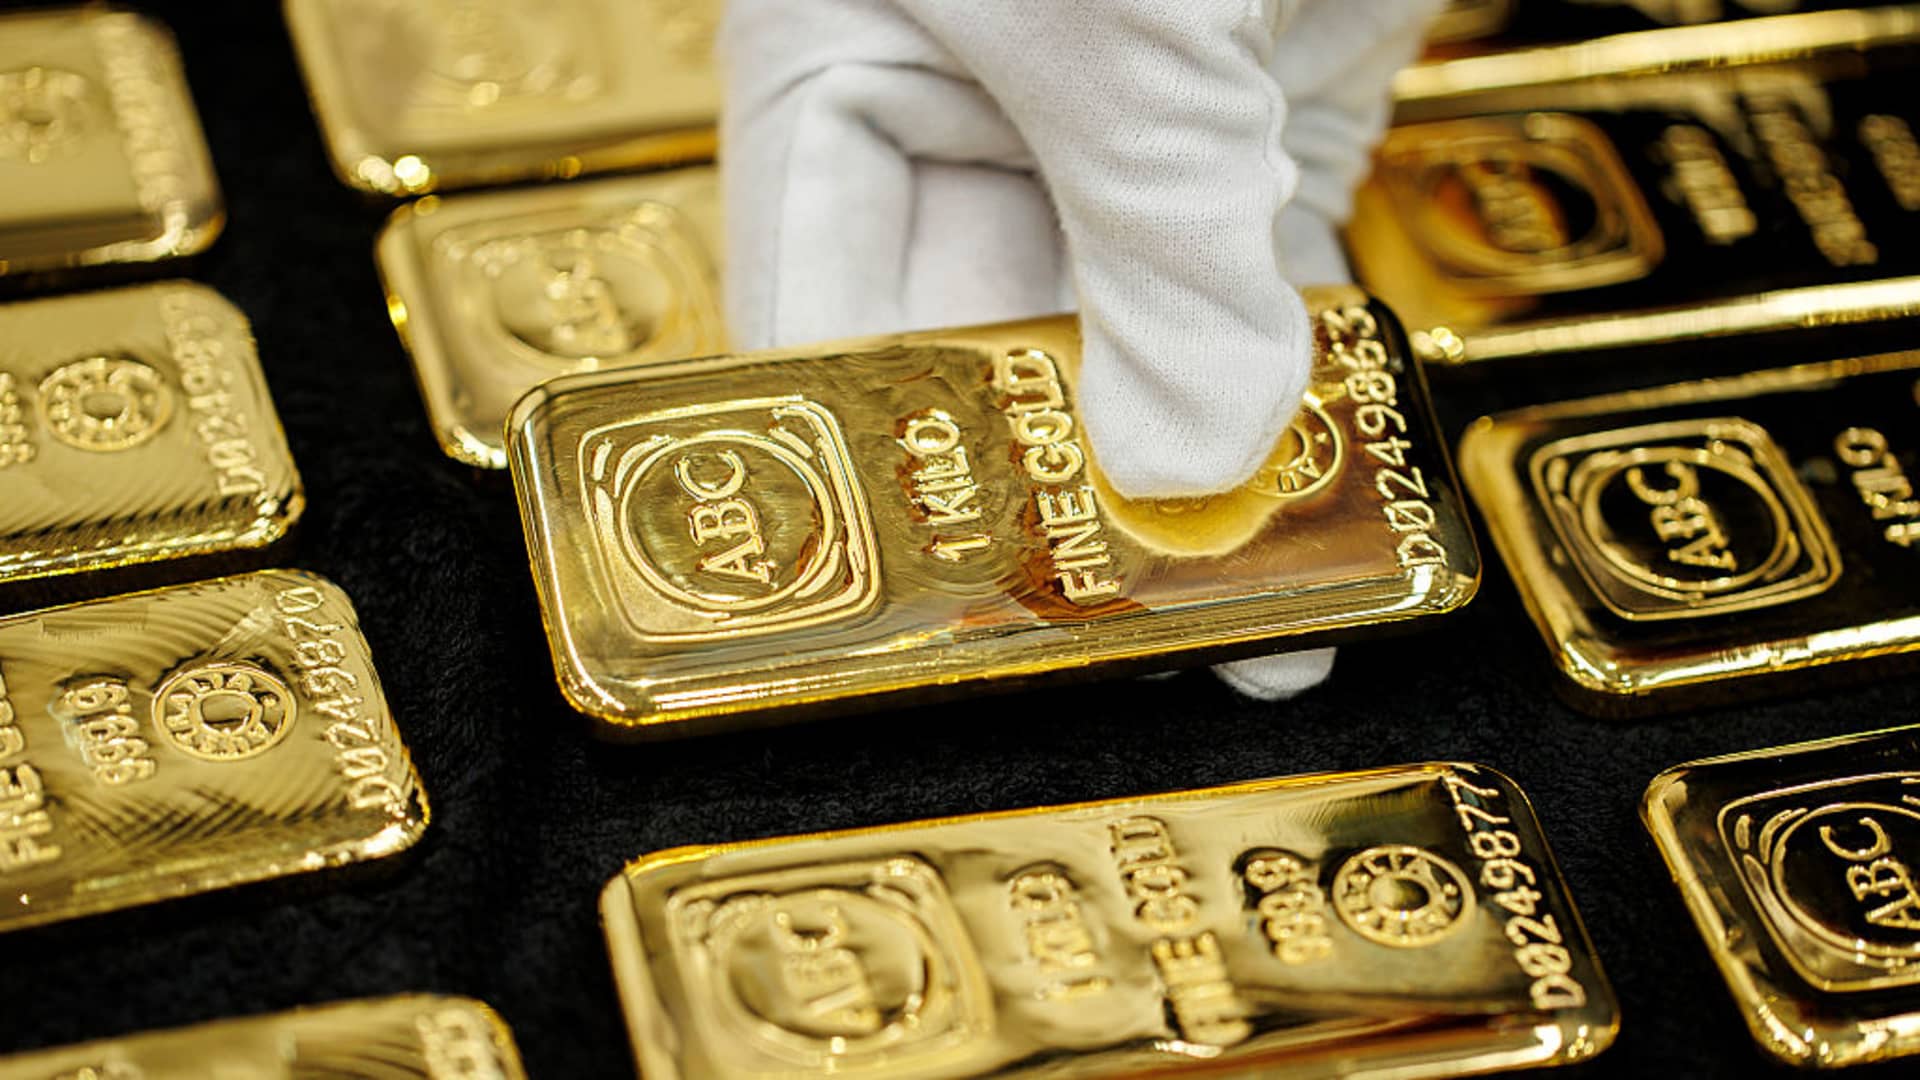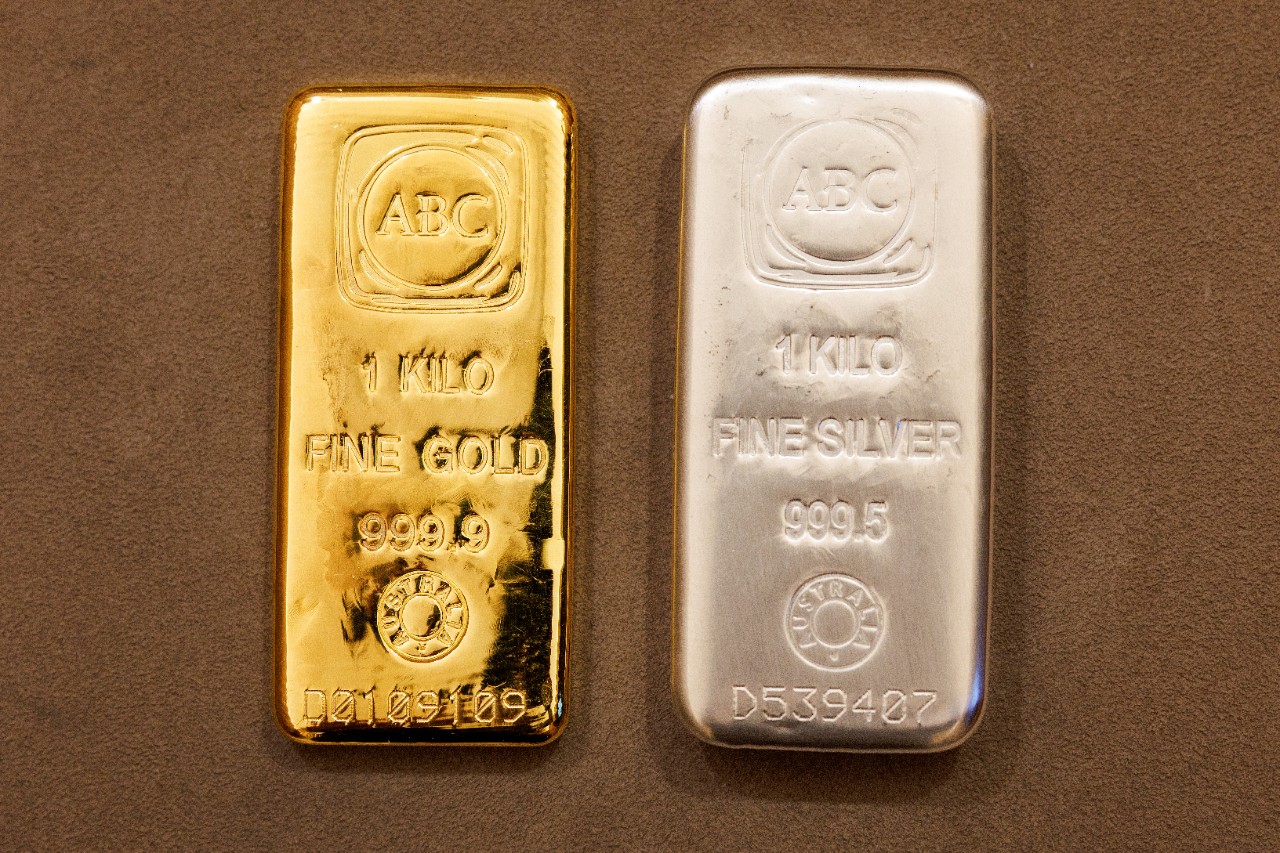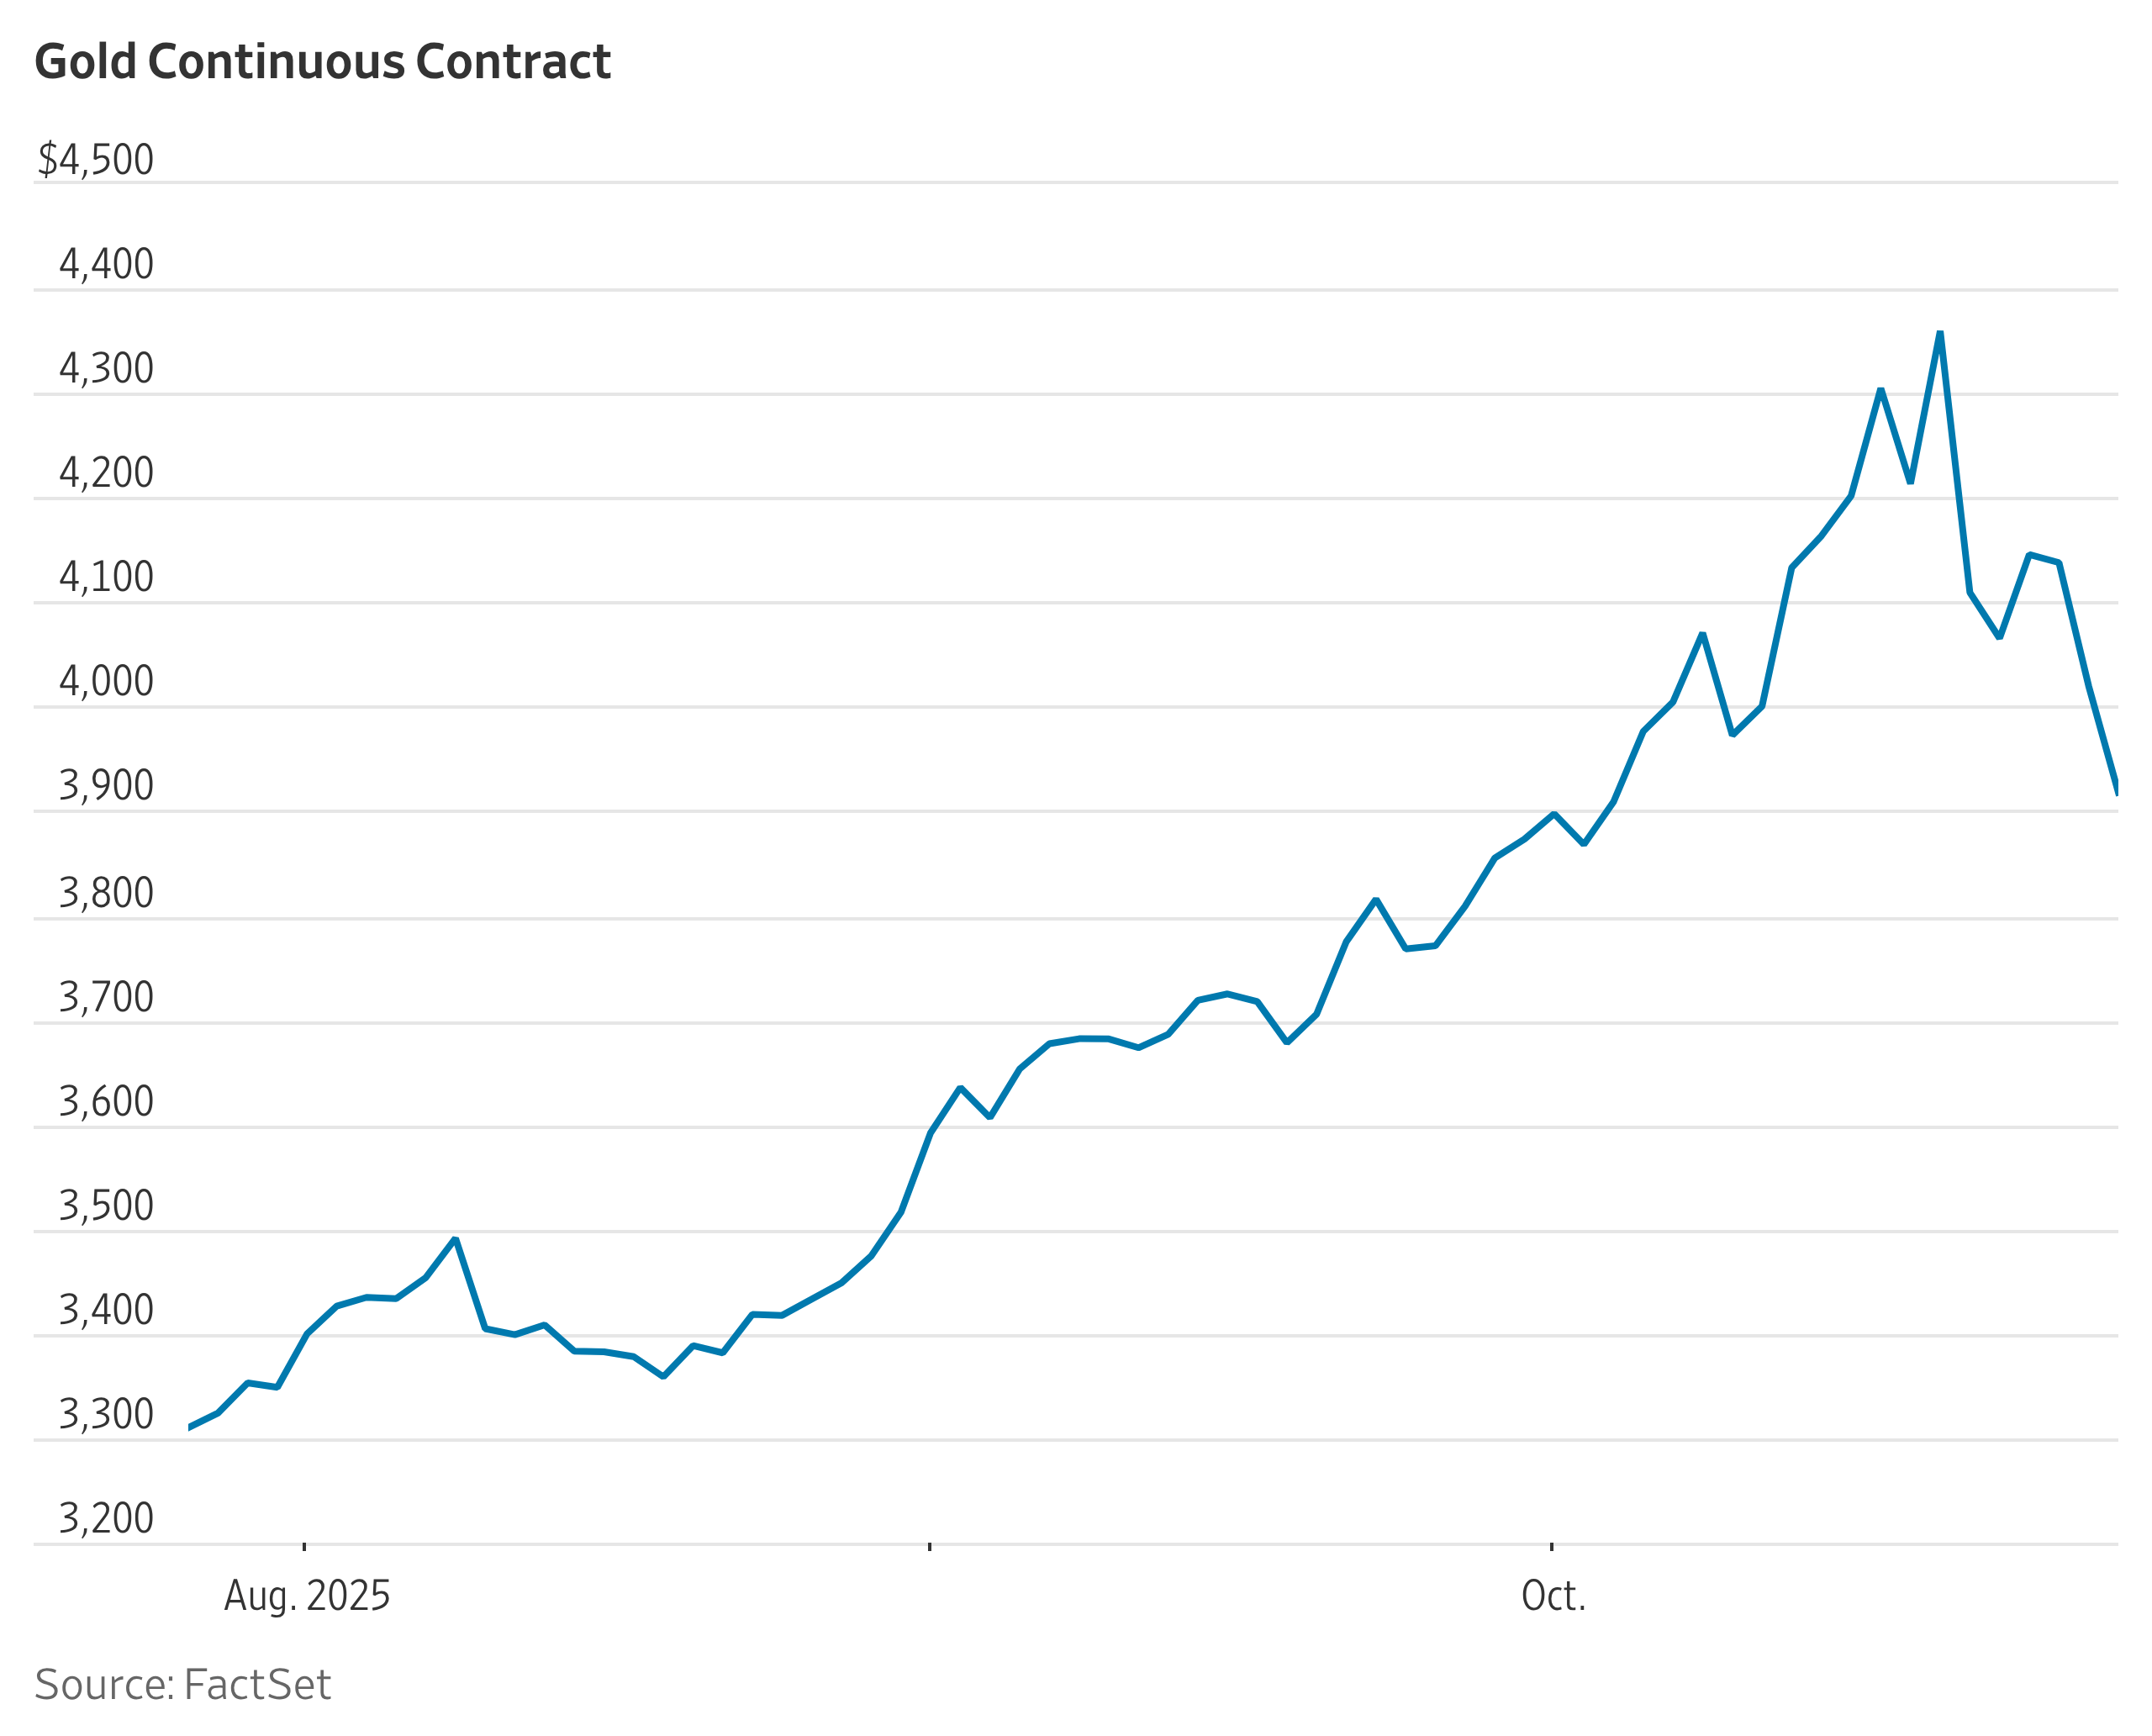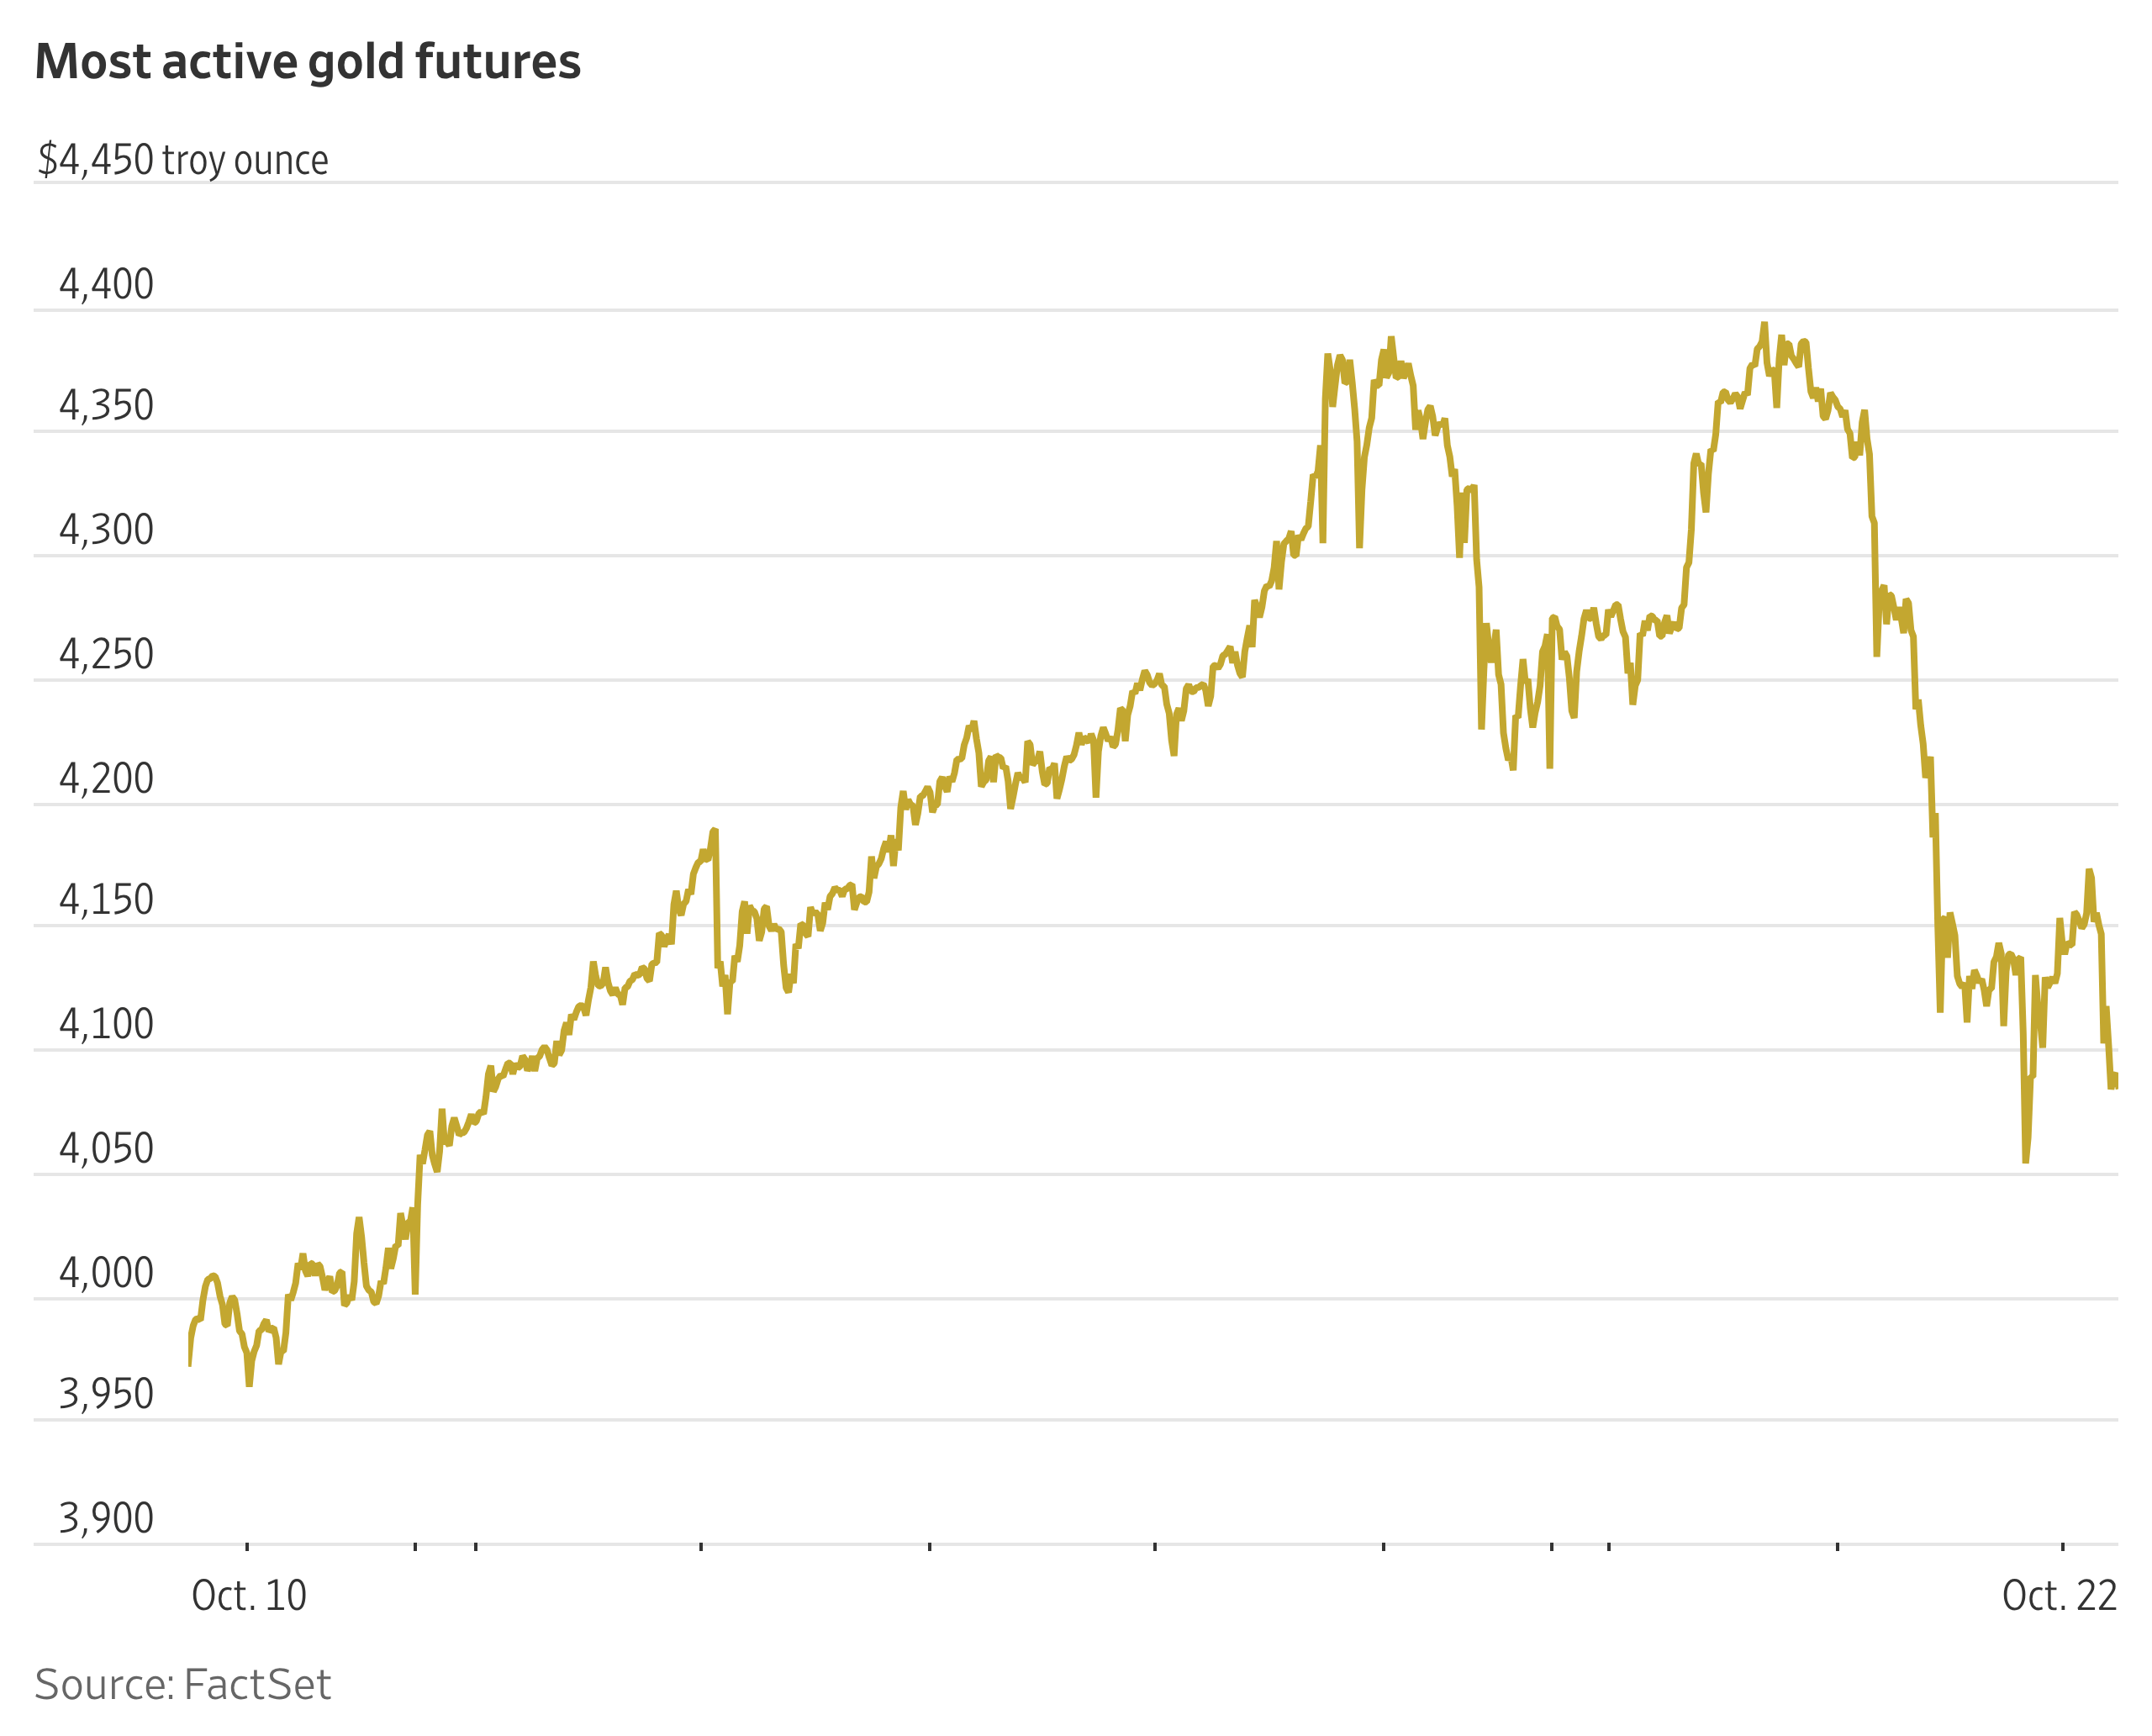

A break above the $5,000 area will open the door for a strong surge in the gold market towards record highs.
The 4-hour chart for spot gold also shows constructive price action as the consolidation in June and July has formed a rounding bottom pattern. But this bottom pattern will only be confirmed when the price produces a confirmed break above the $5,000 area.
However, the breakout from the descending trend line that stretches from the March 2026 highs indicates that the short term momentum has shifted to the upside.