The medium-term mechanism works in the opposite direction, and this is where the stagflation analysis becomes directly applicable.
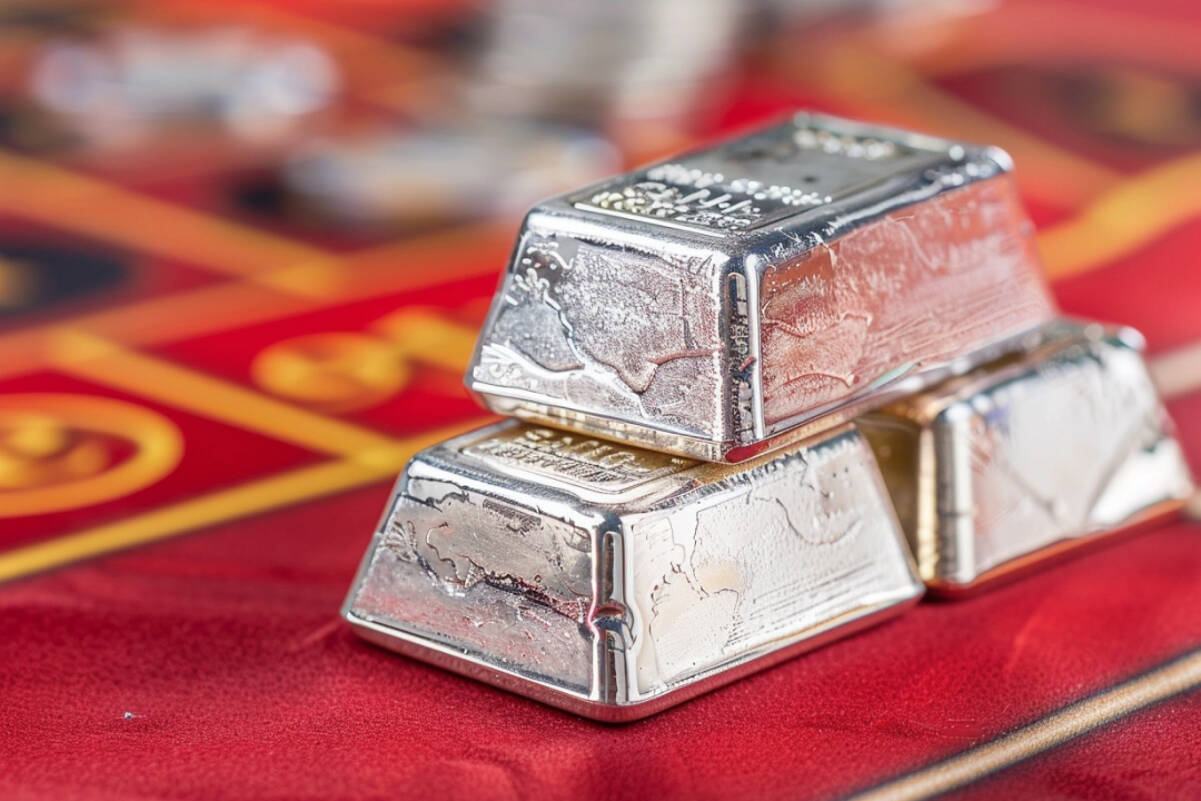
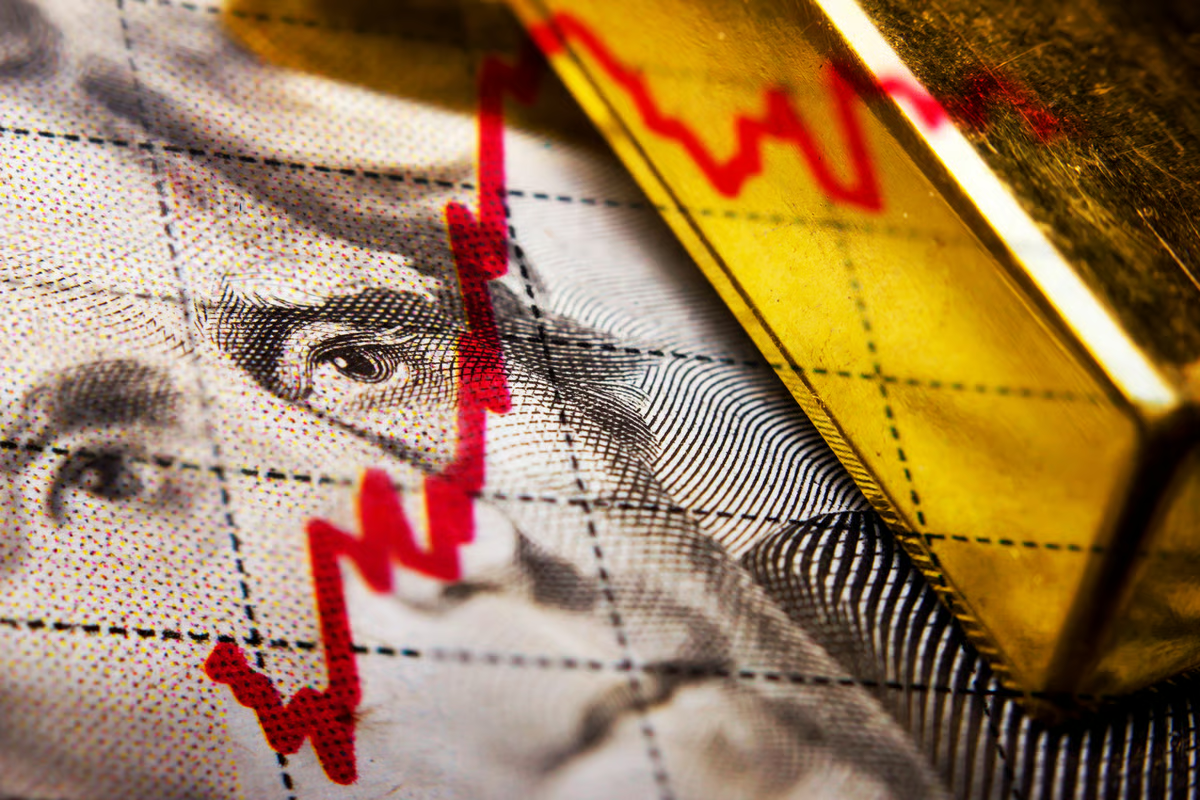
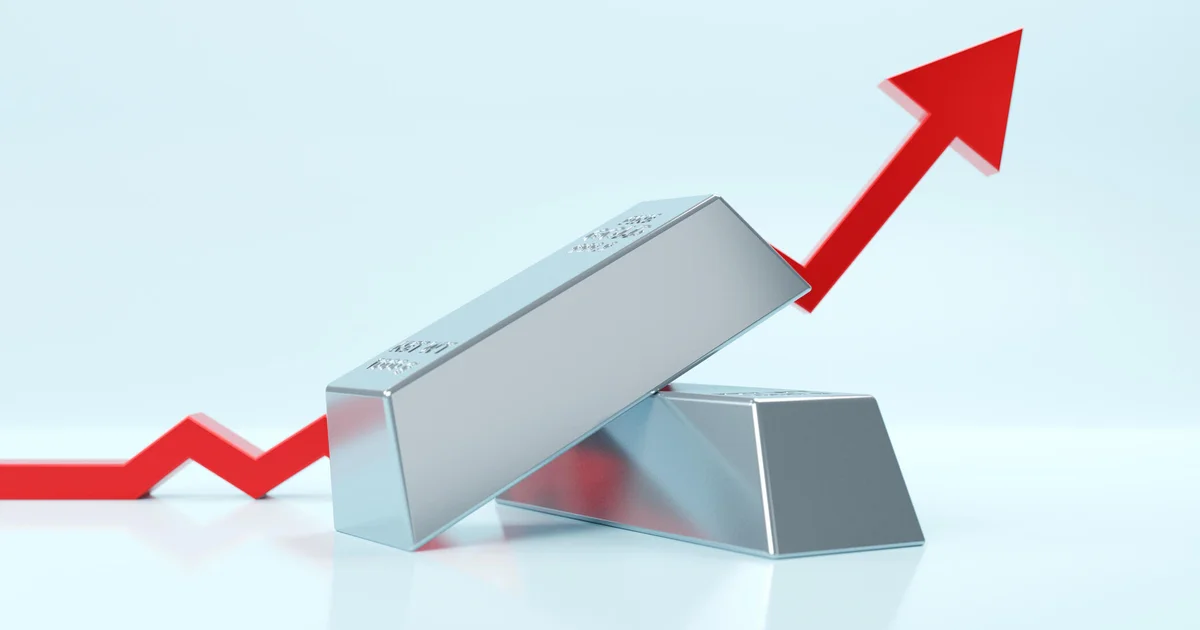
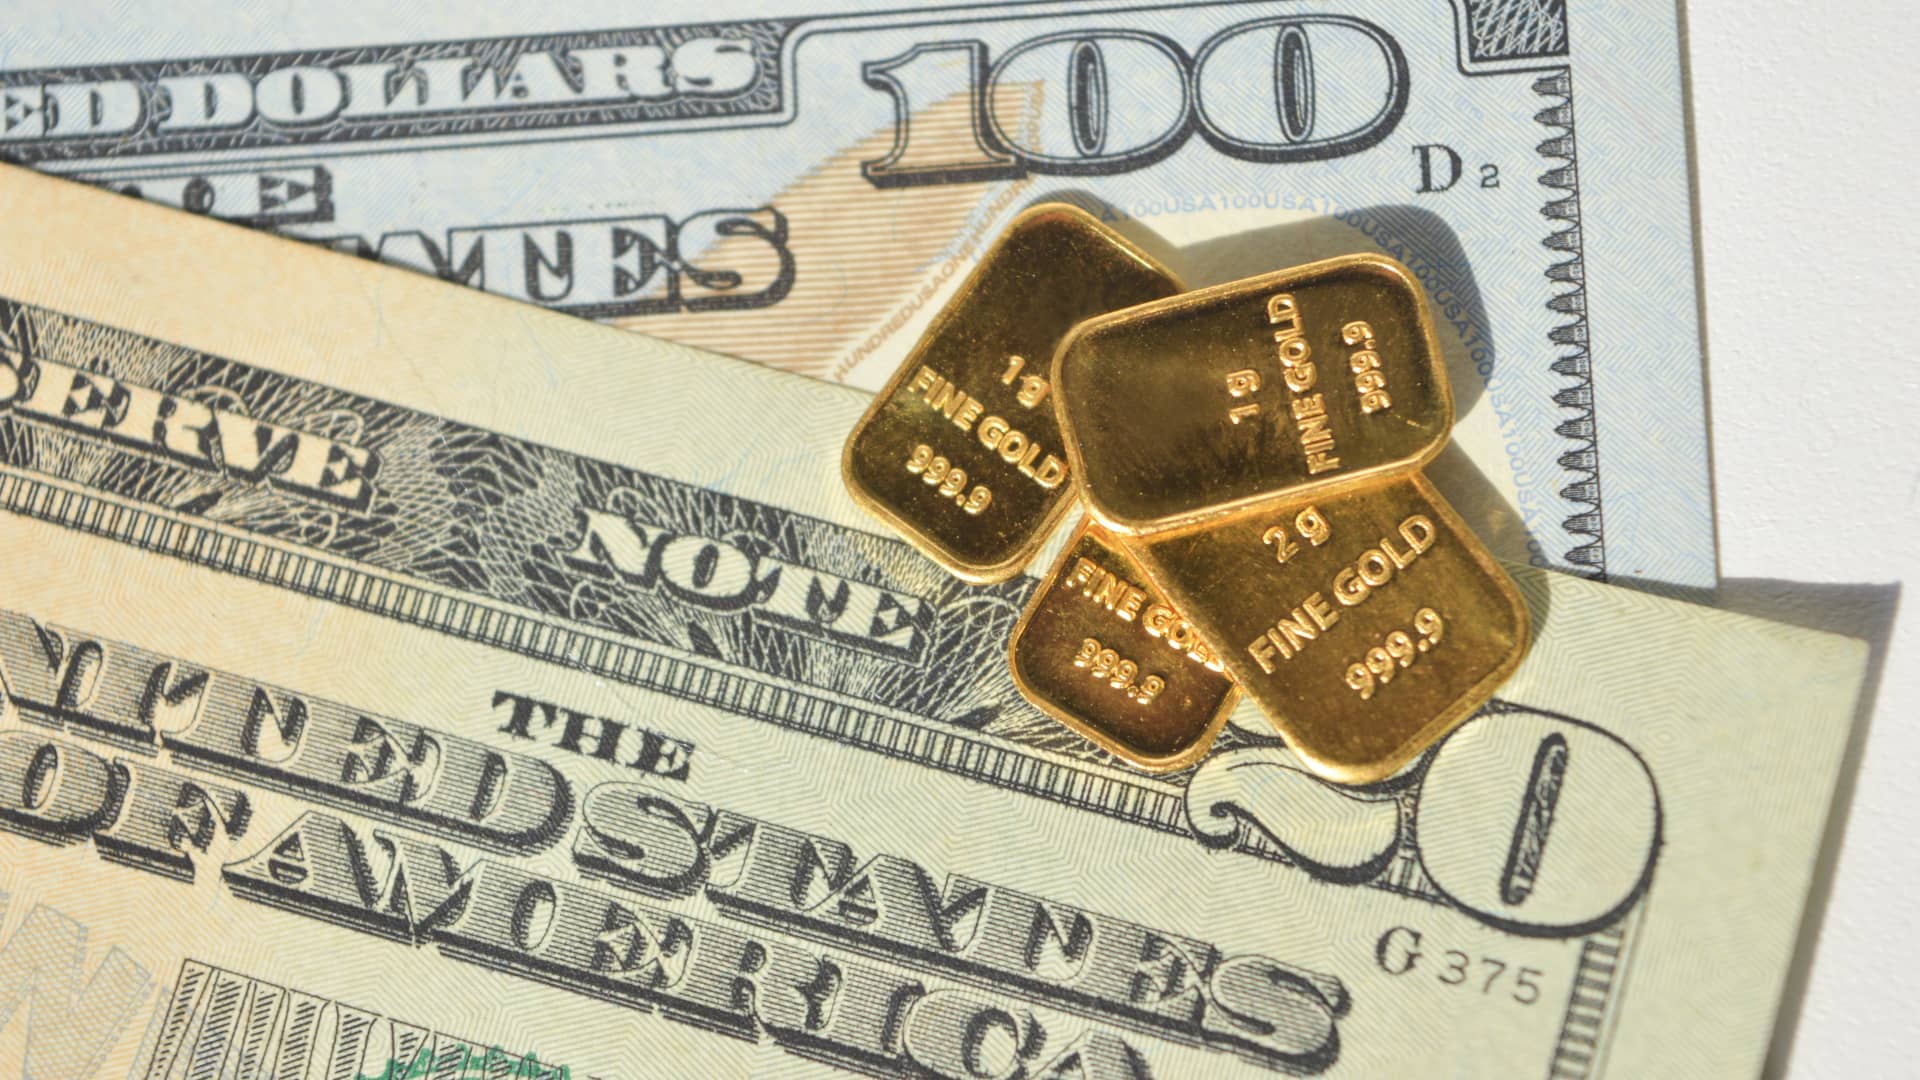
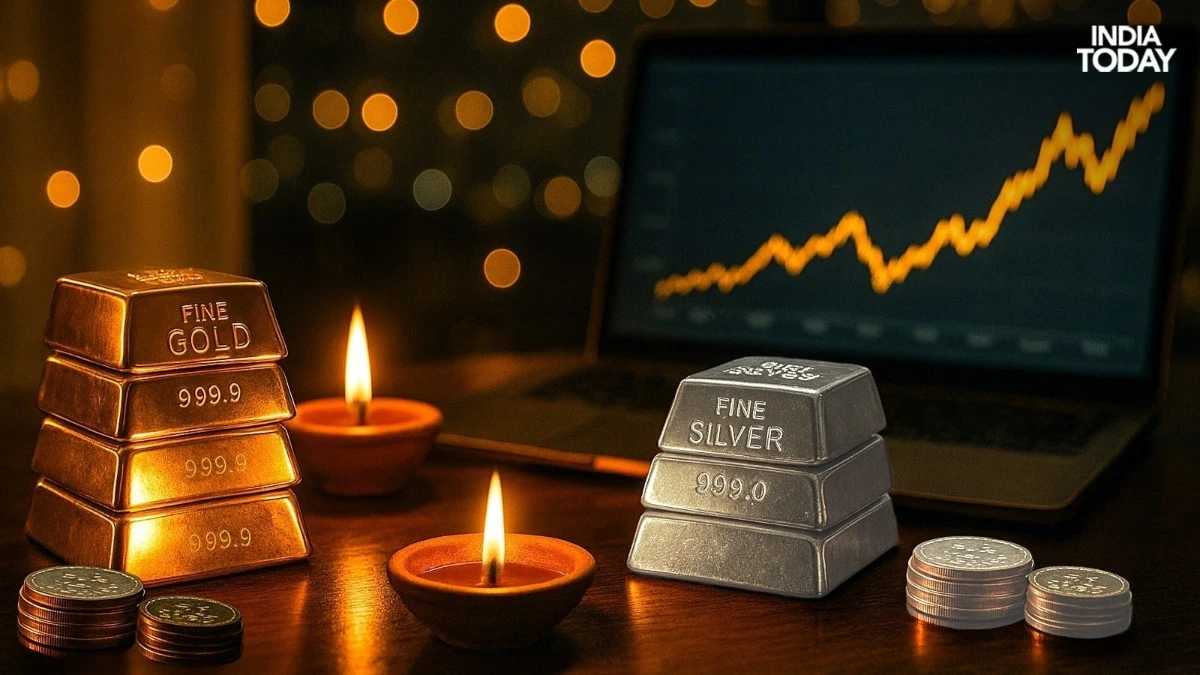
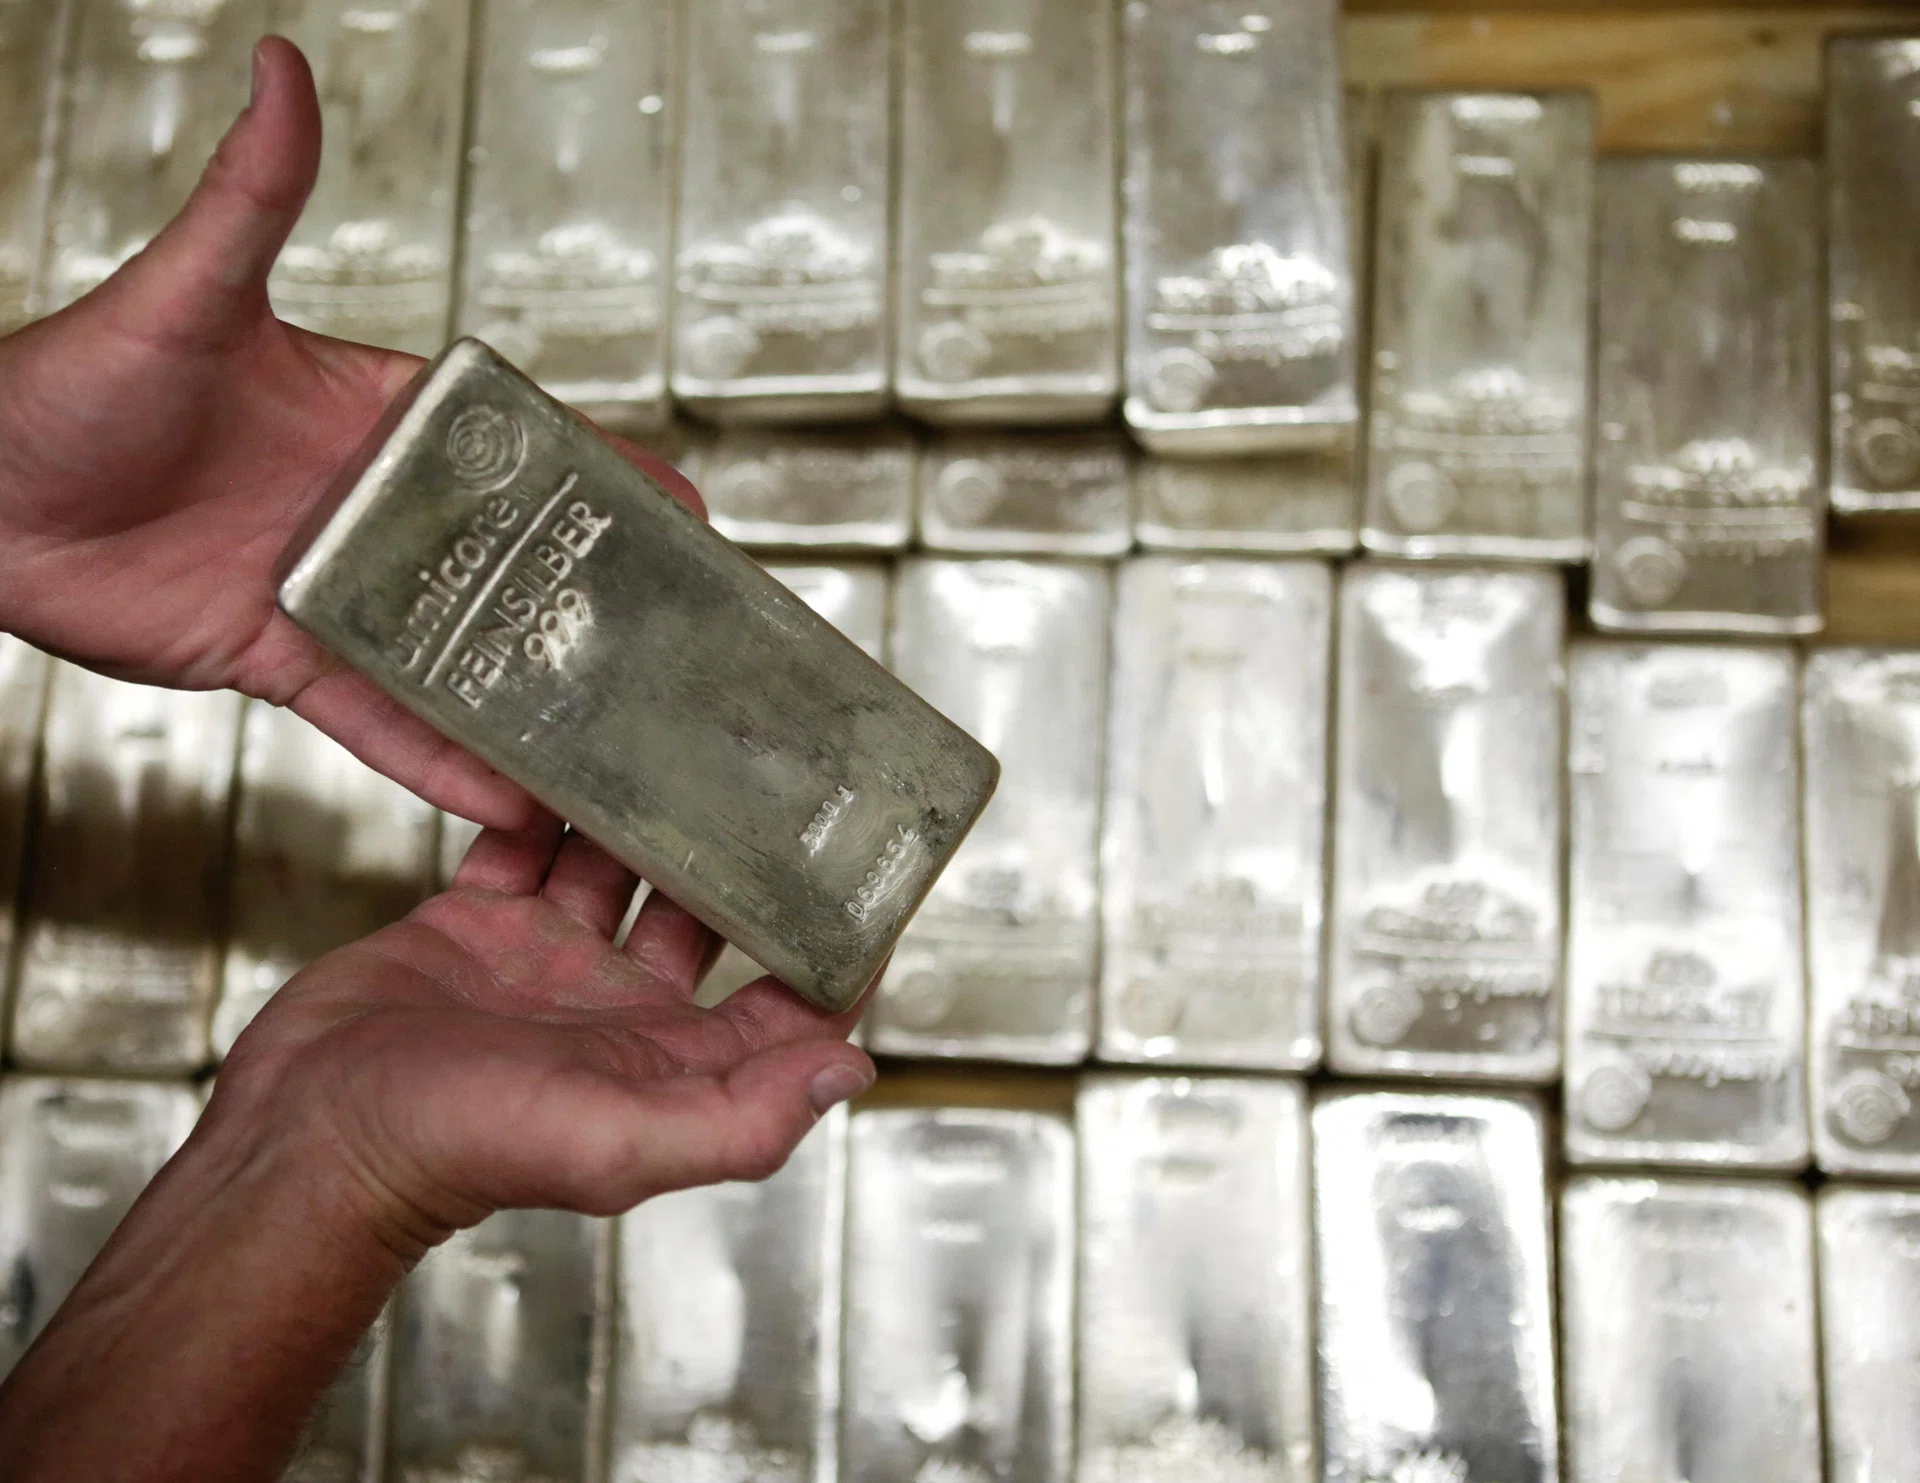
When cash earns 3.5% in interest and inflation is running at 3.3%, investors holding cash are barely breaking even in real terms. The difference between the nominal rate and the inflation rate — the real interest rate — is essentially zero. As inflation persists above the level the Fed is willing or able to fight, that real rate turns negative. Negative real rates are, historically, one of the most reliable drivers of precious metals demand, because the opportunity cost of holding silver or gold versus cash disappears.
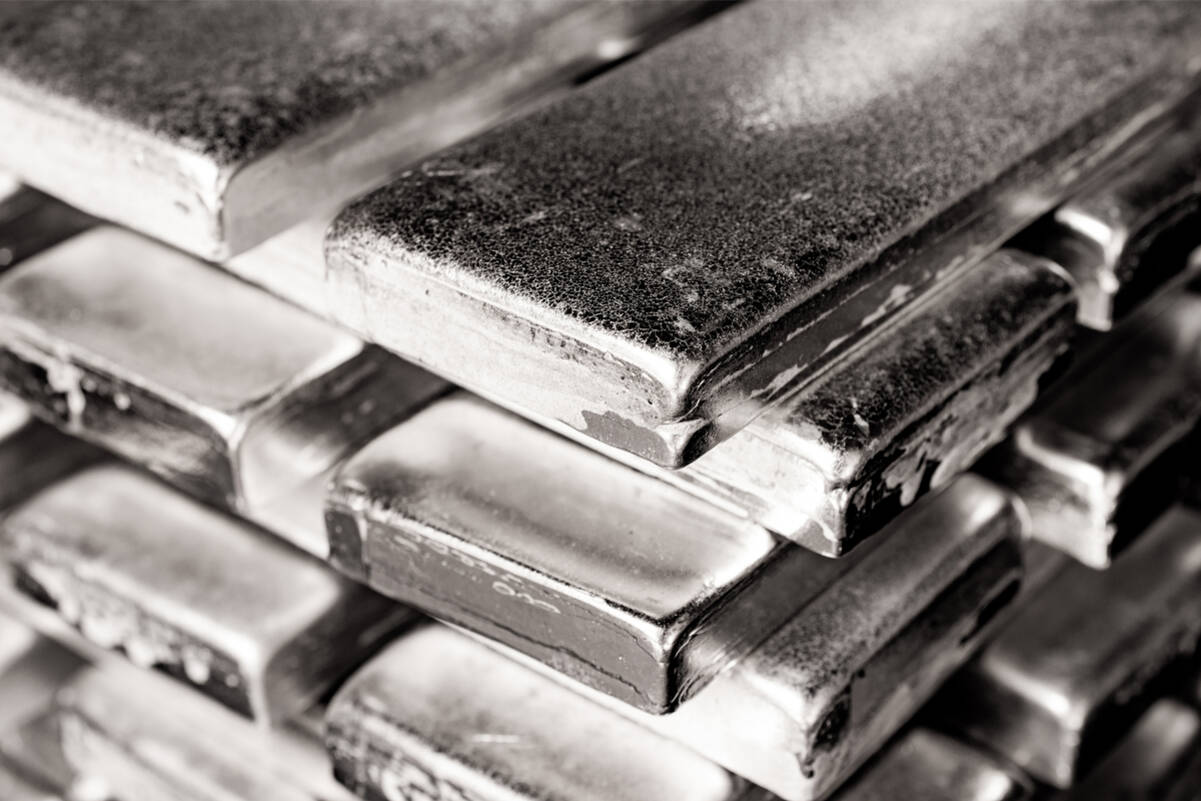
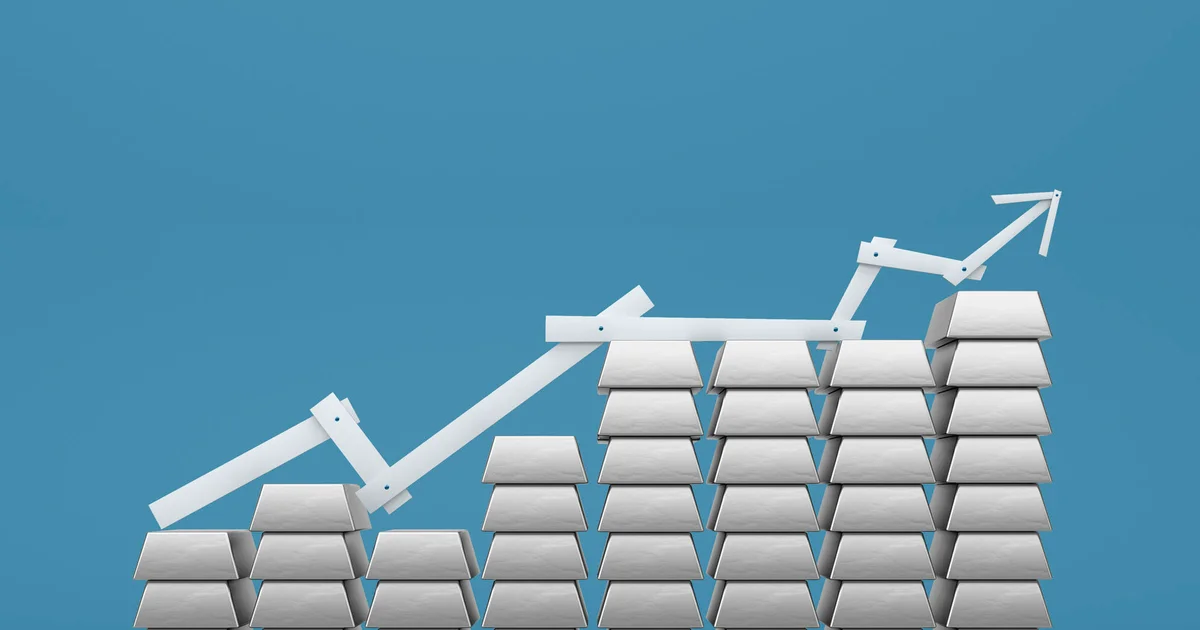
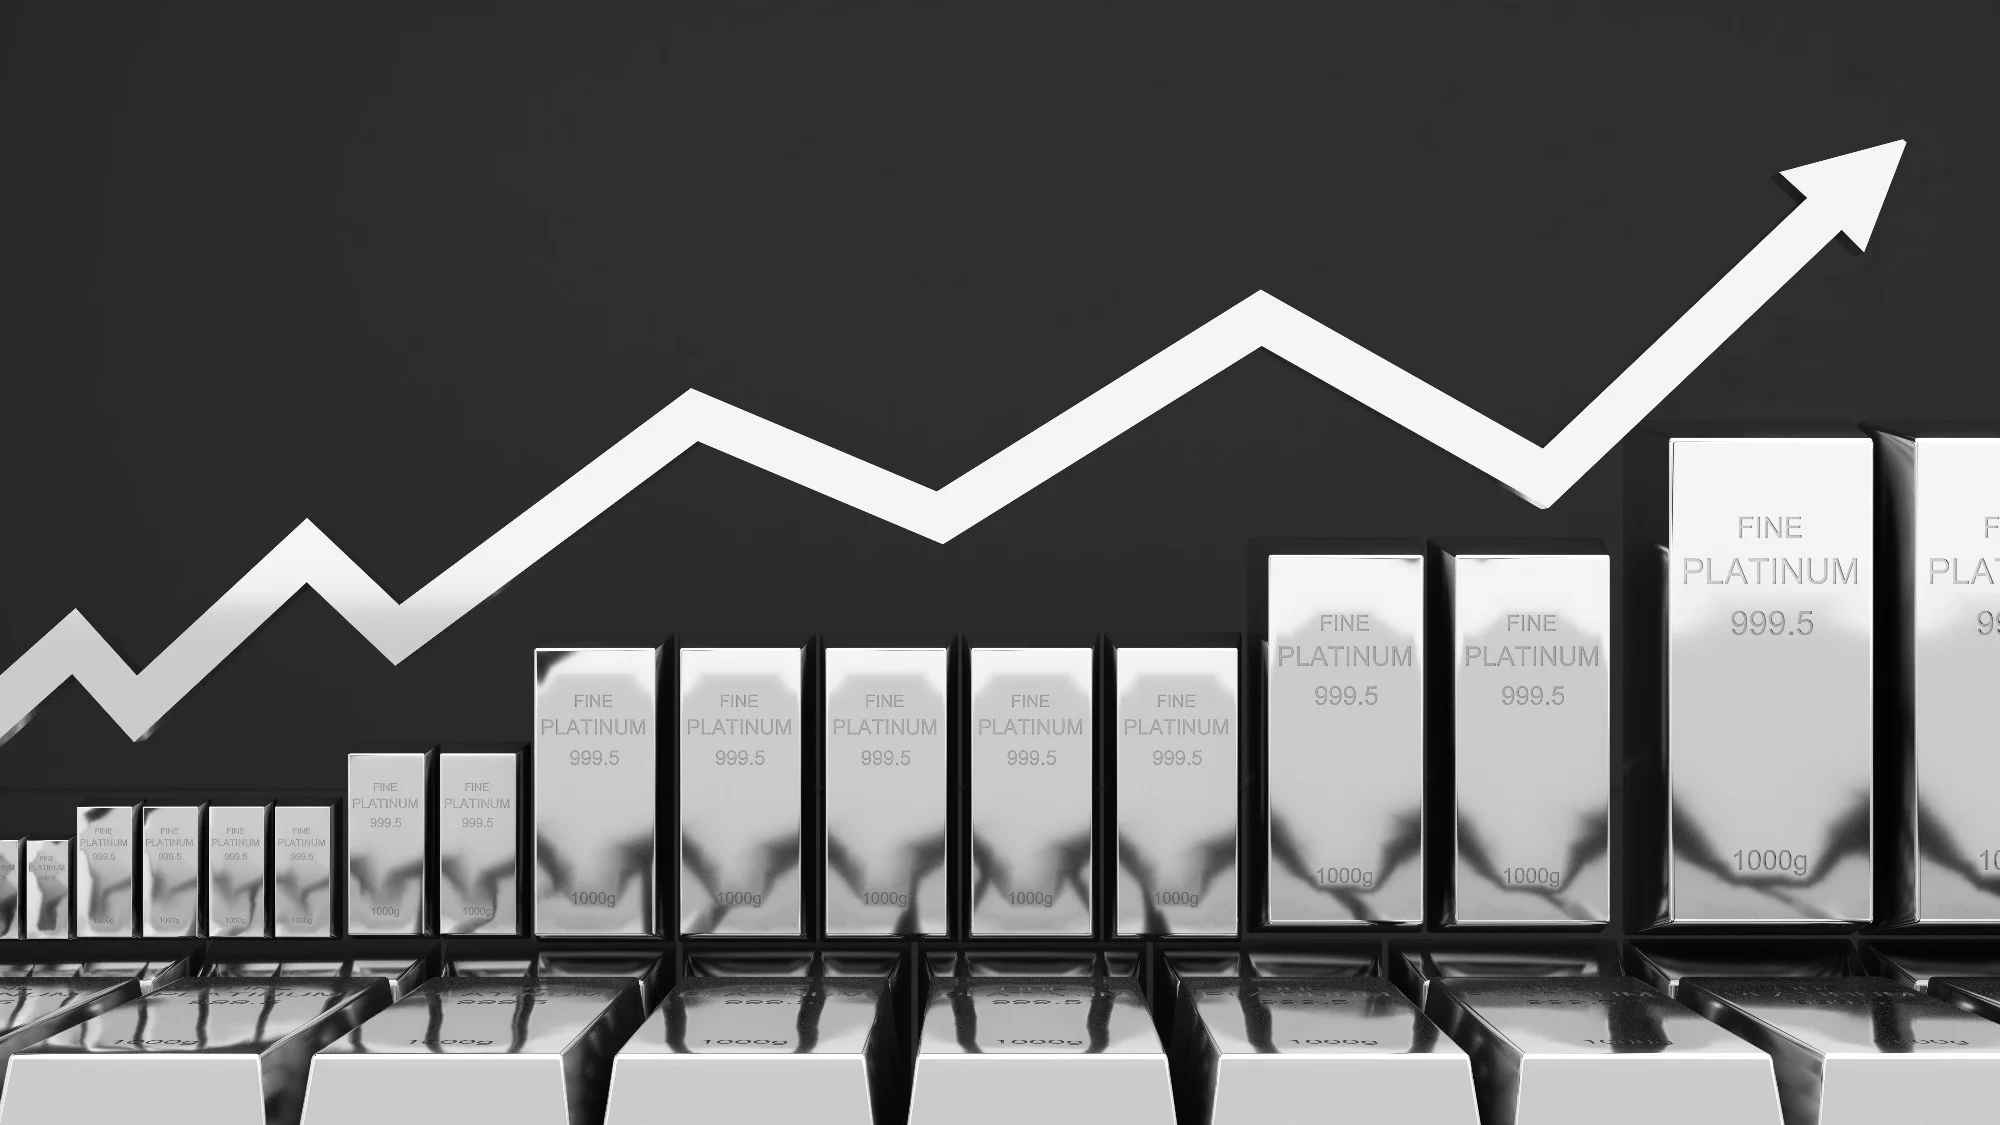
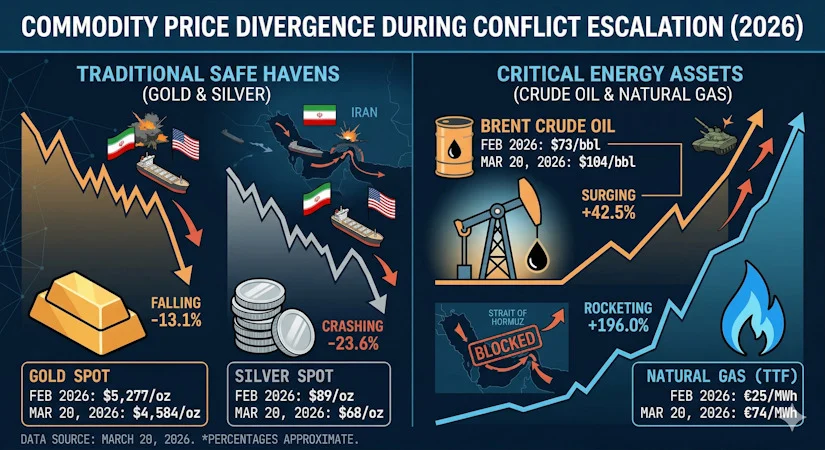
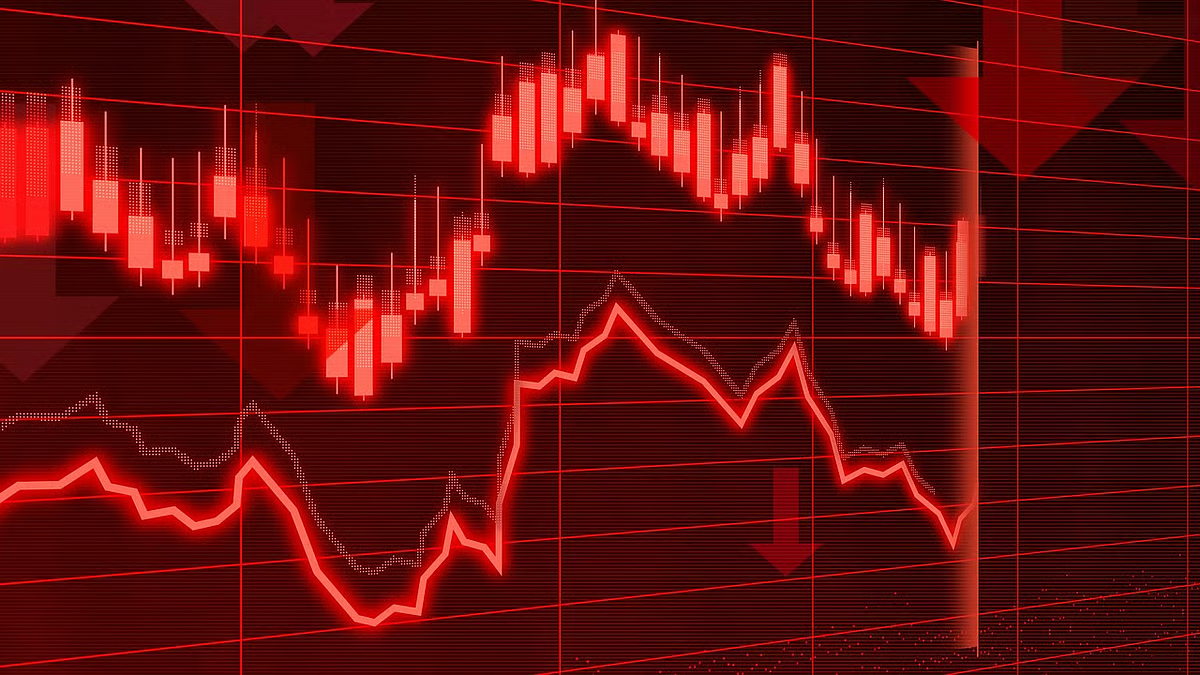
Per State Street’s April 2026 Gold Monitor, a 50bps decline in real interest rates has historically translated to approximately 20–40 Moz of additional ETP investment demand for silver. That demand has not arrived yet. Rates are being held, which is exactly why silver is 39% below its January high despite the stagflation thesis being confirmed in official data. The 20–40 Moz is not a current market condition. It is a stored tailwind — compressed by the rate hold, waiting for a pivot. The longer rates are held while inflation persists, the more compressed that spring becomes.
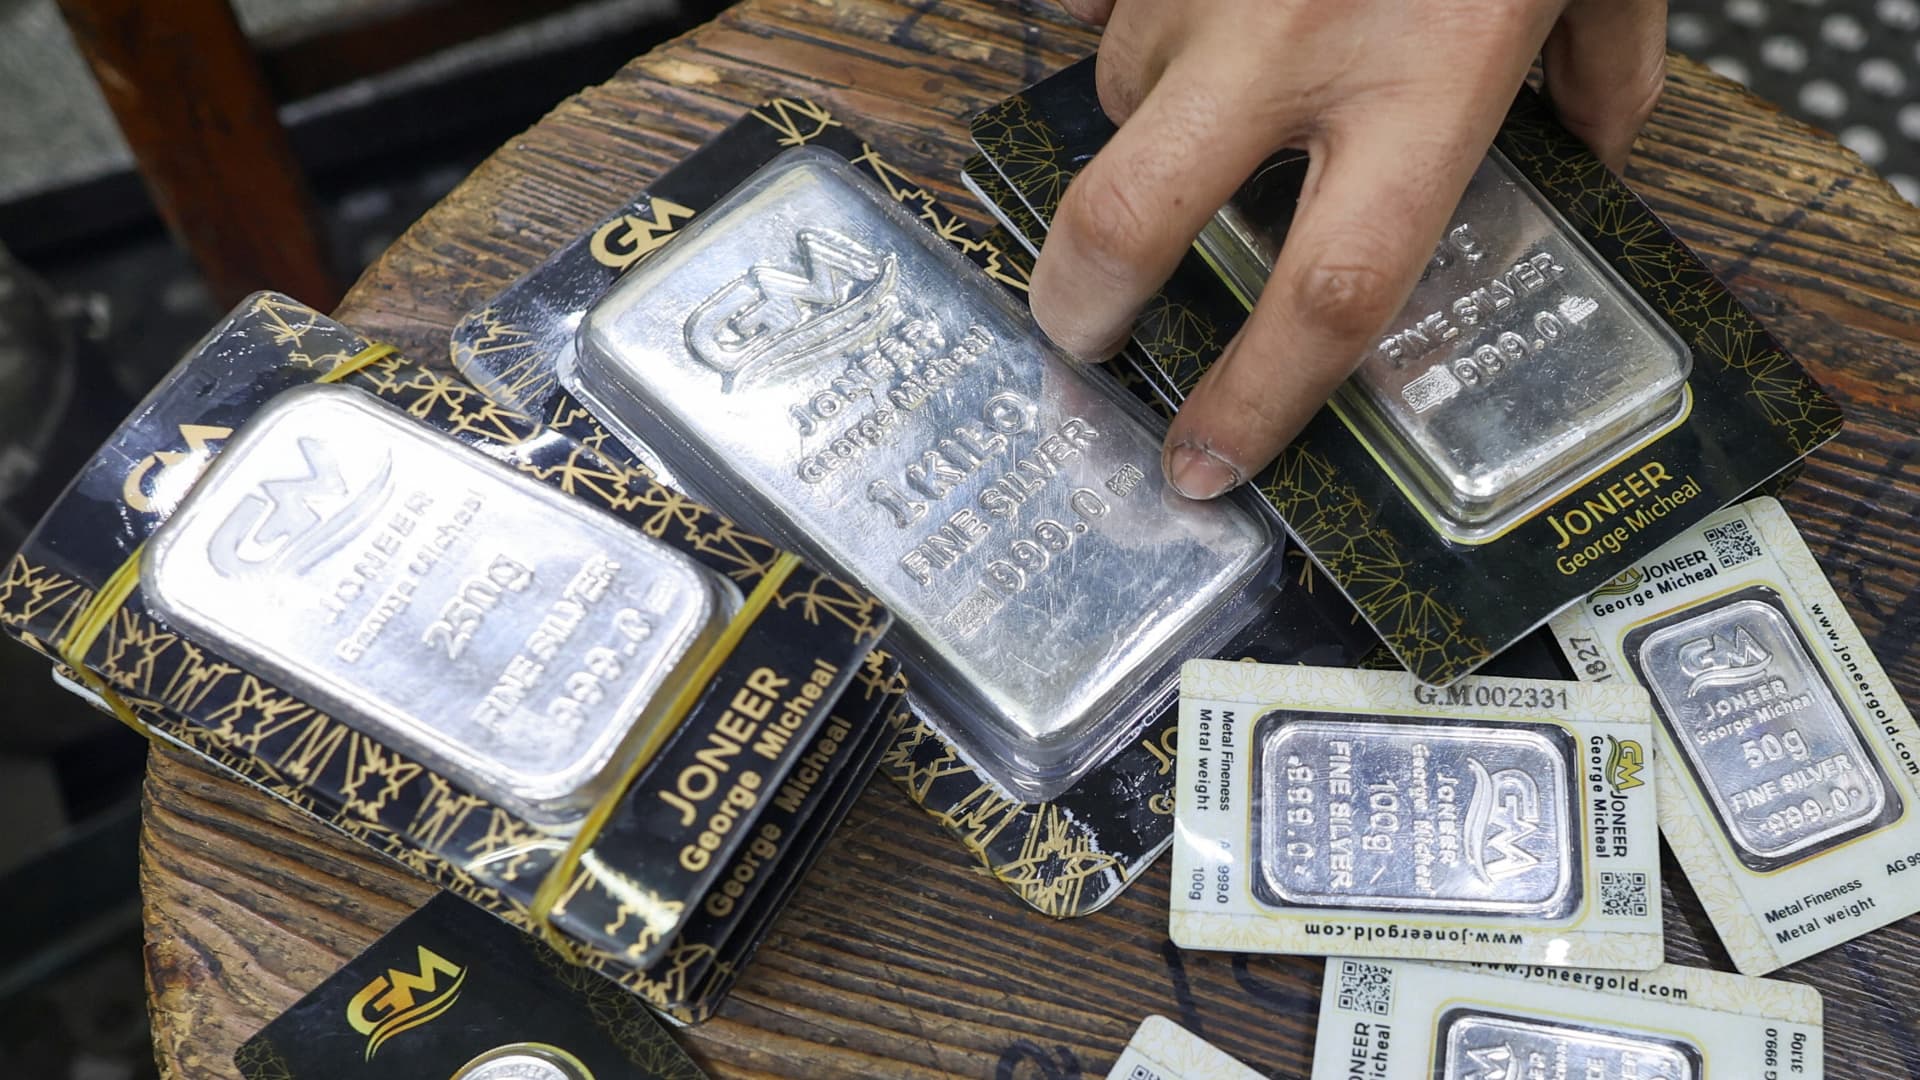
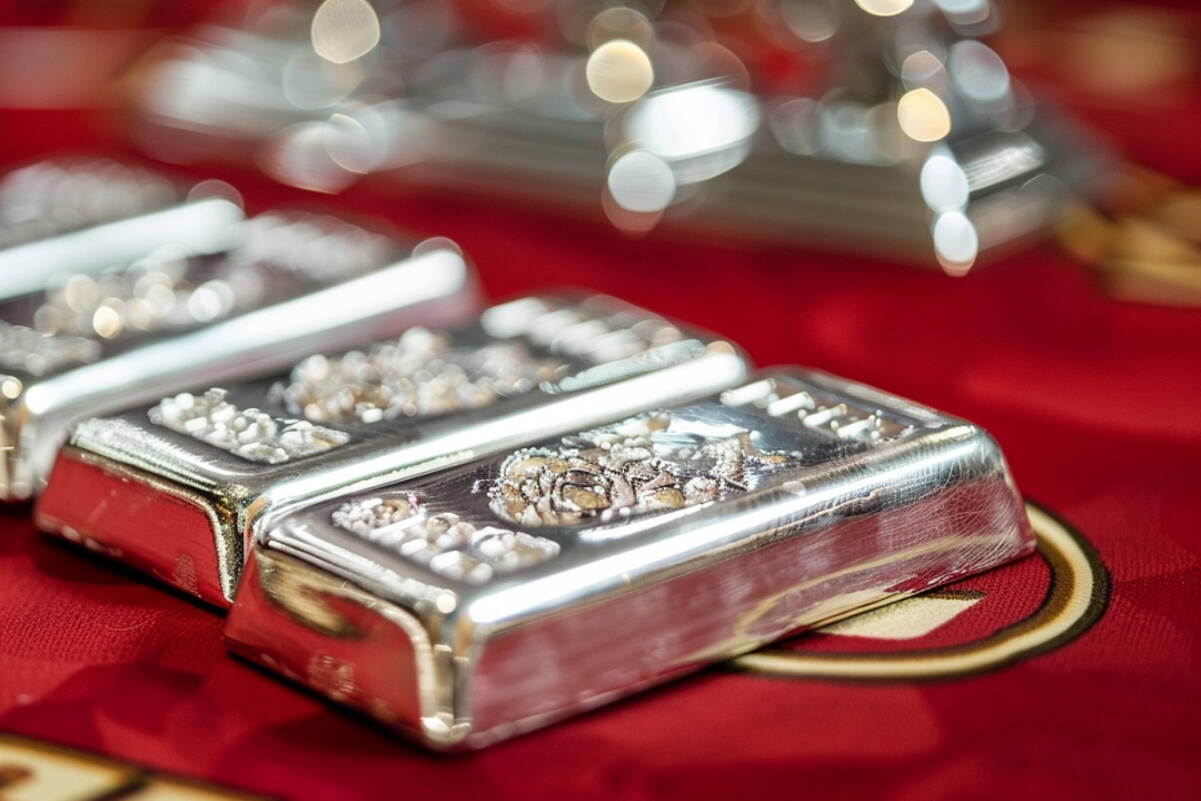
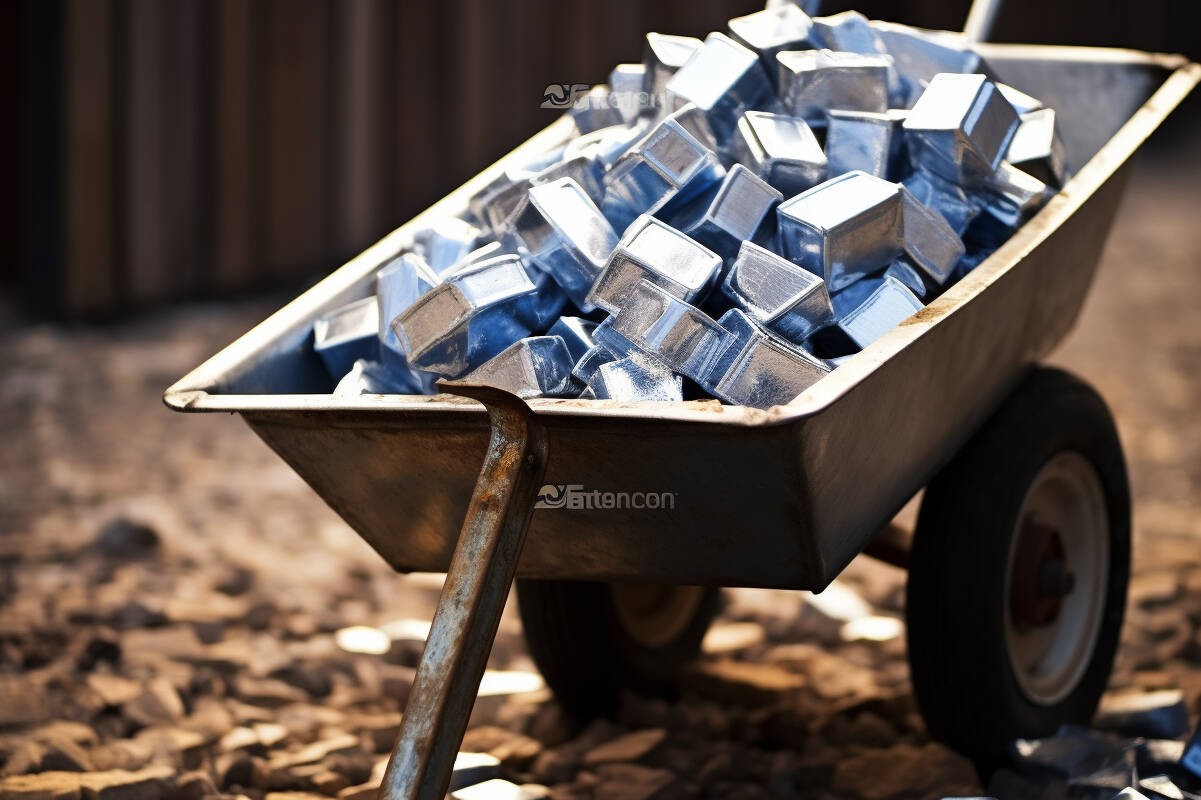
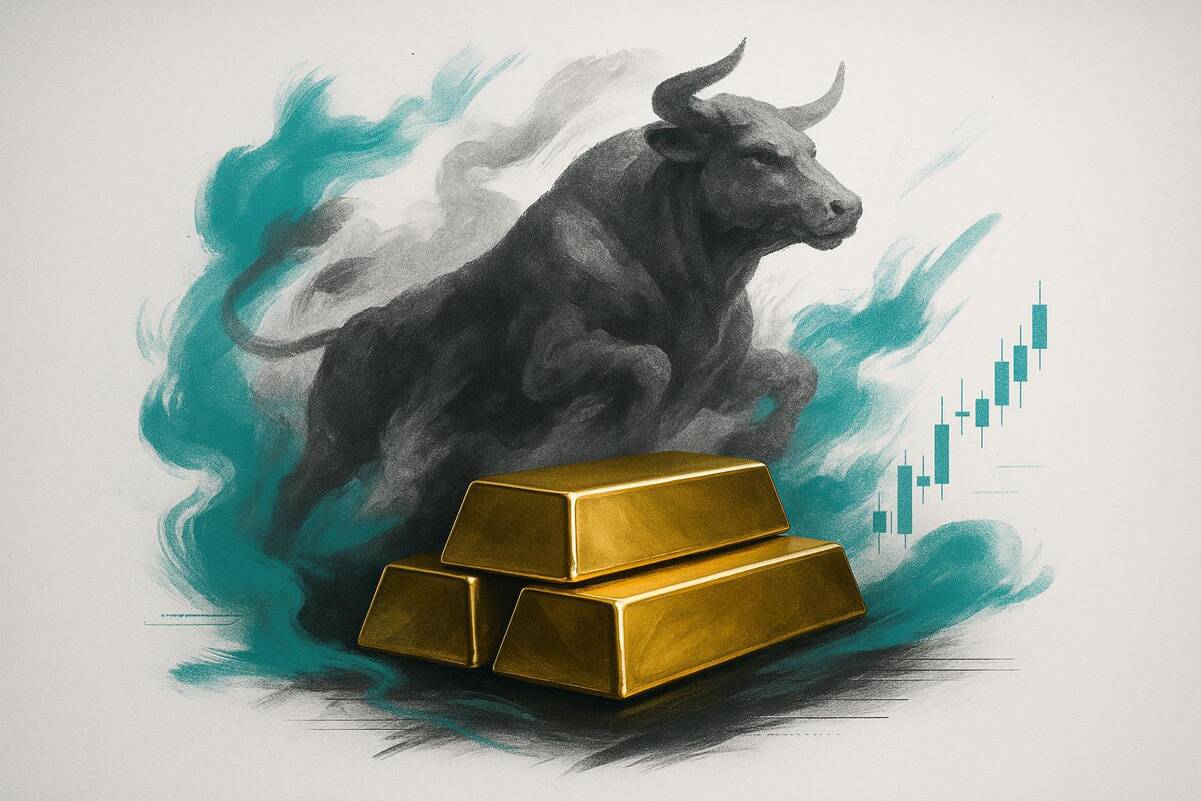
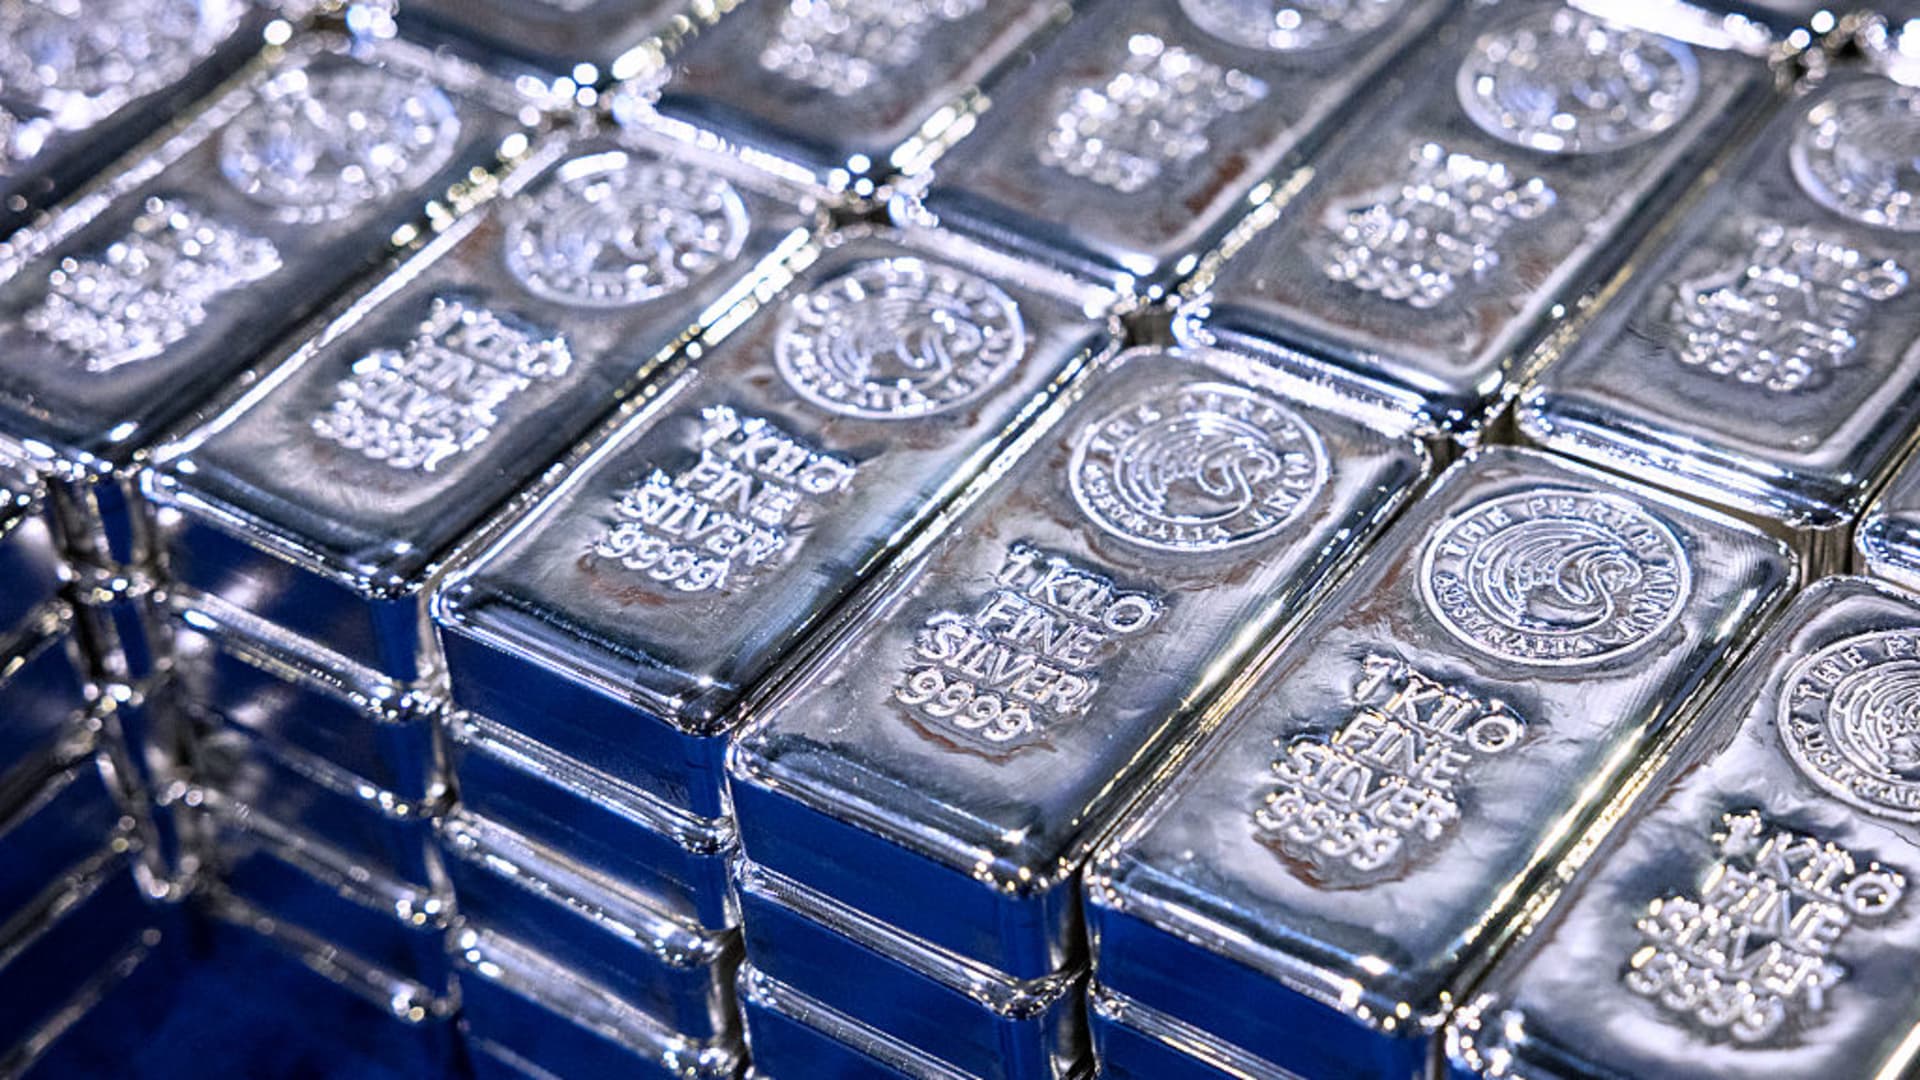
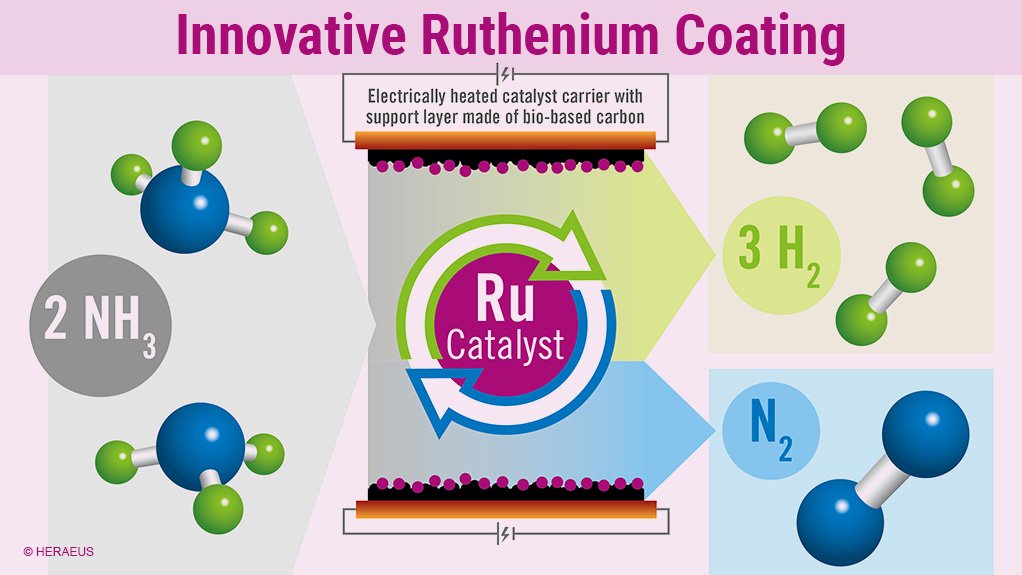
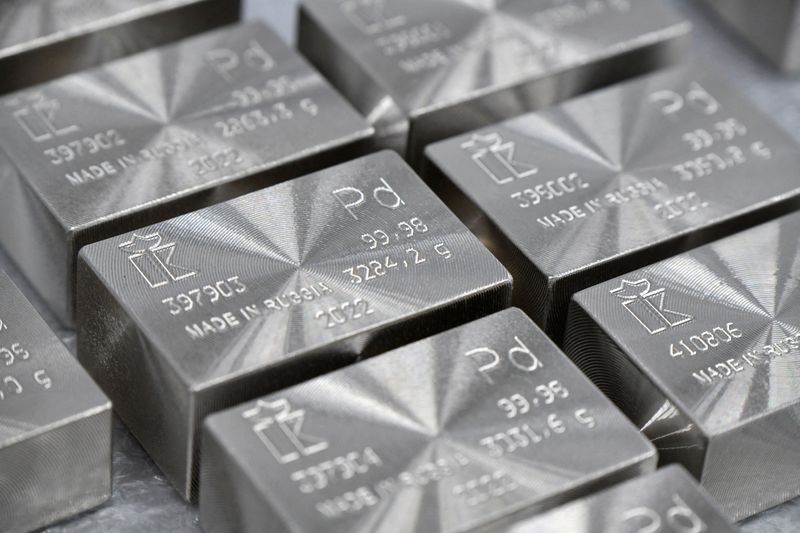
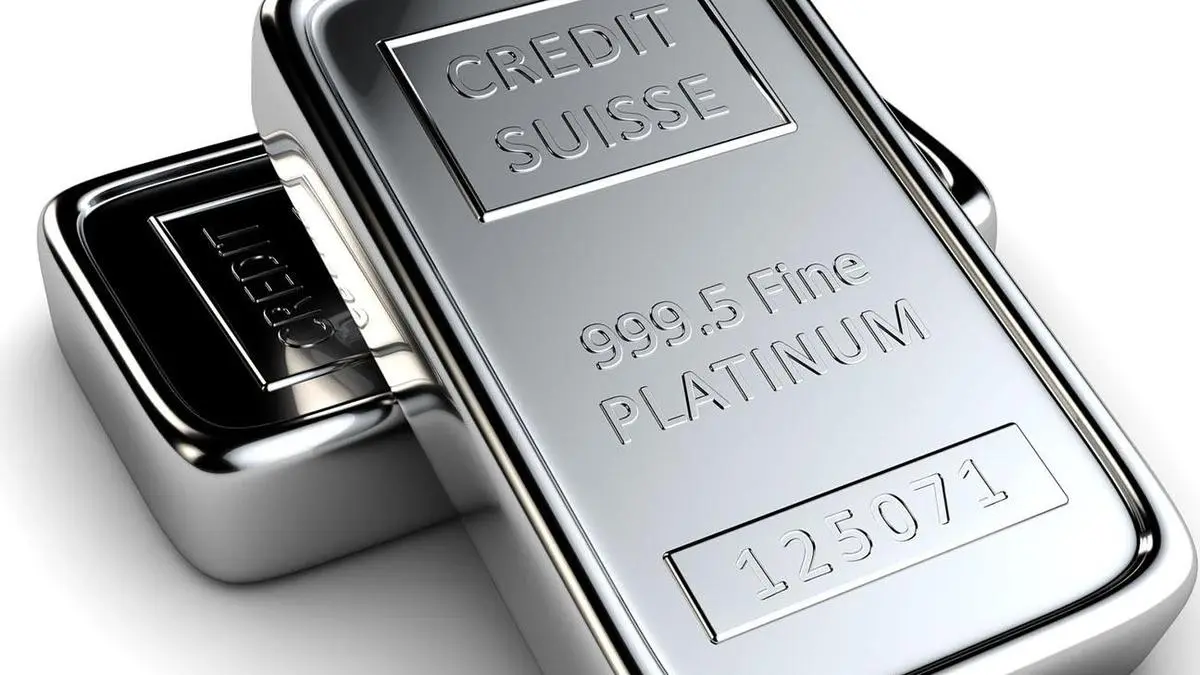
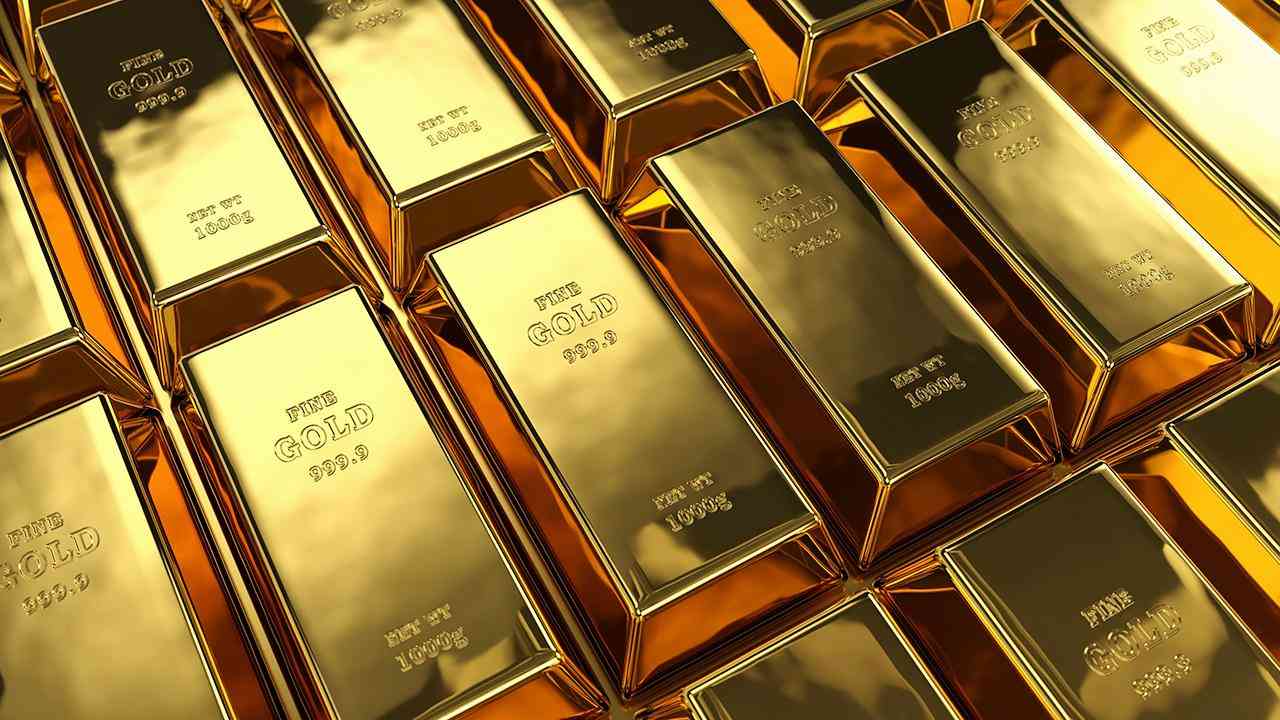
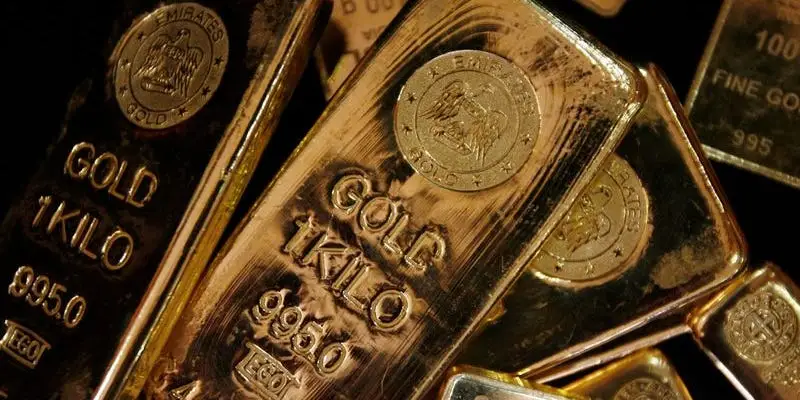
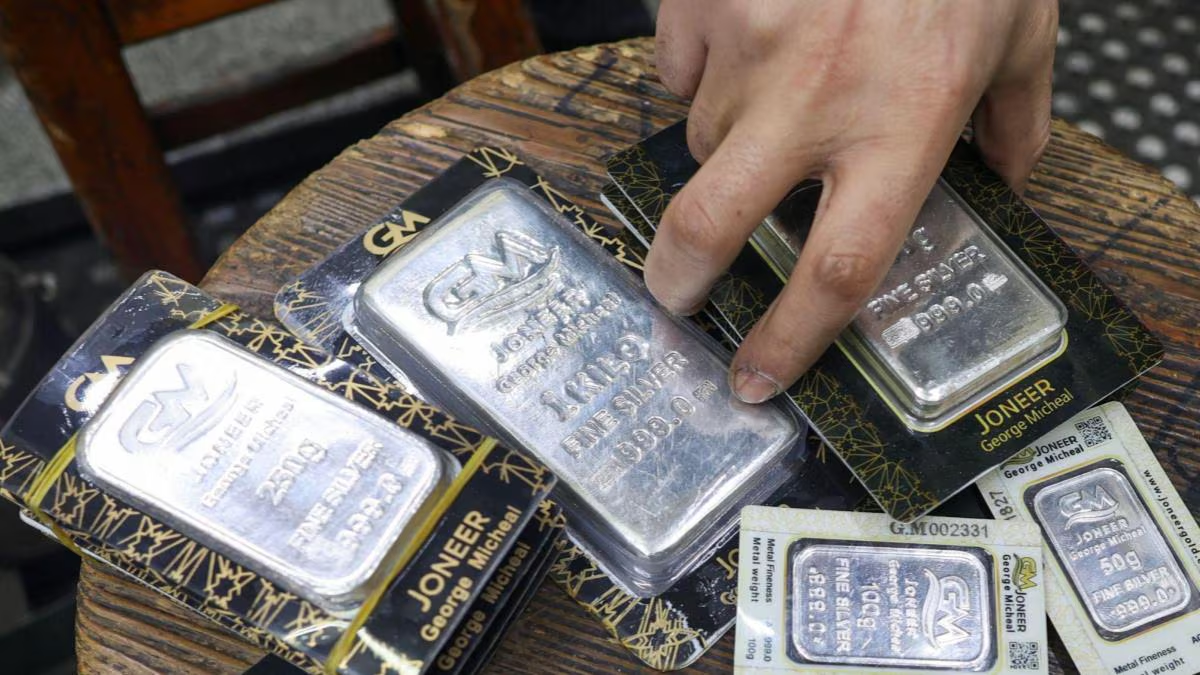
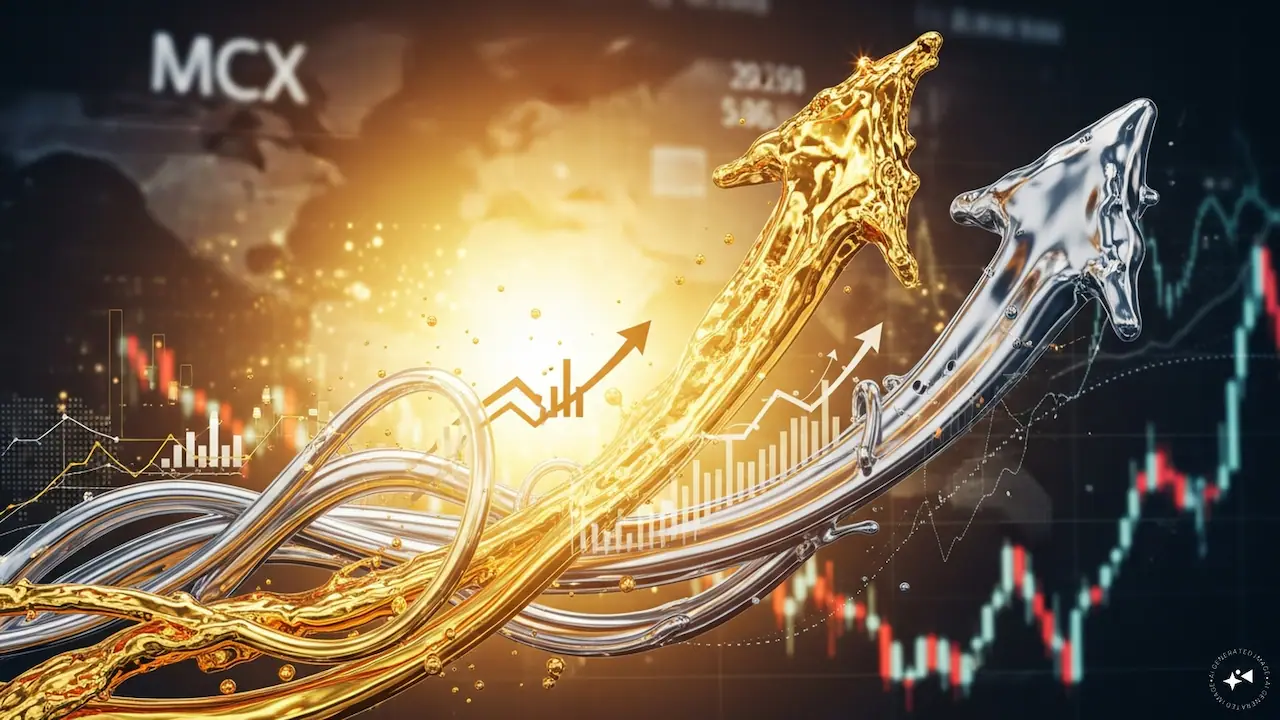
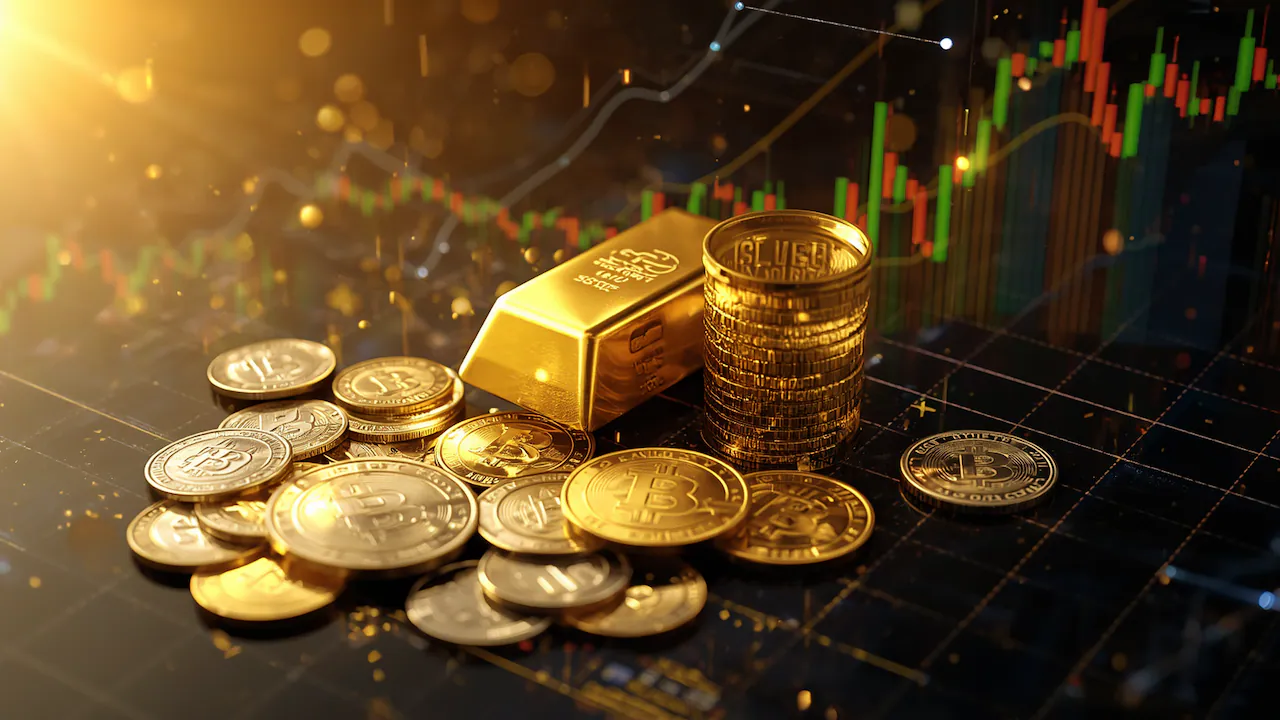
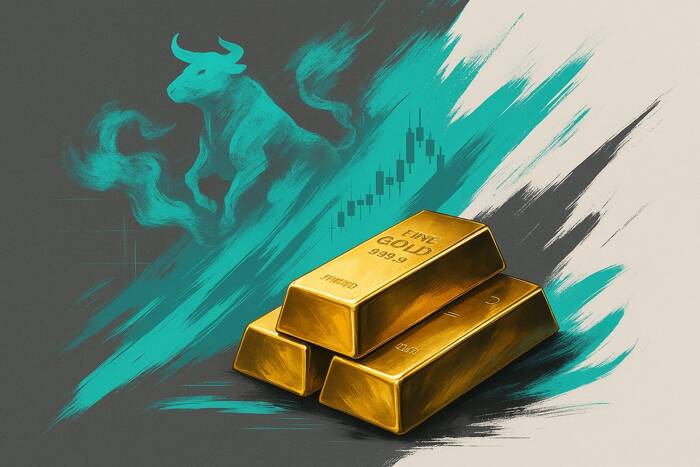
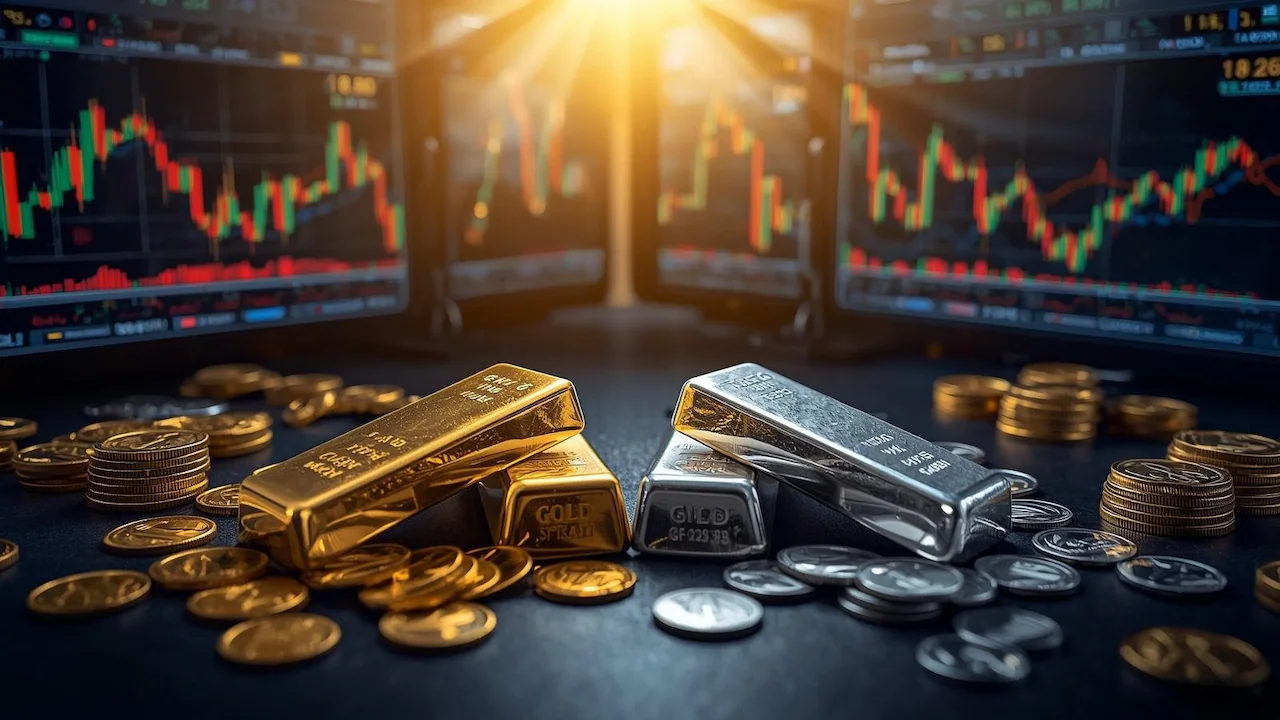
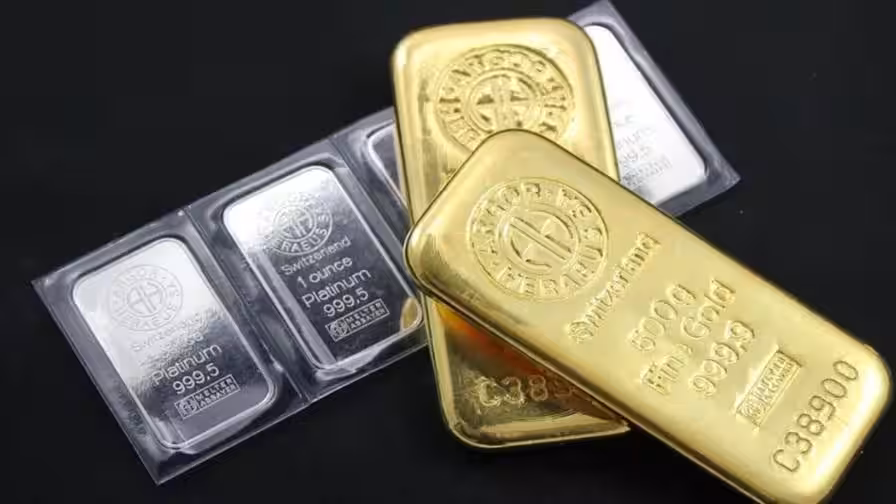
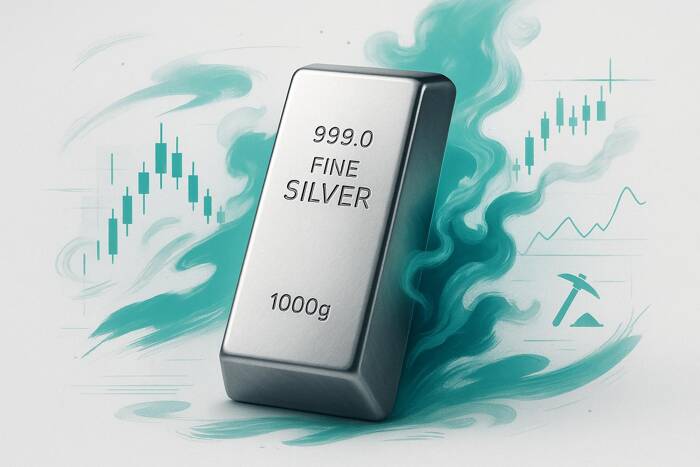
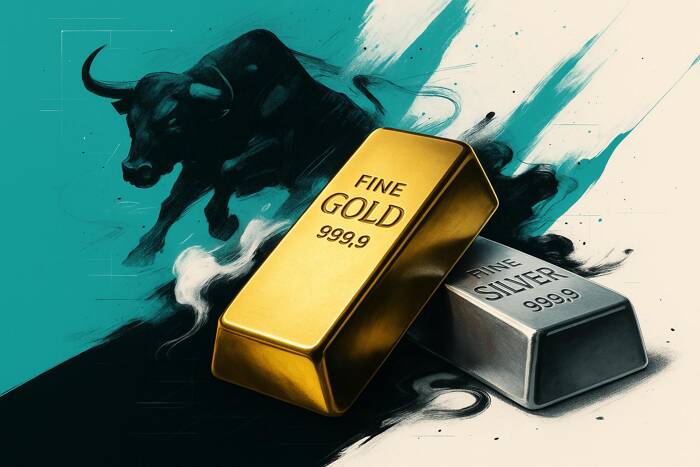
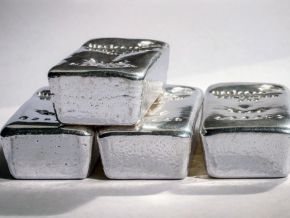
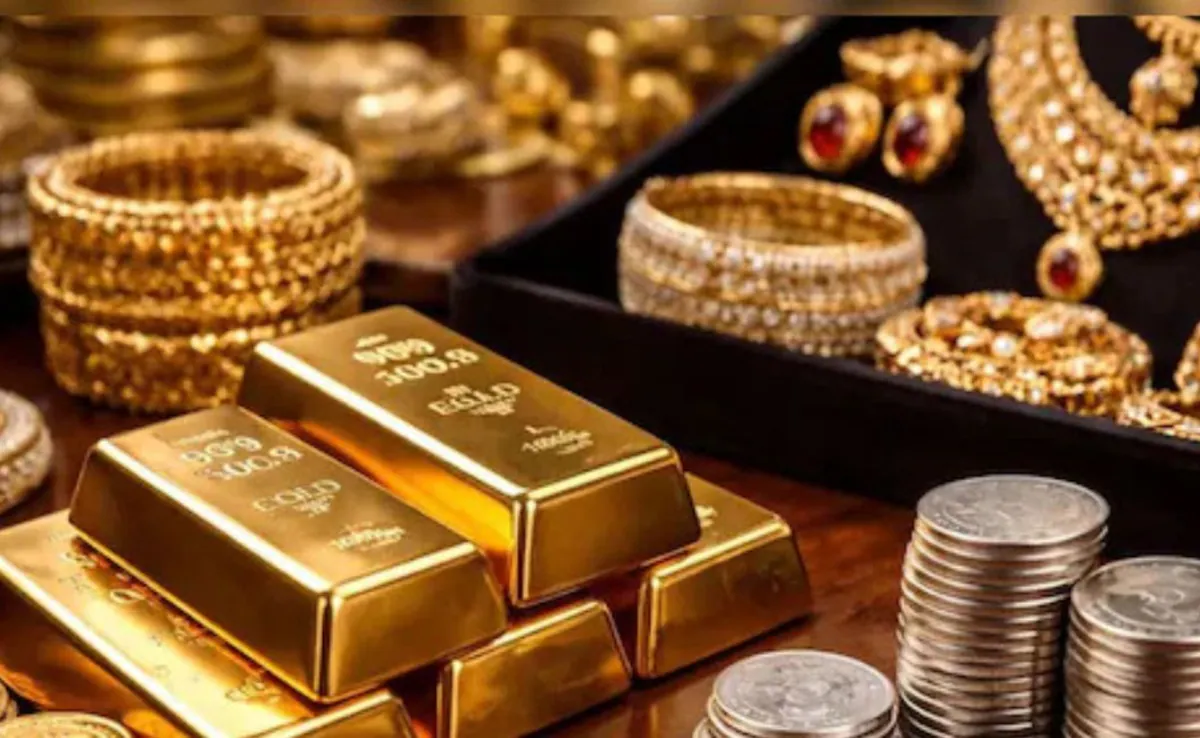
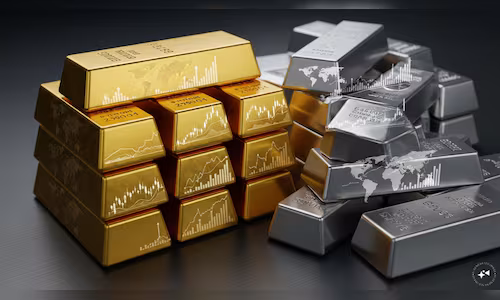
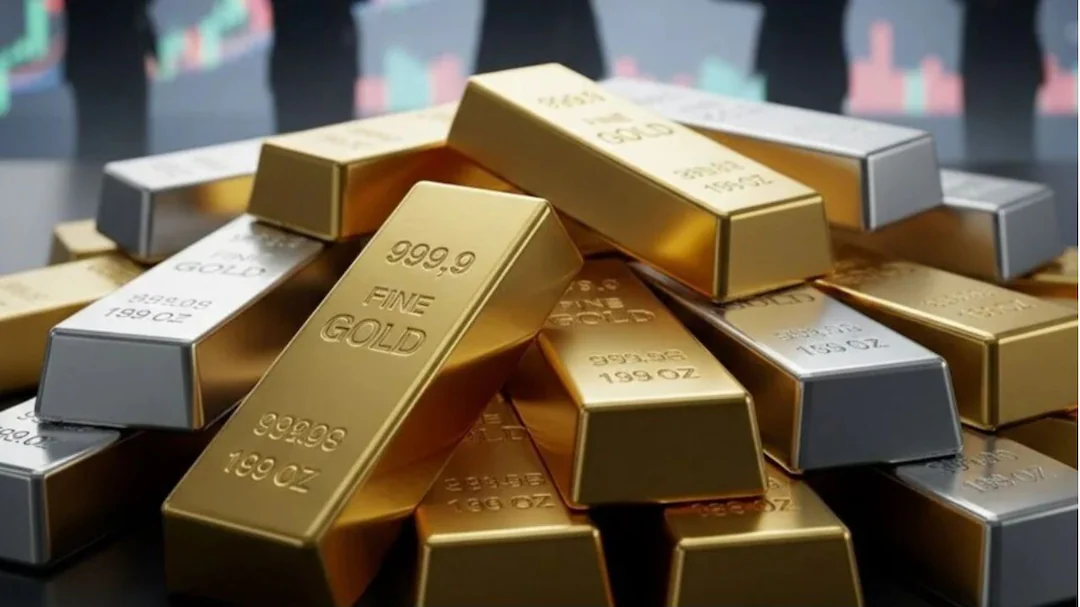
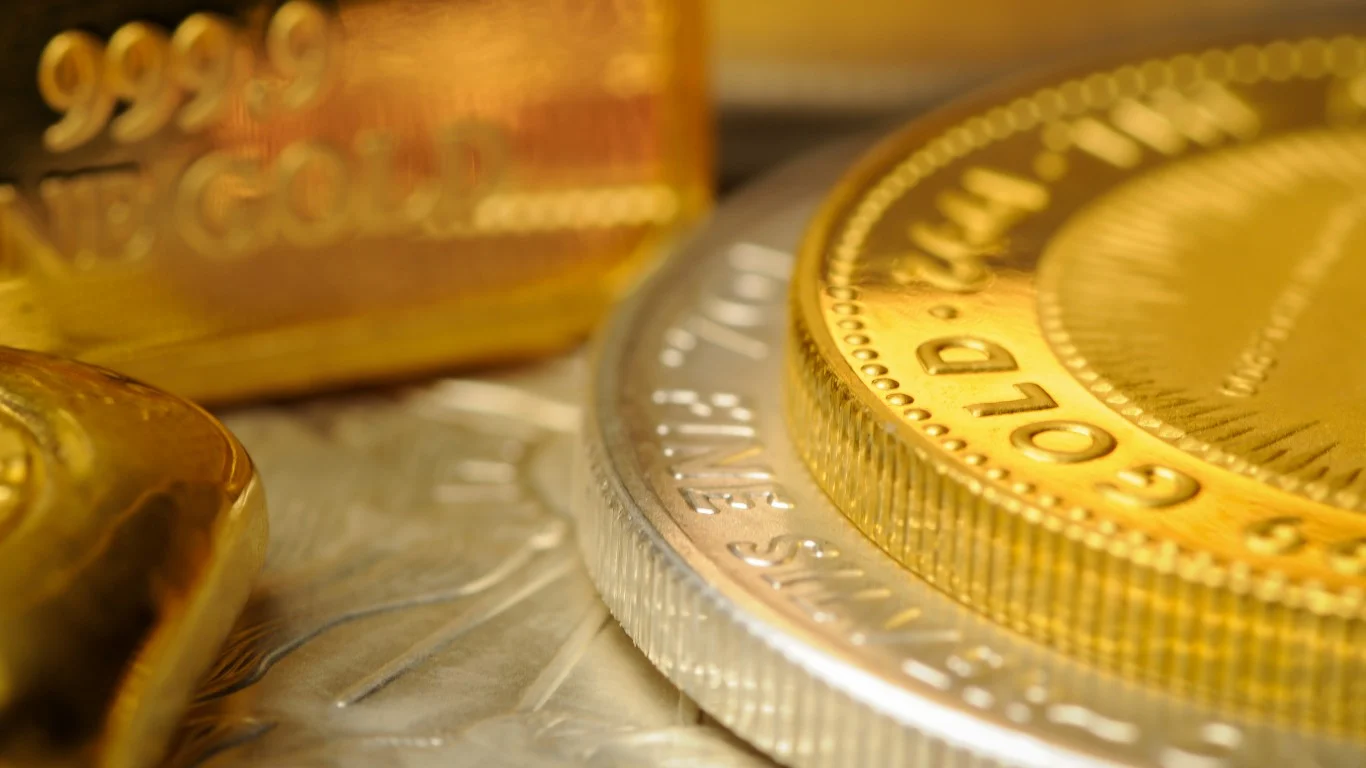
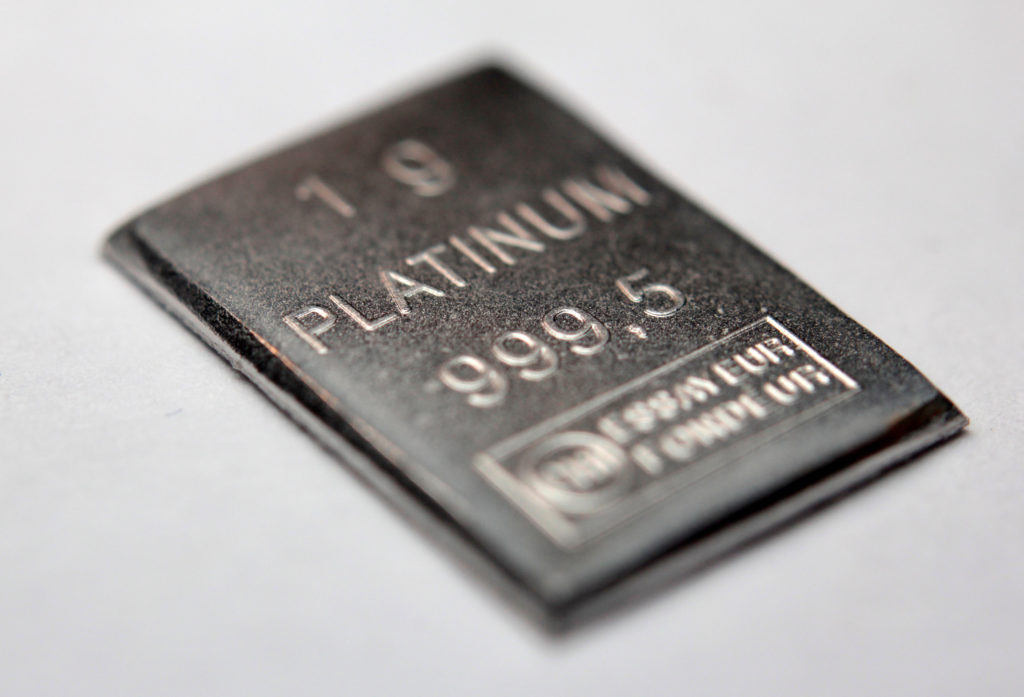
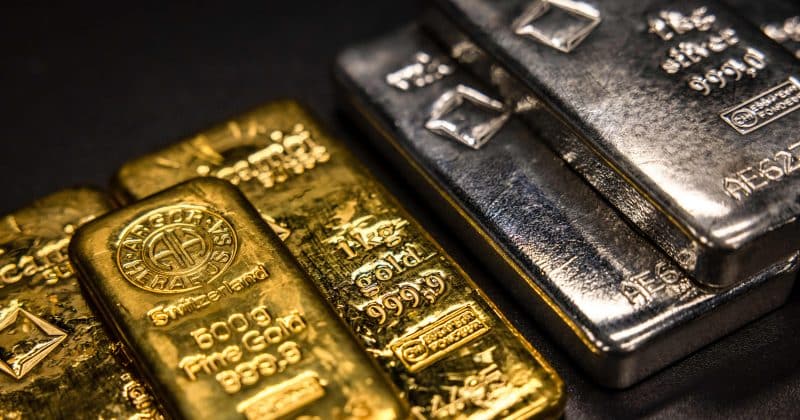
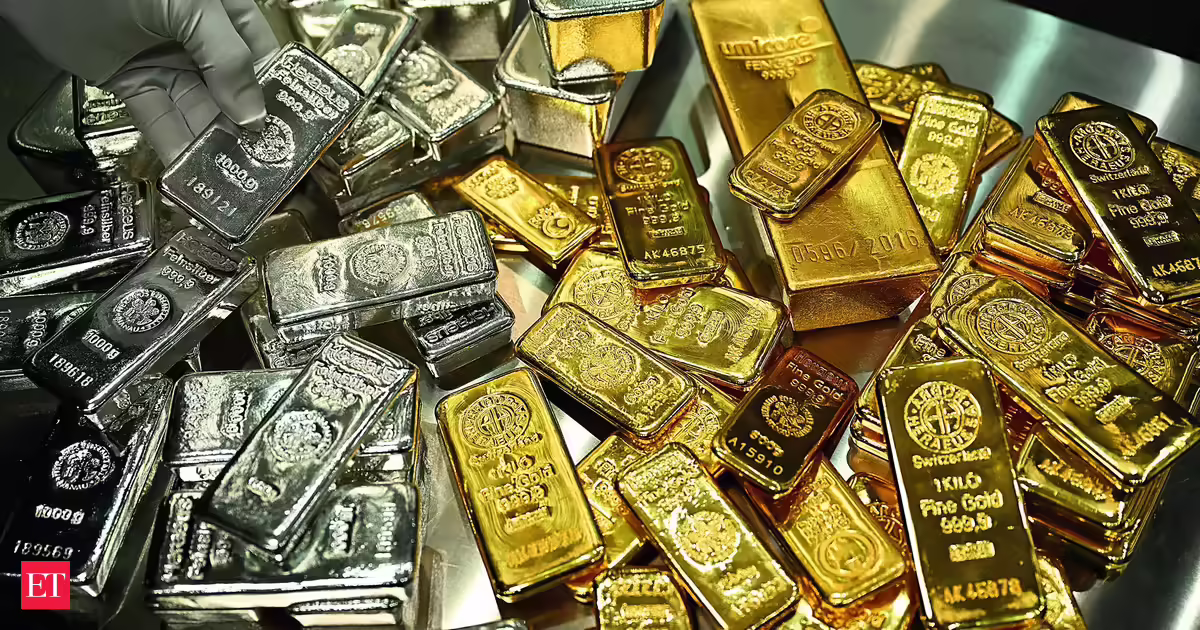
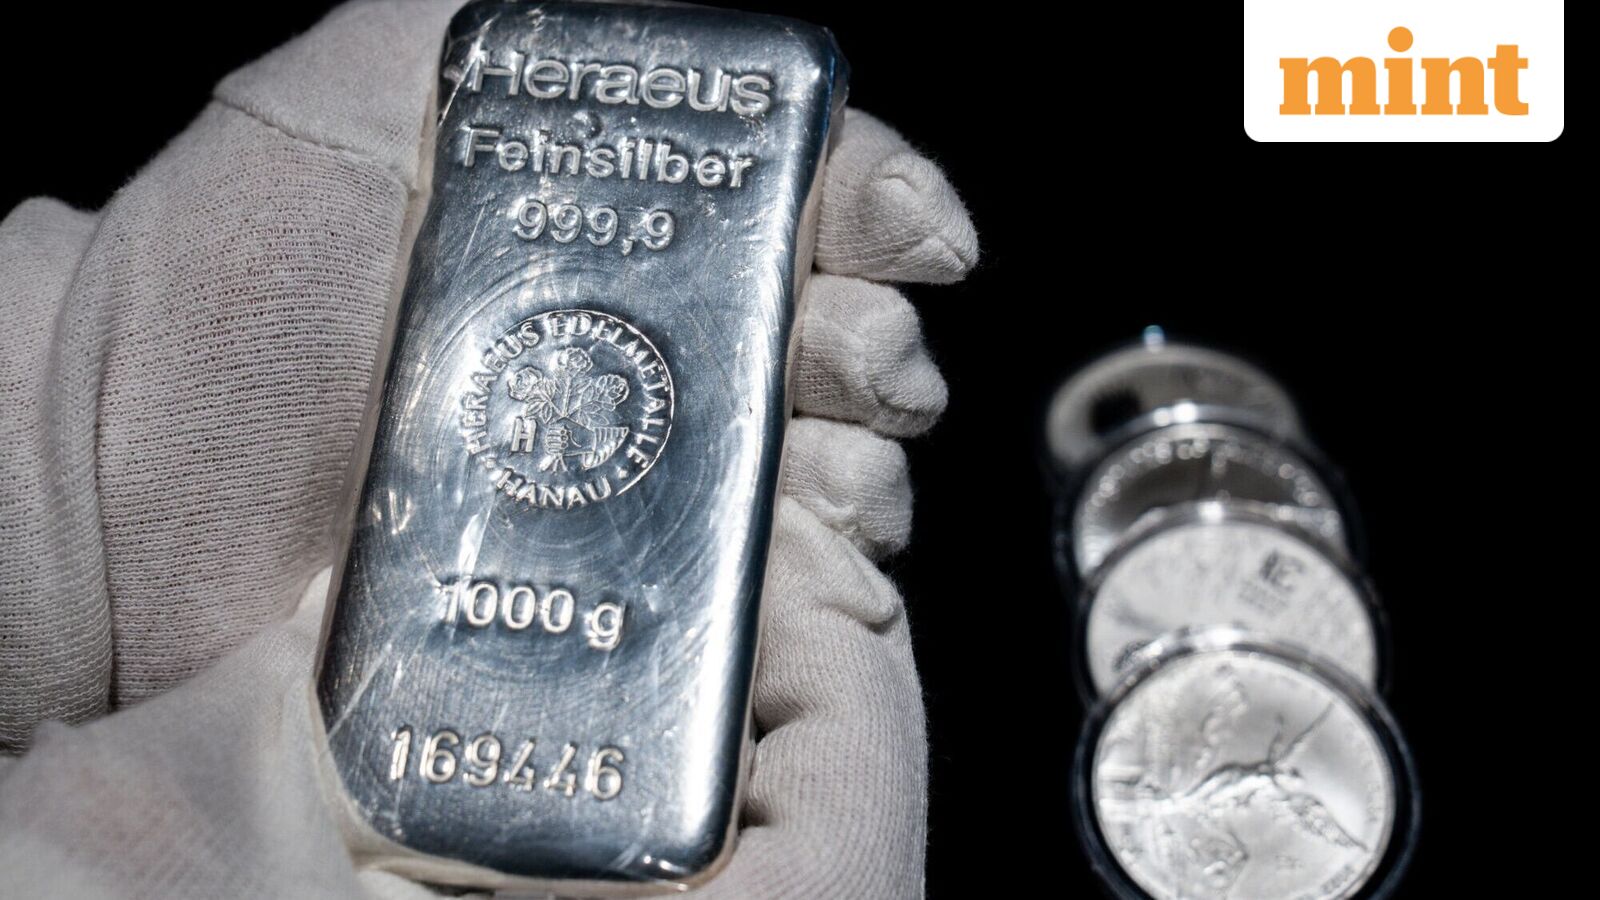
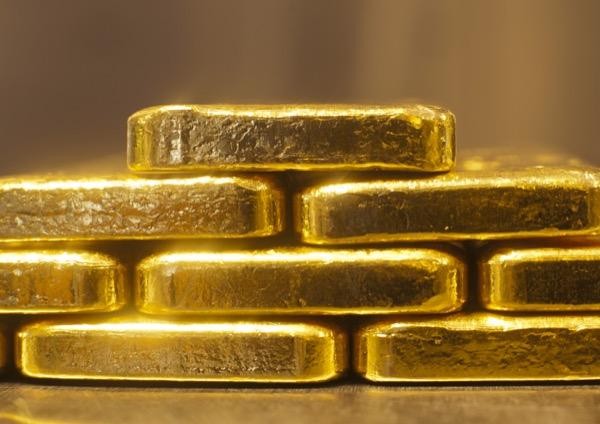
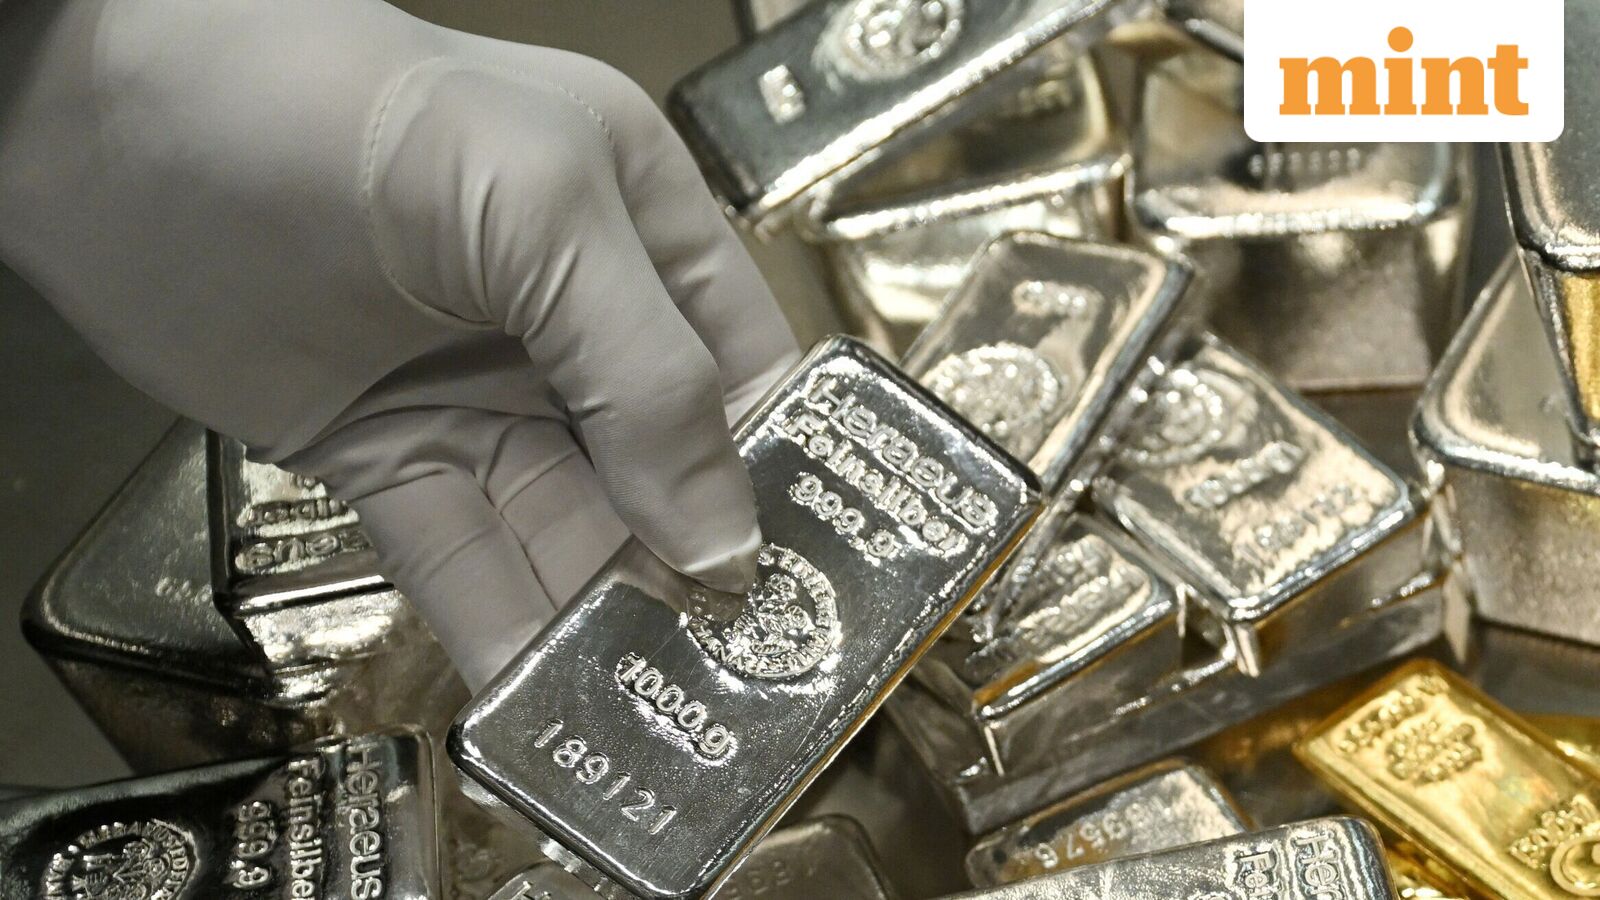
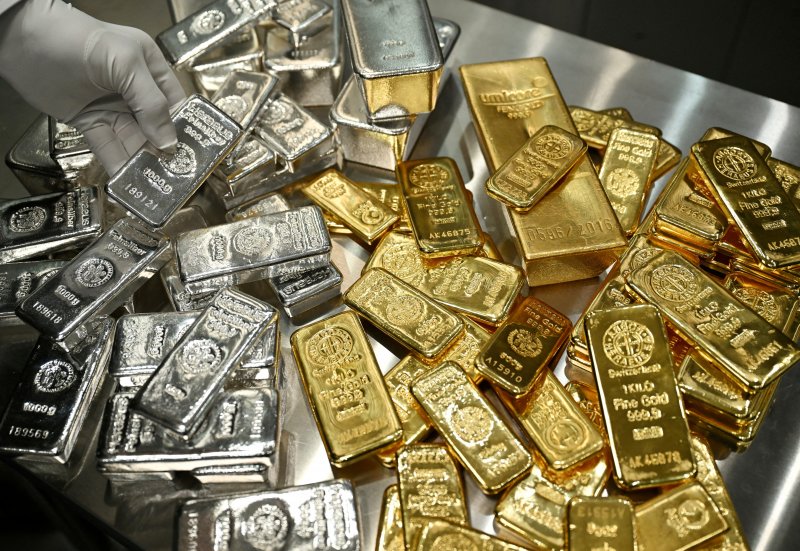
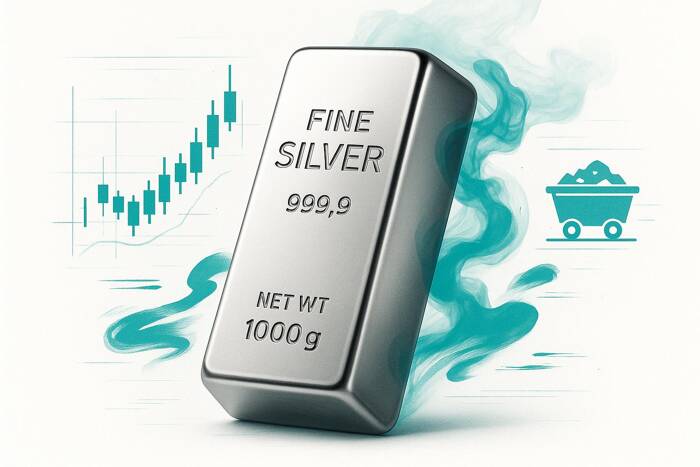
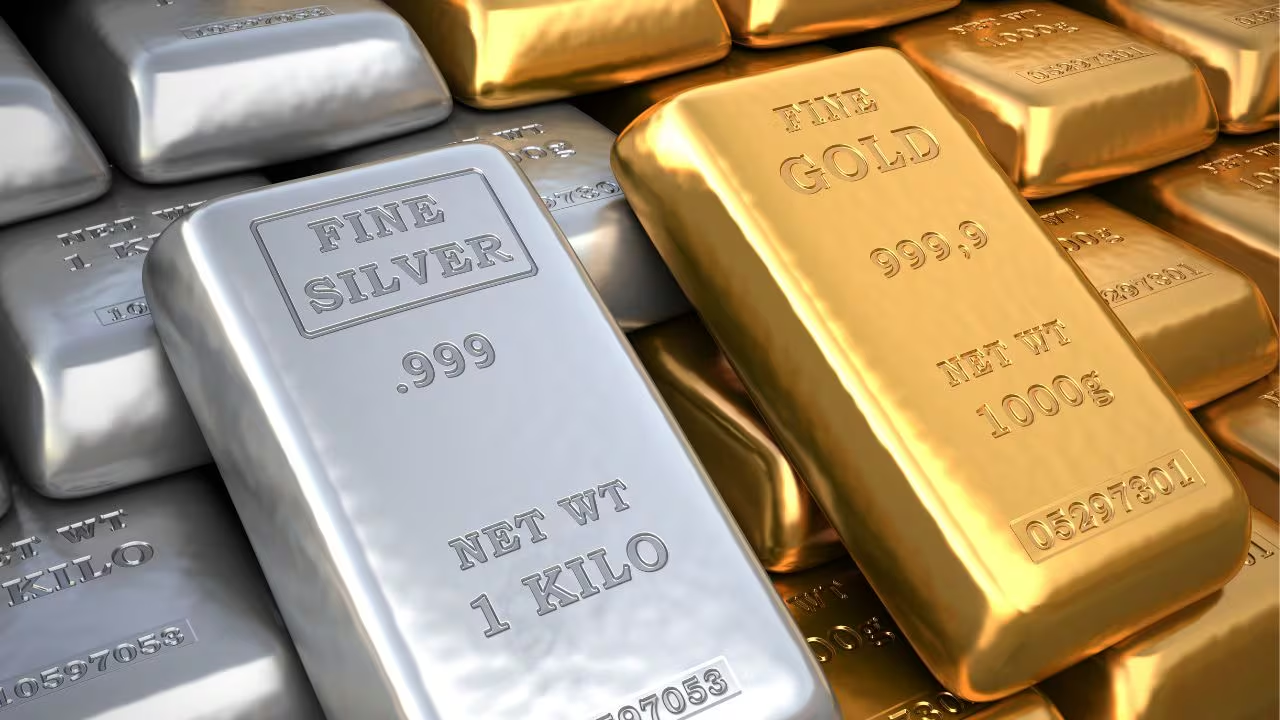
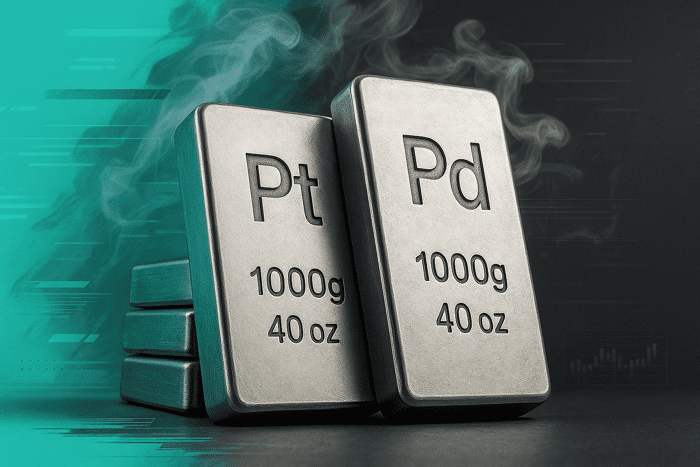
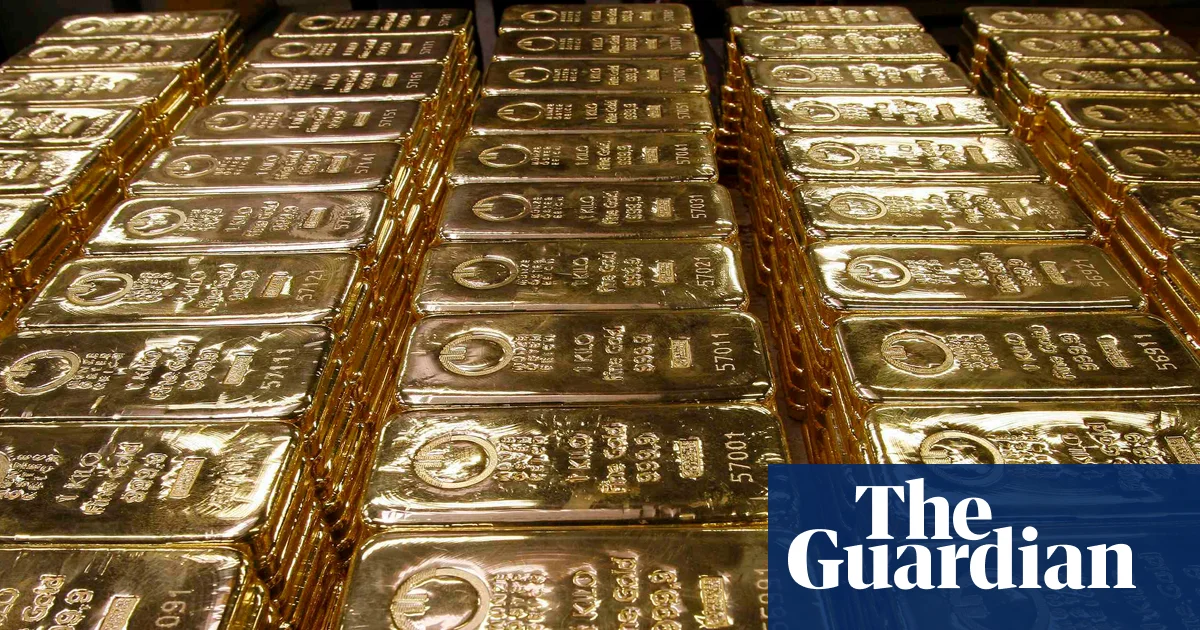
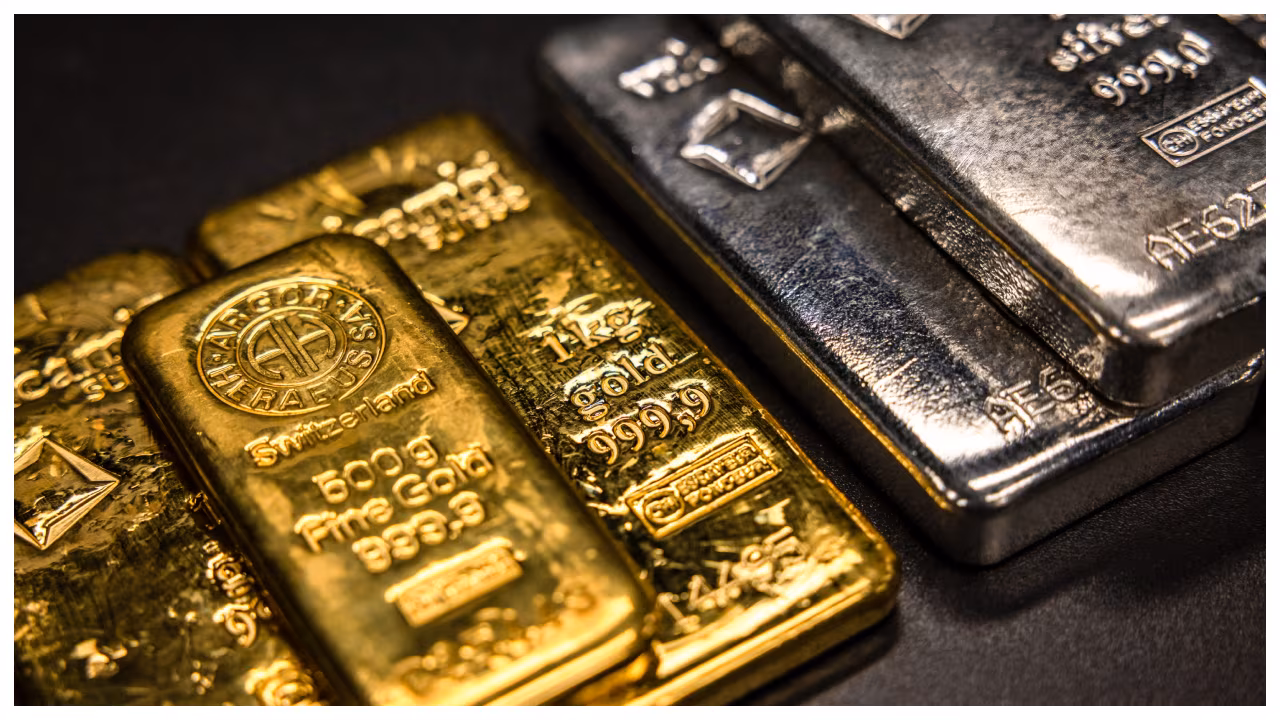
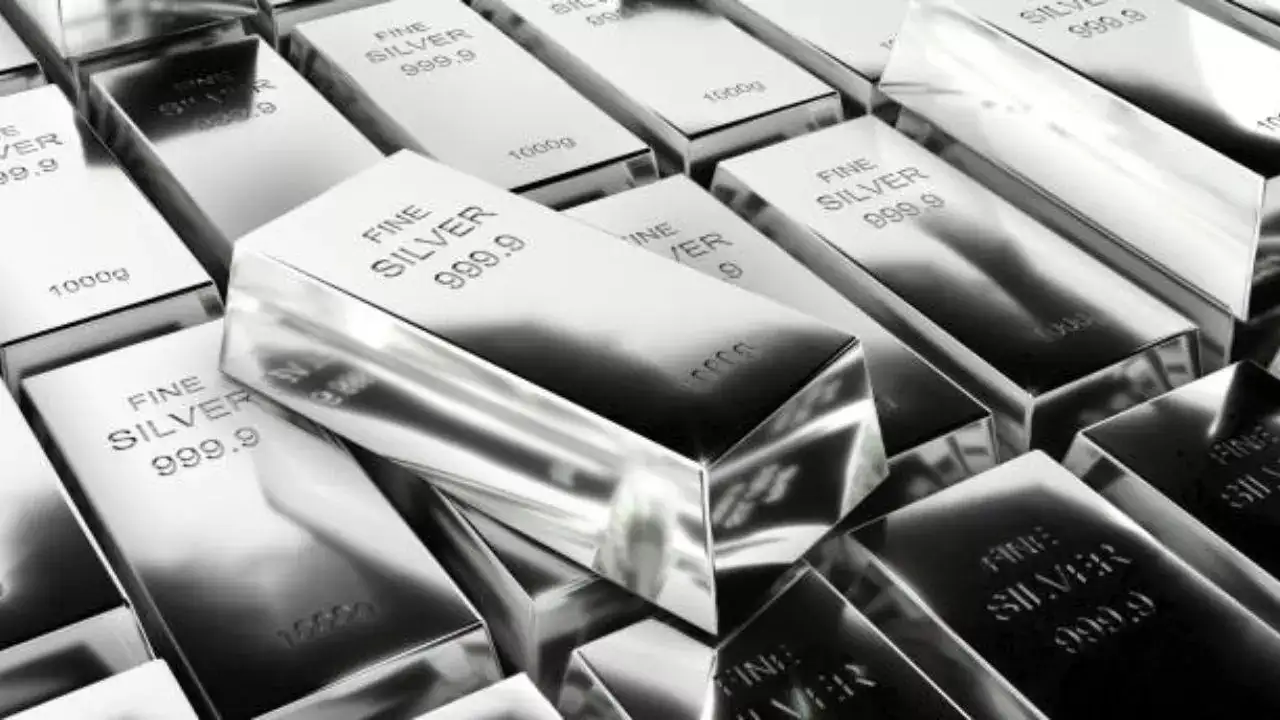
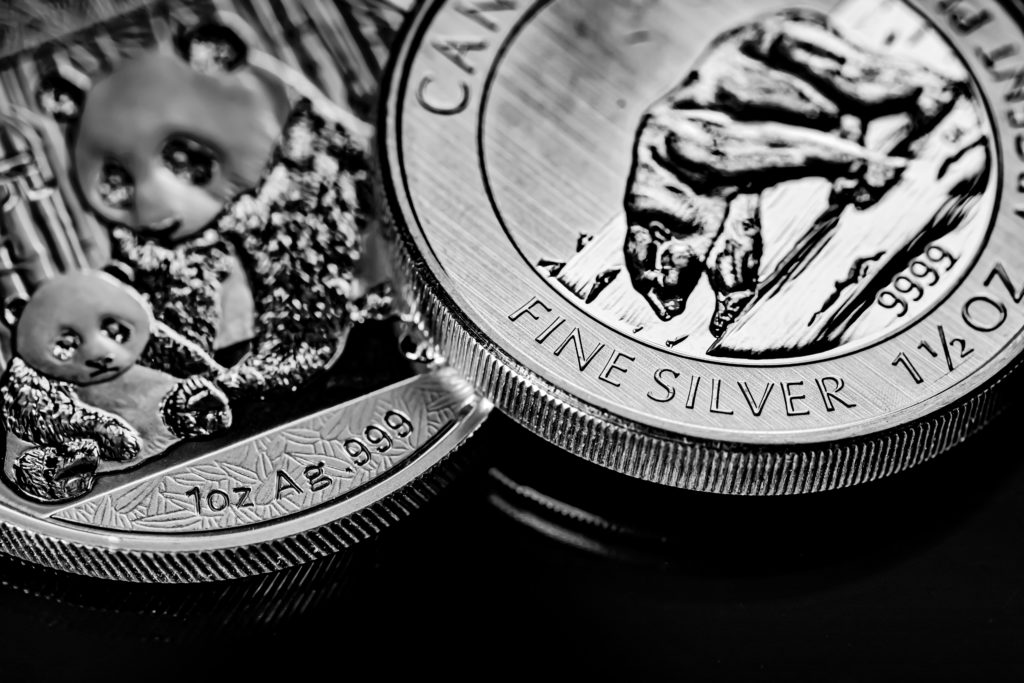
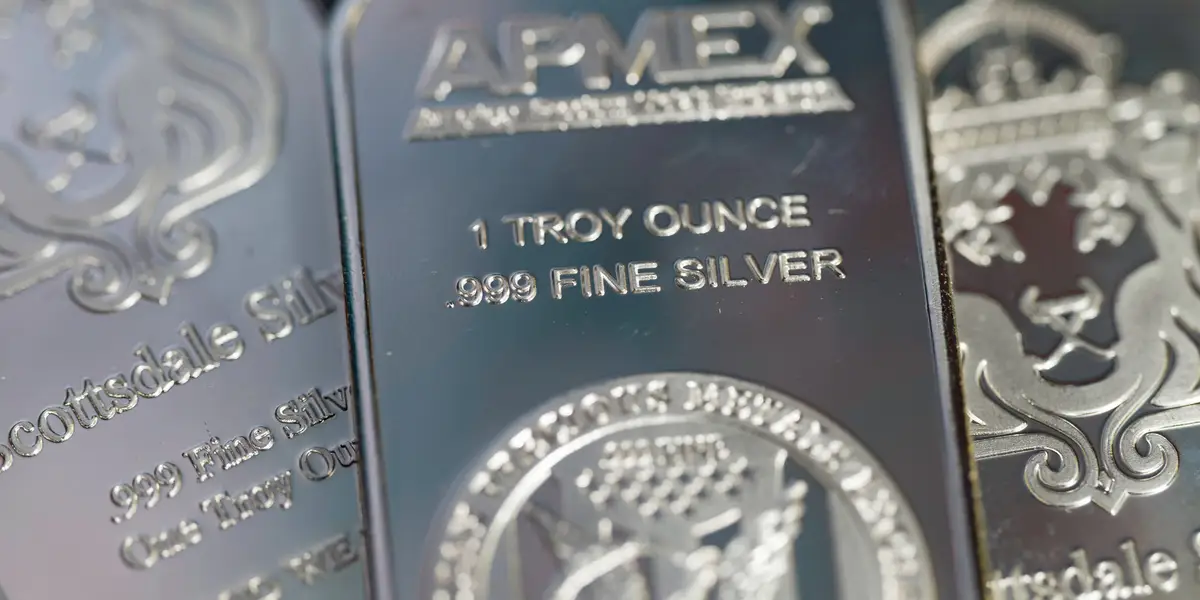
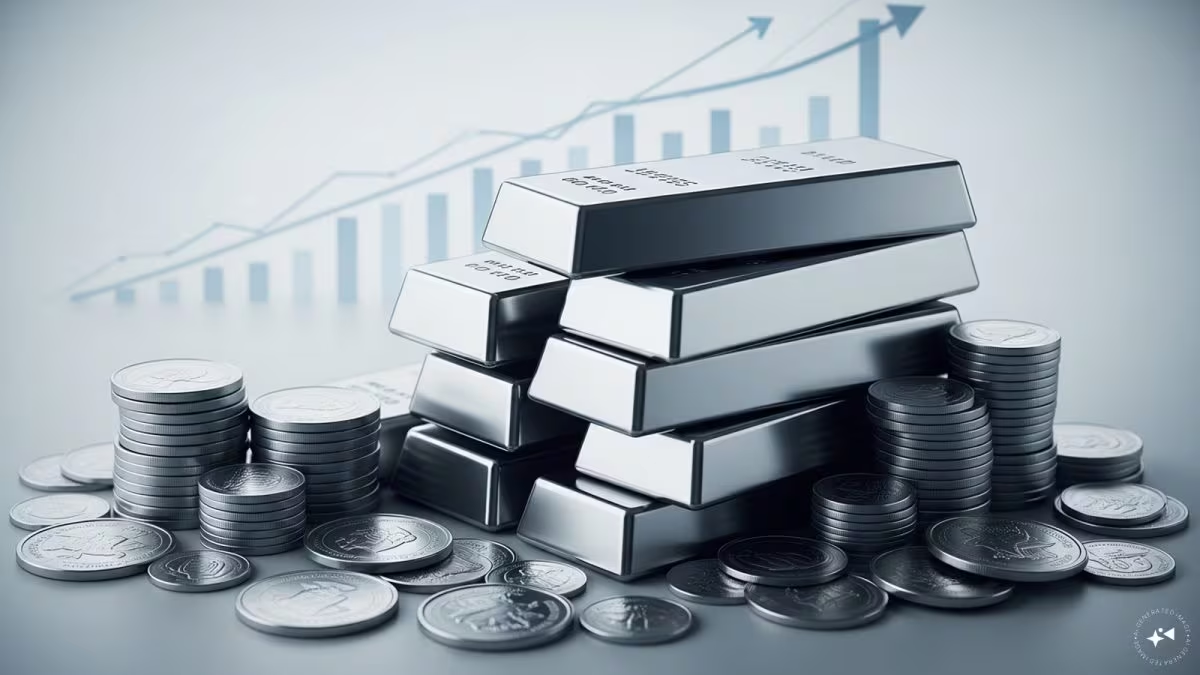
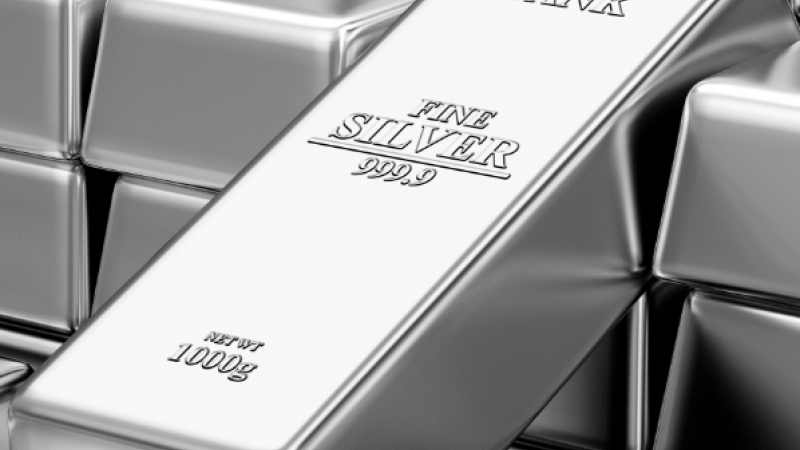
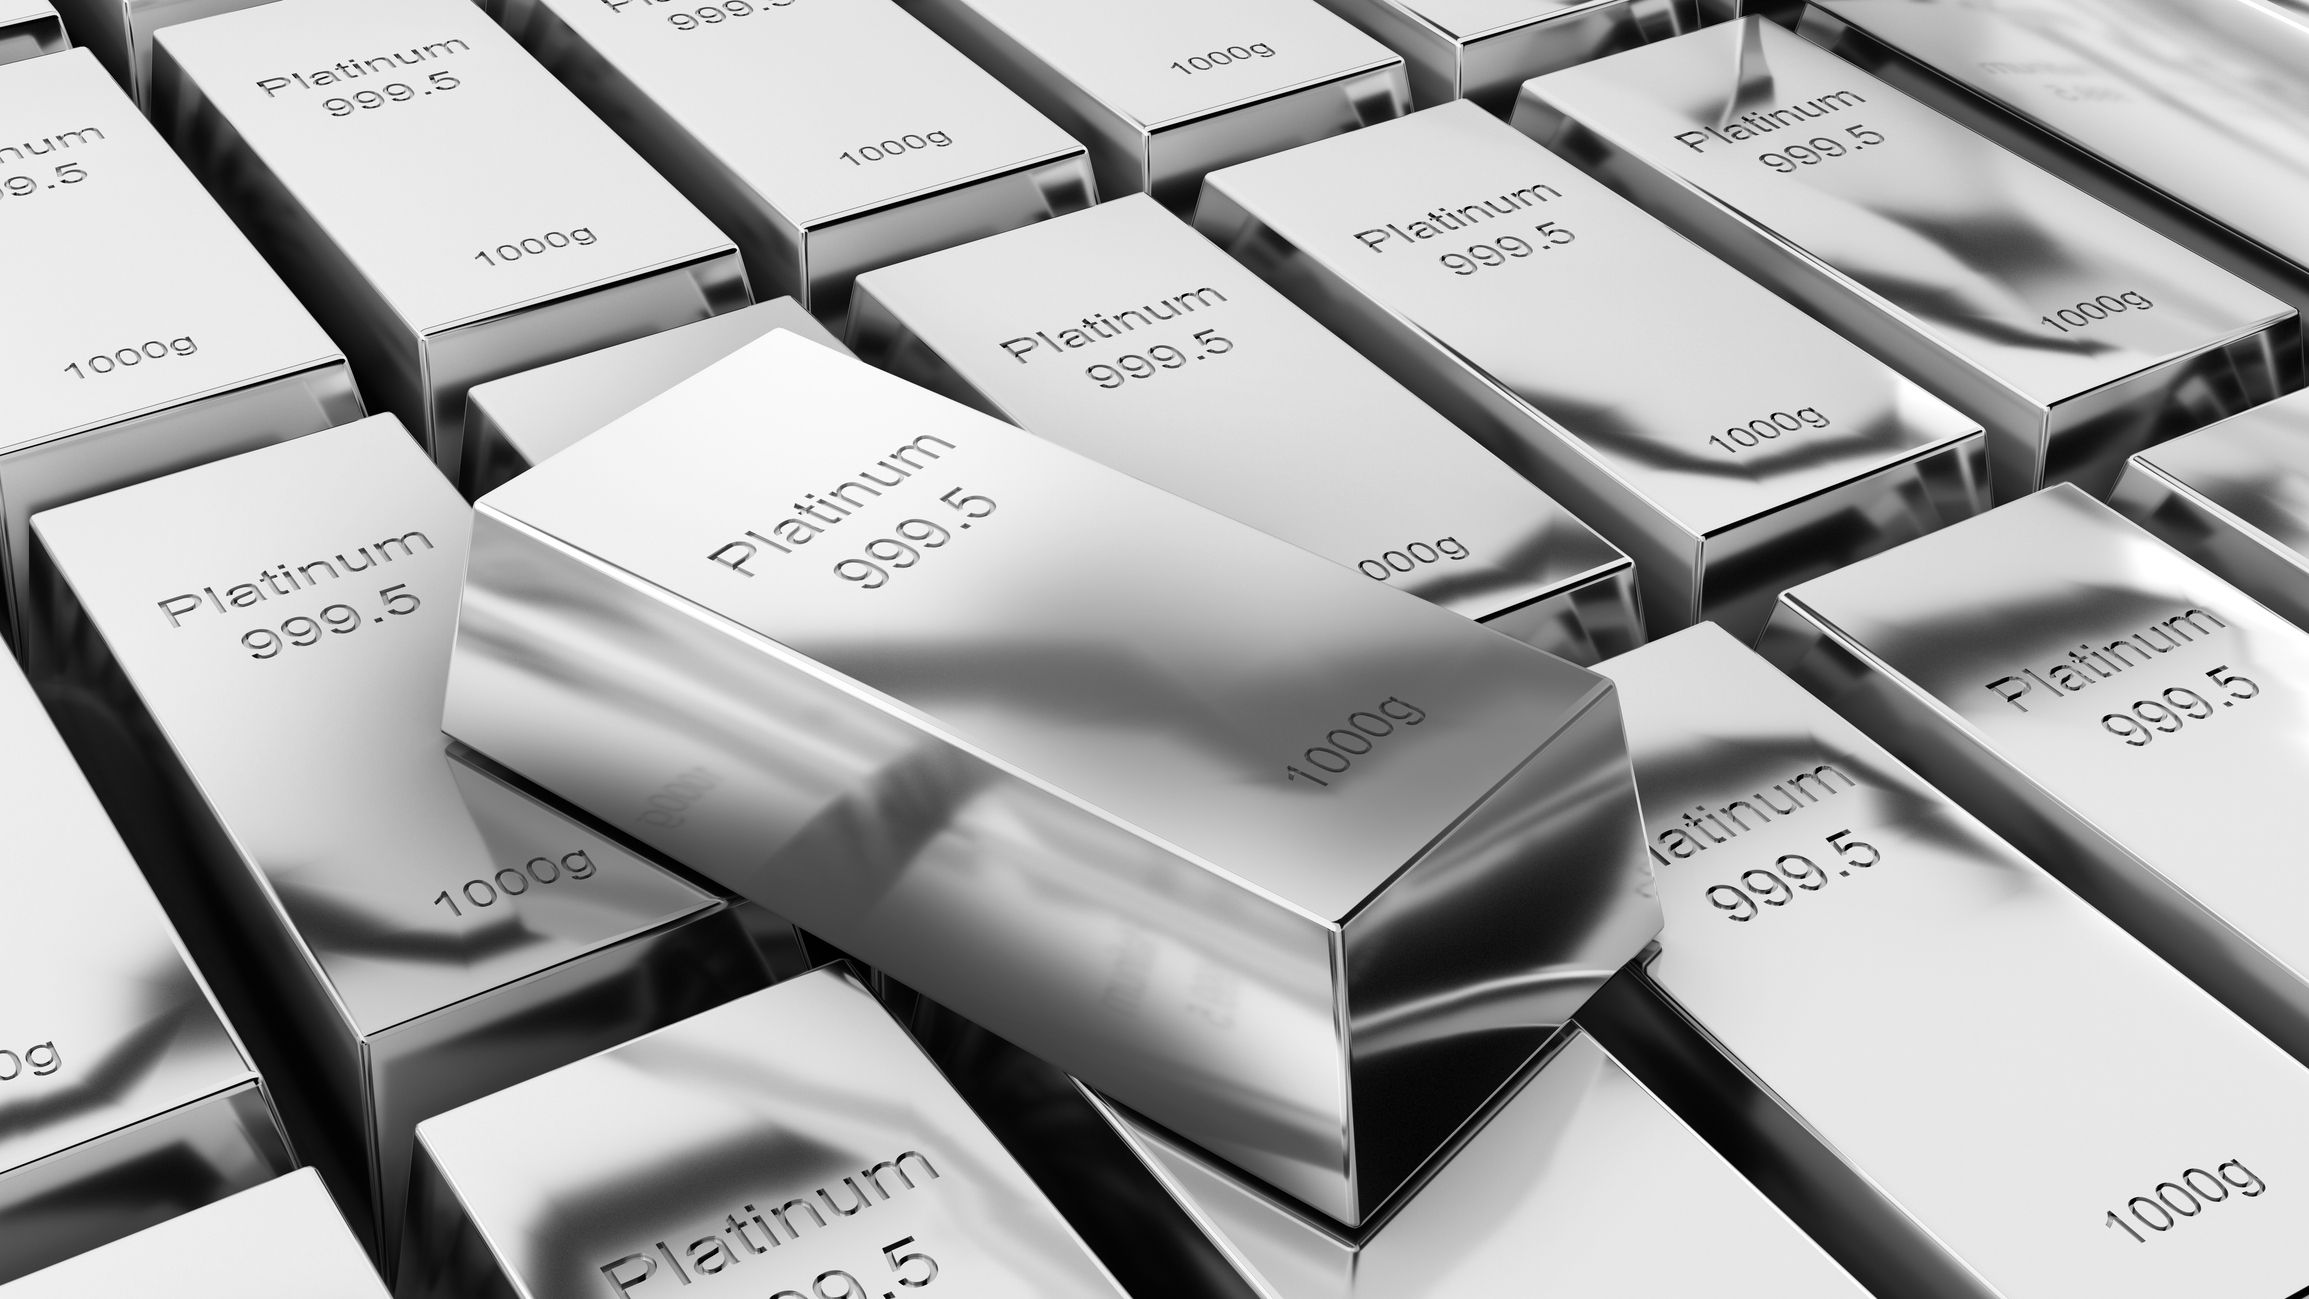
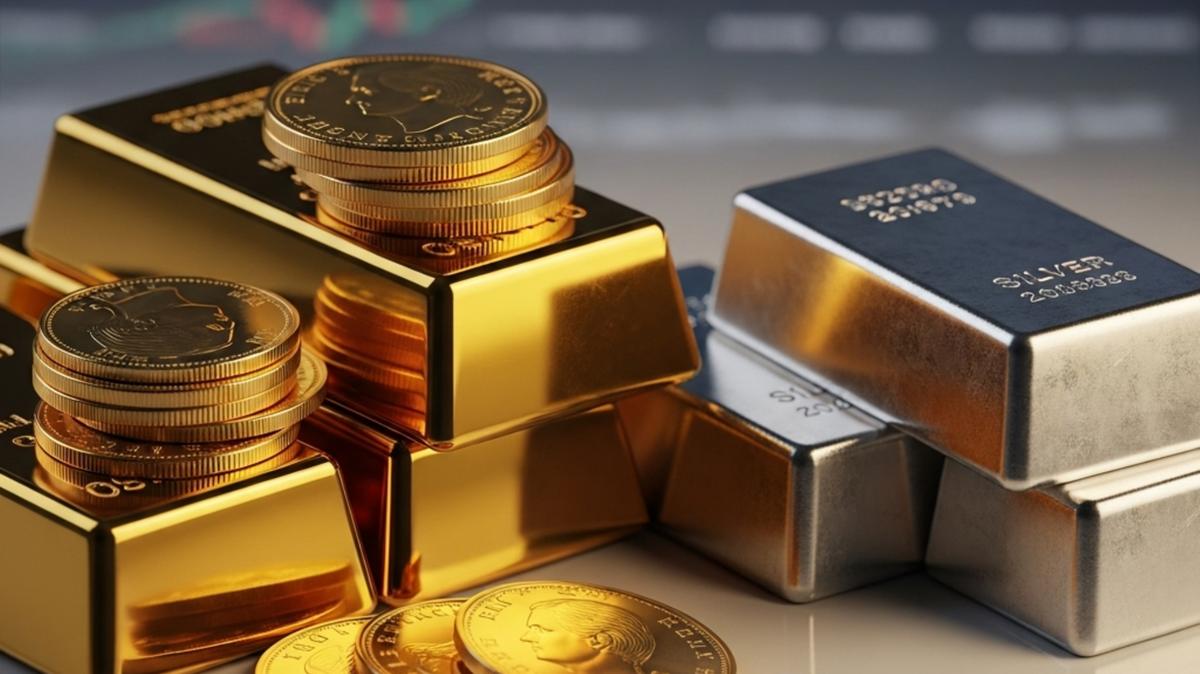
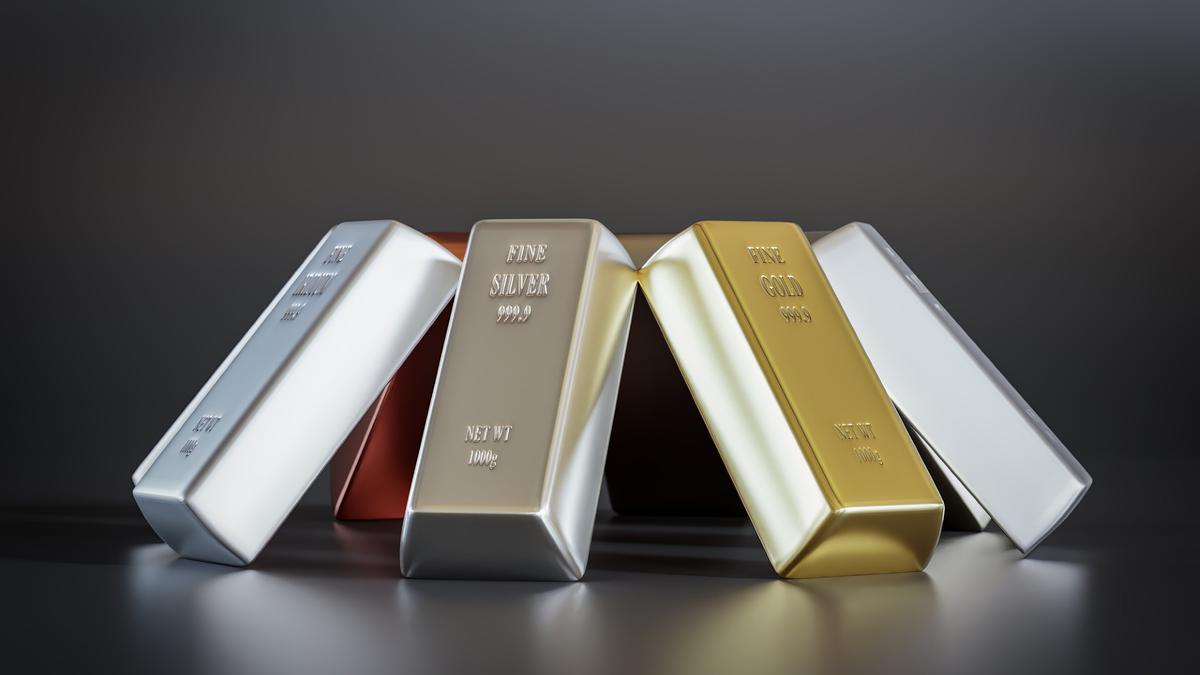
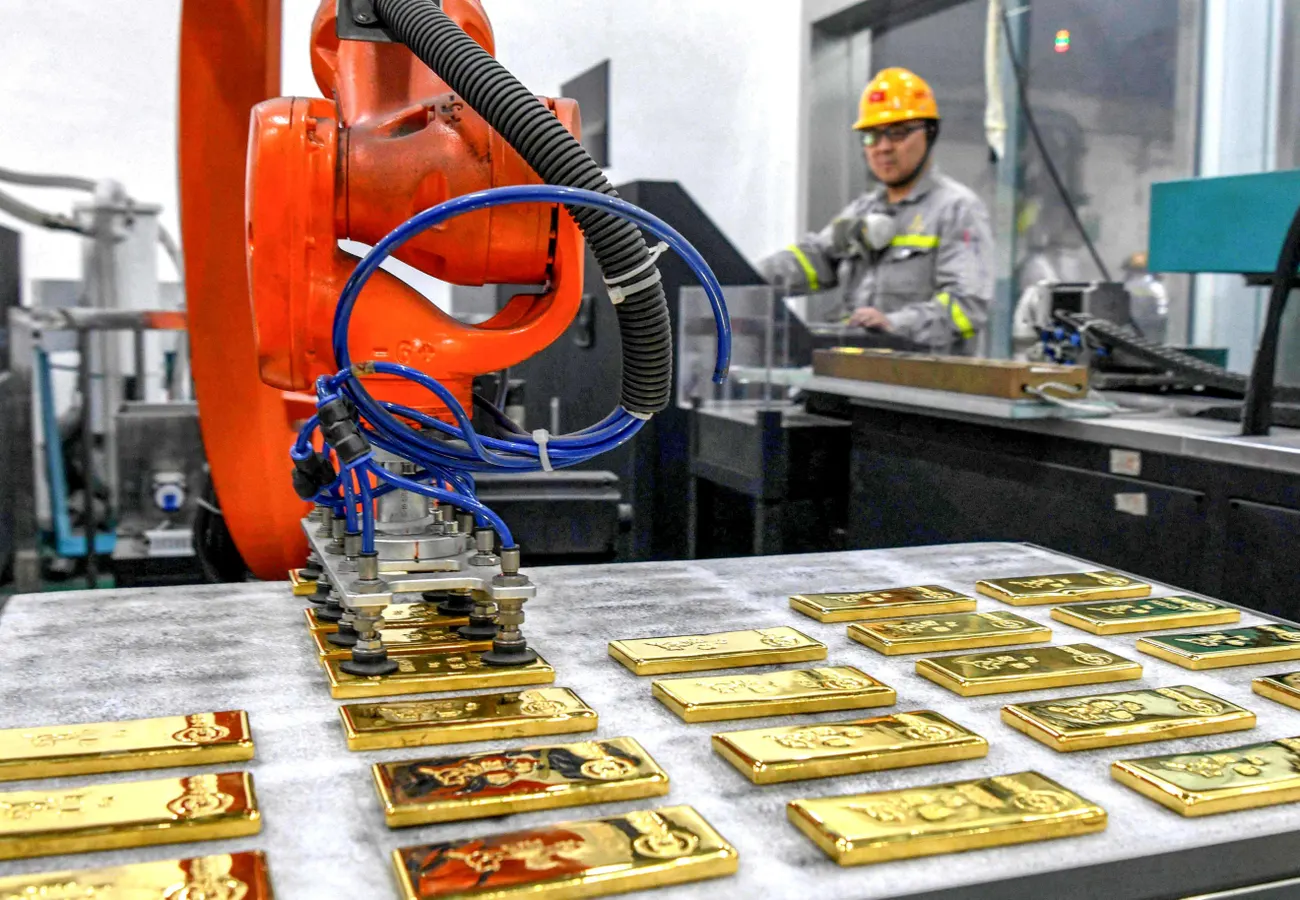
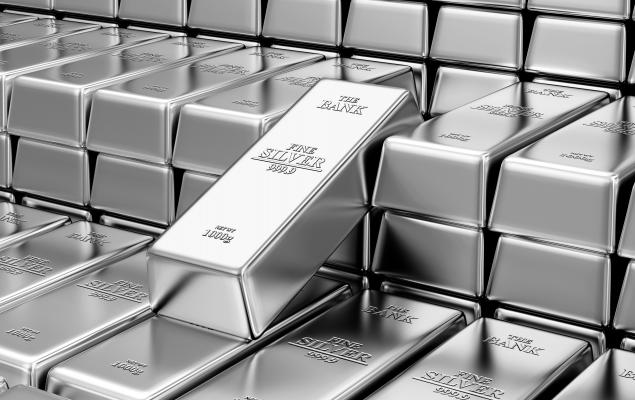
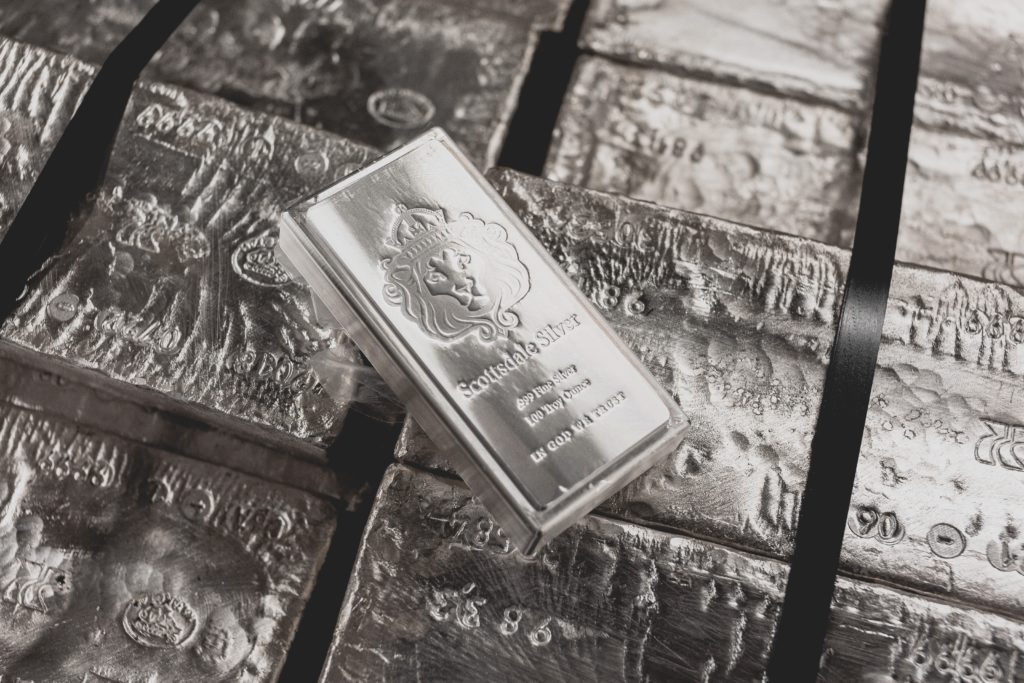
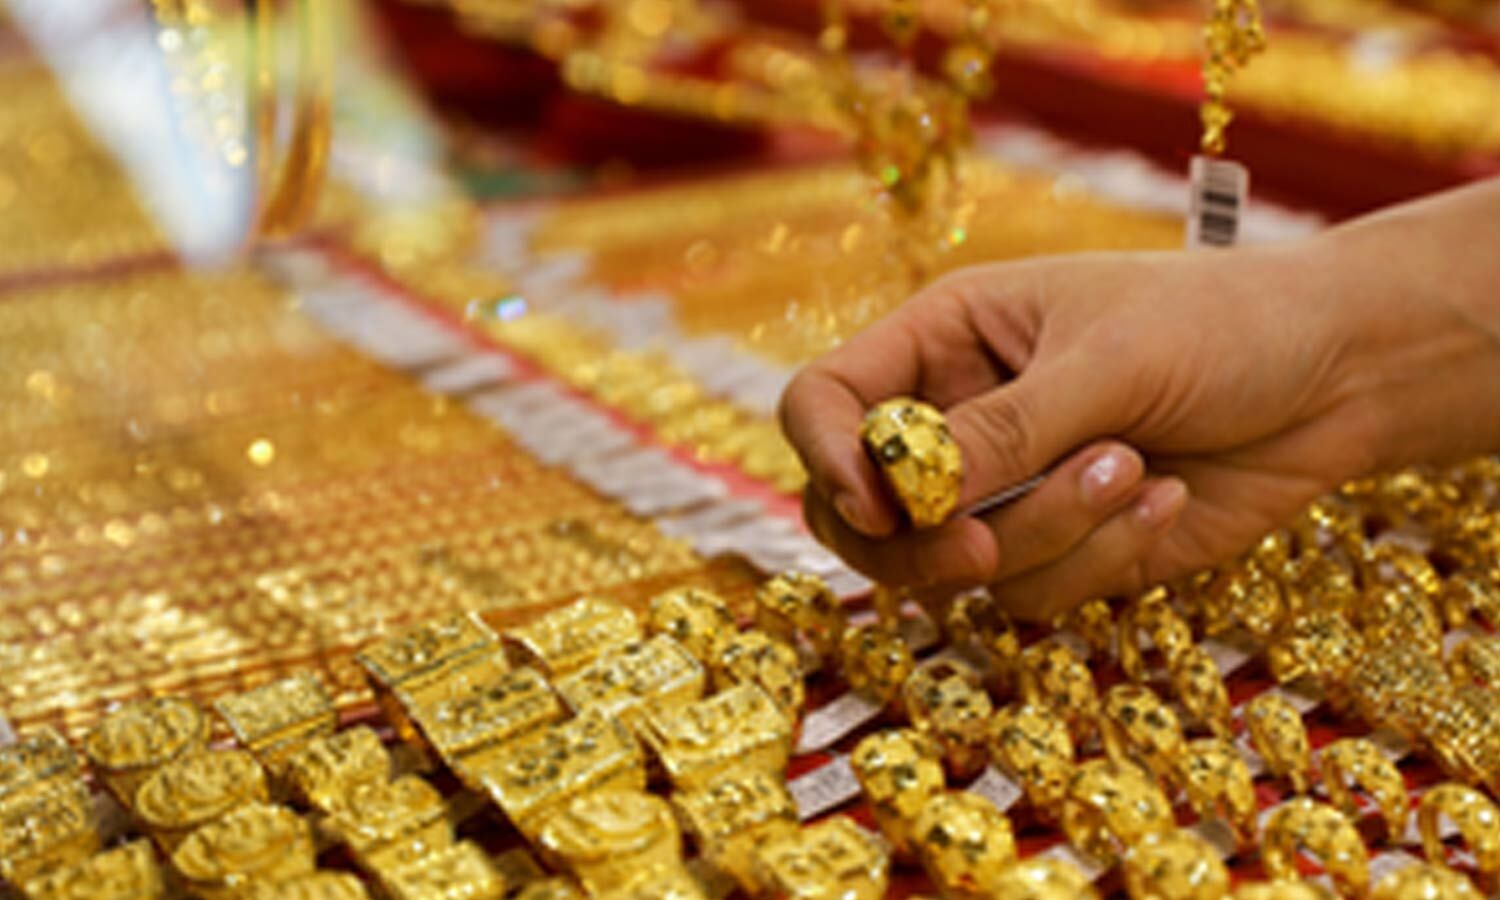
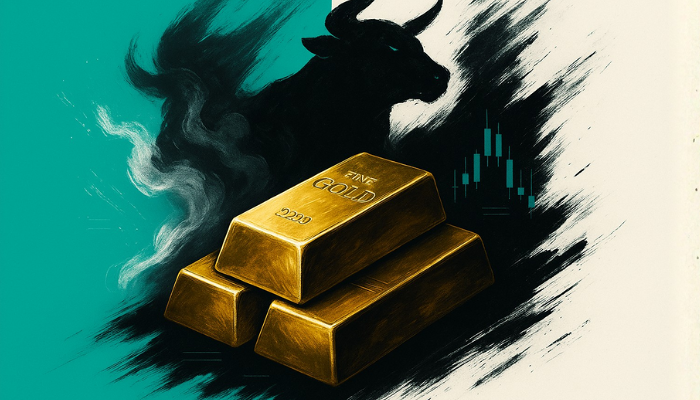
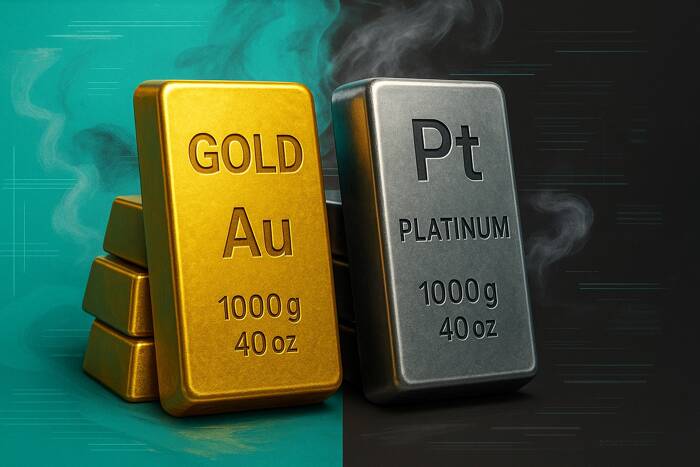
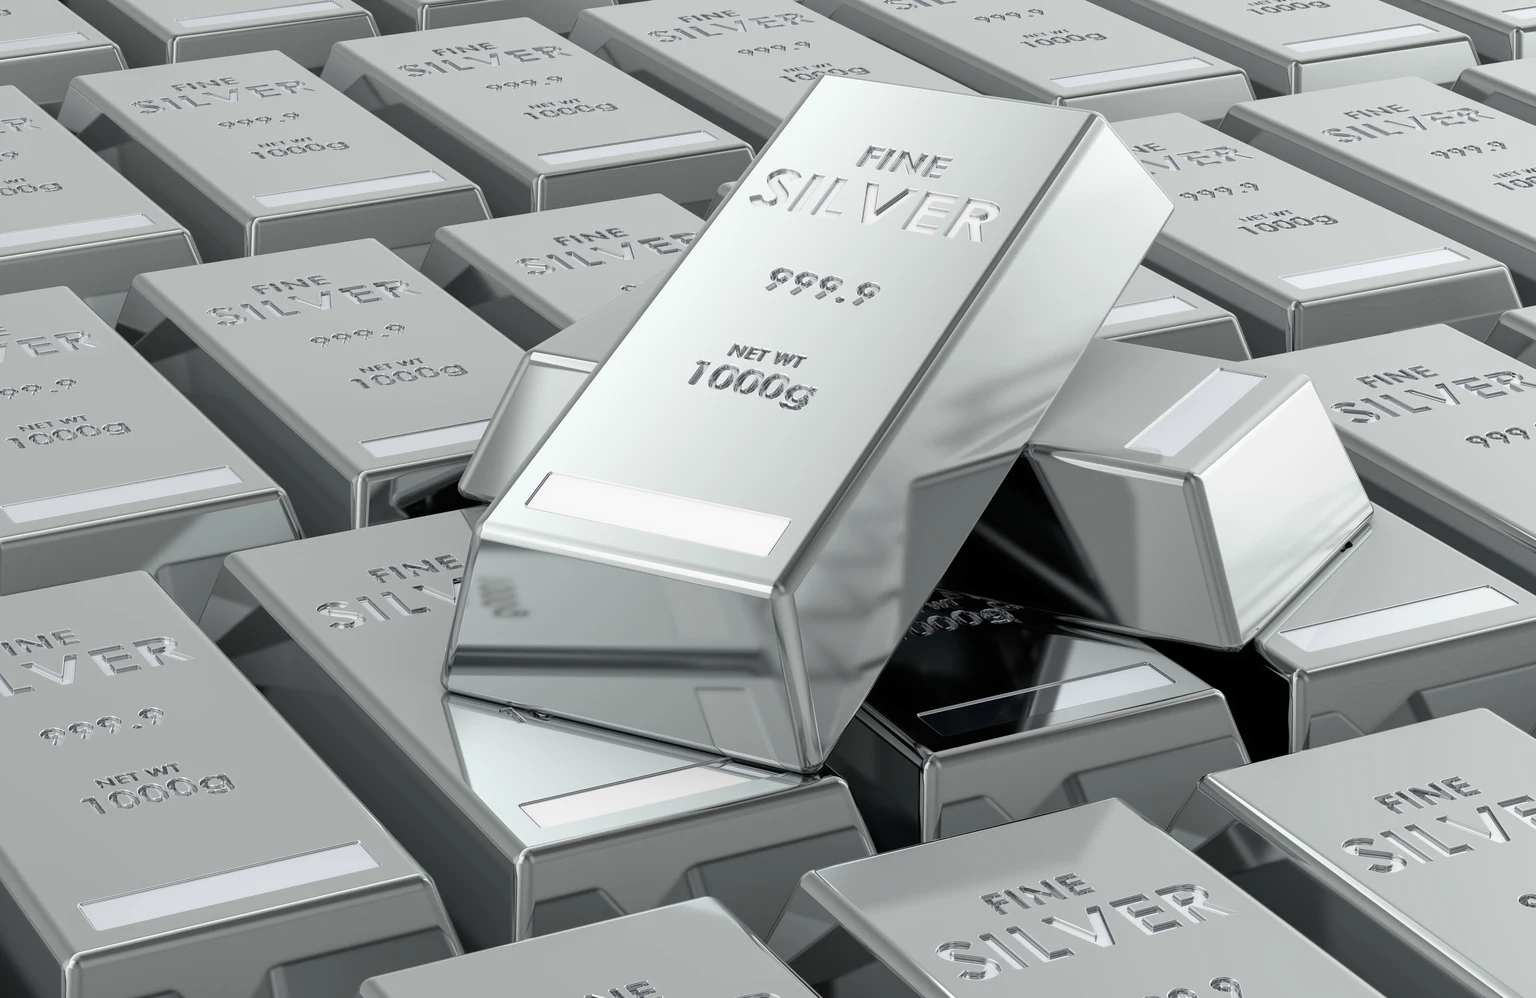
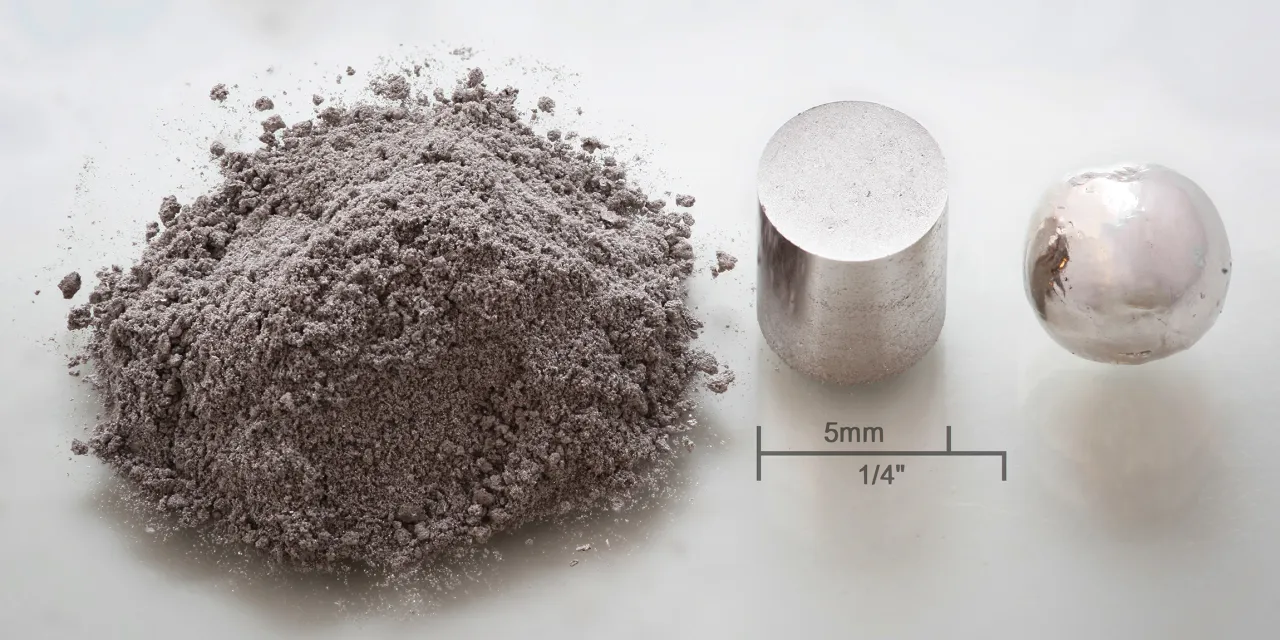
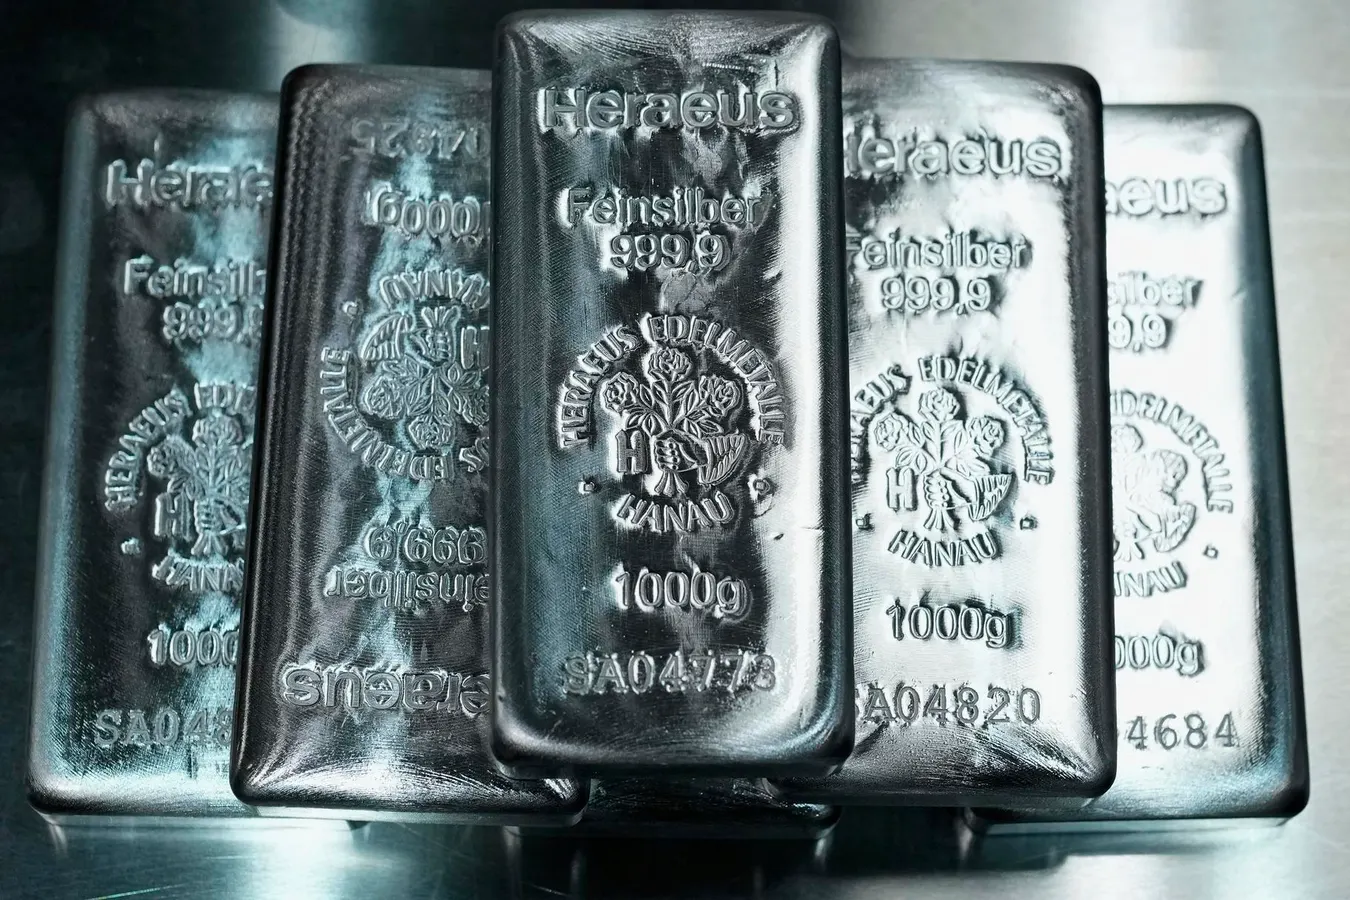
Why Silver Specifically, and Not Just Gold
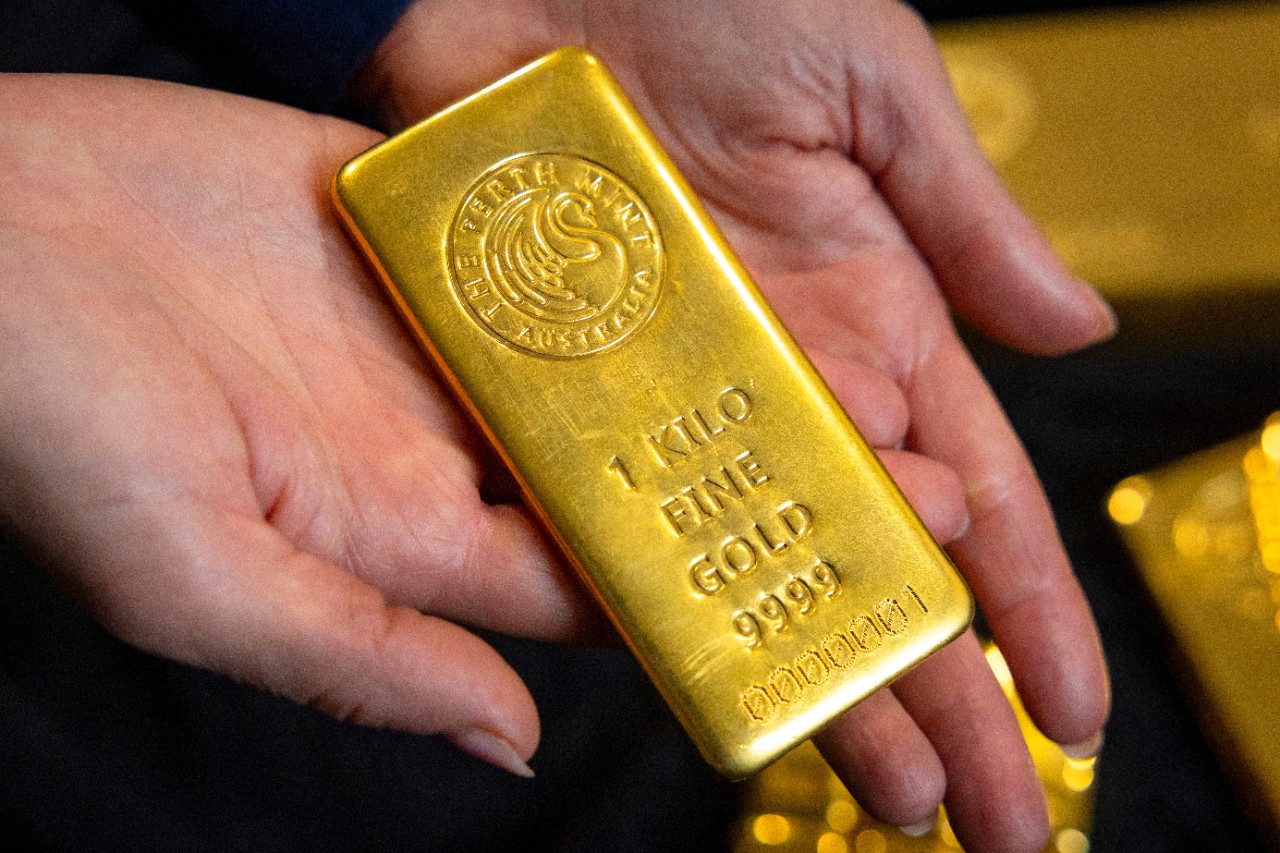
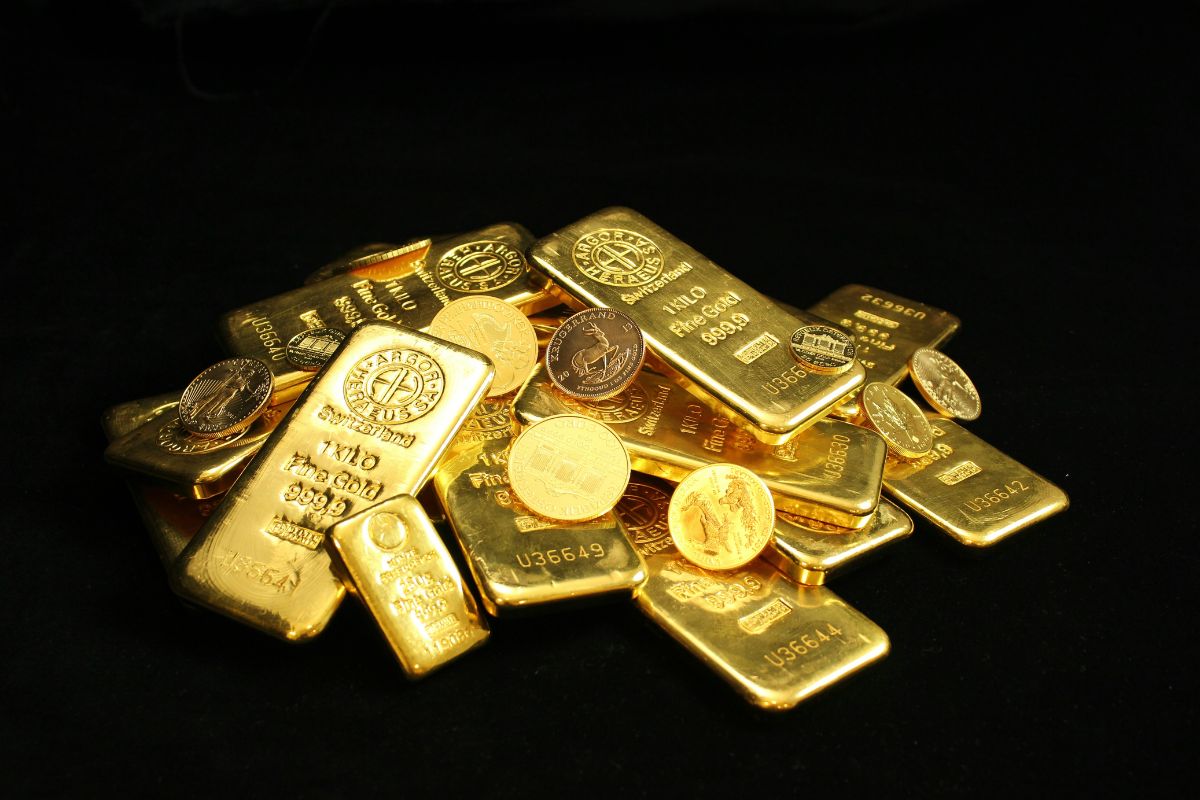
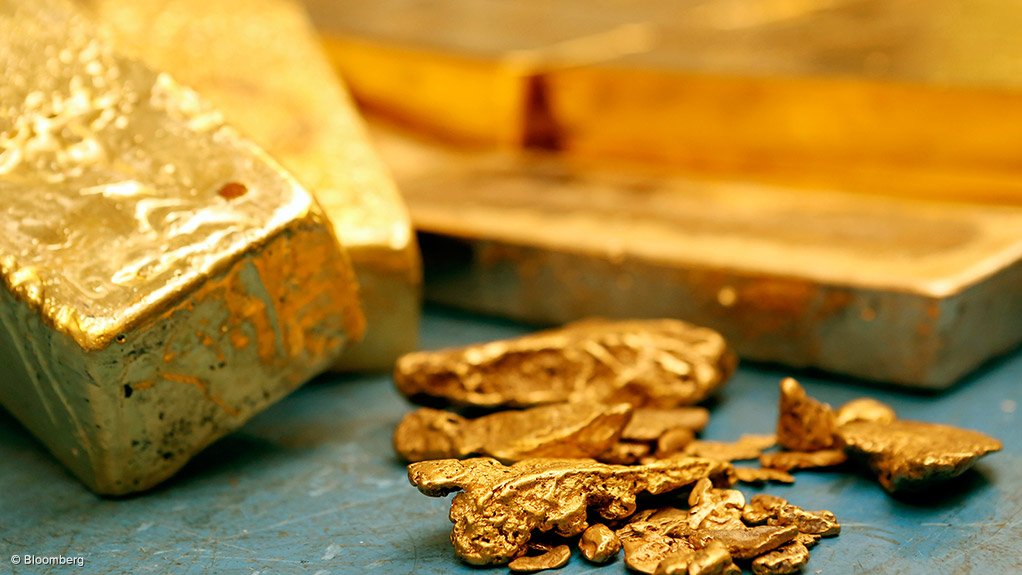
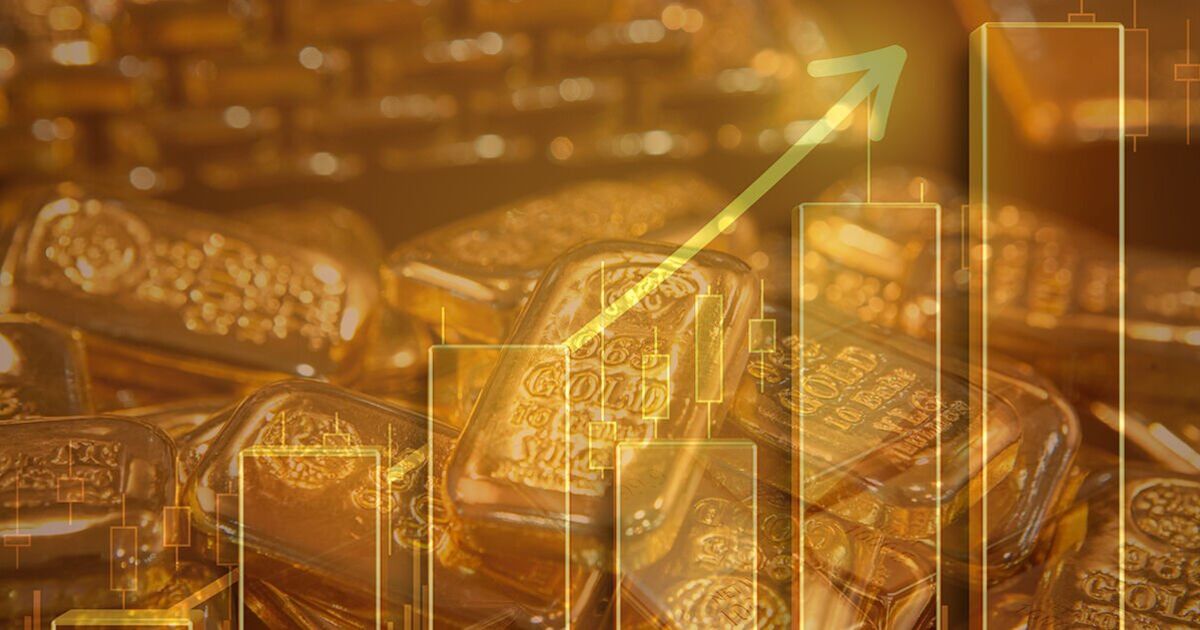
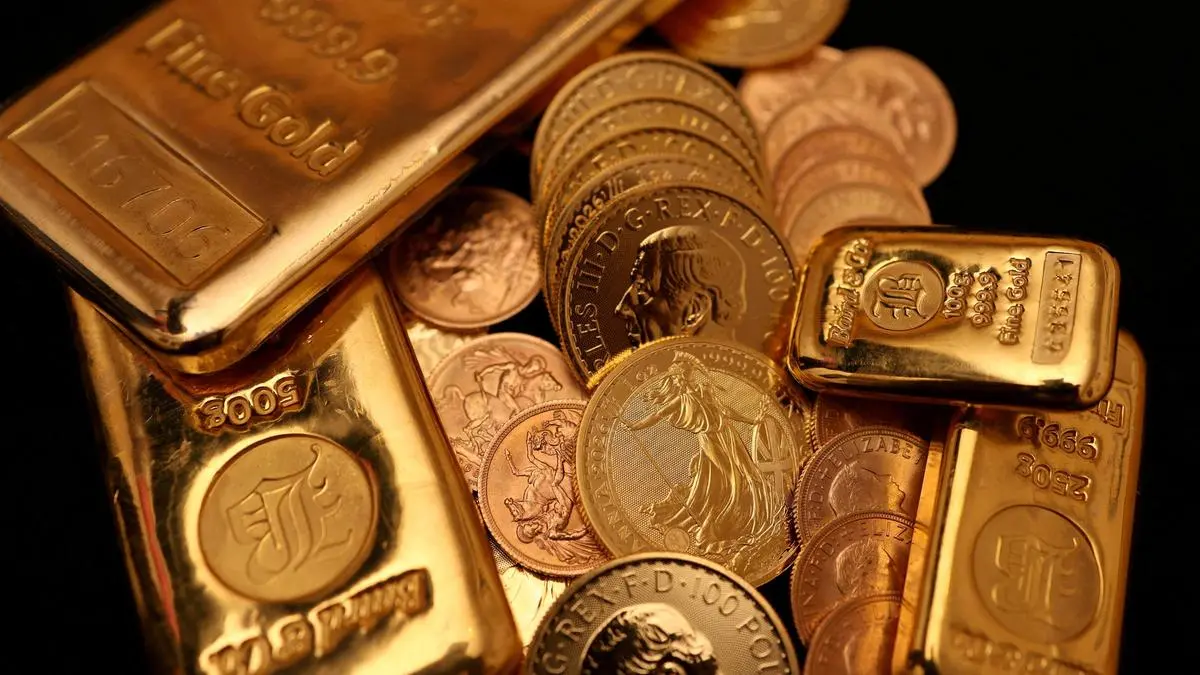
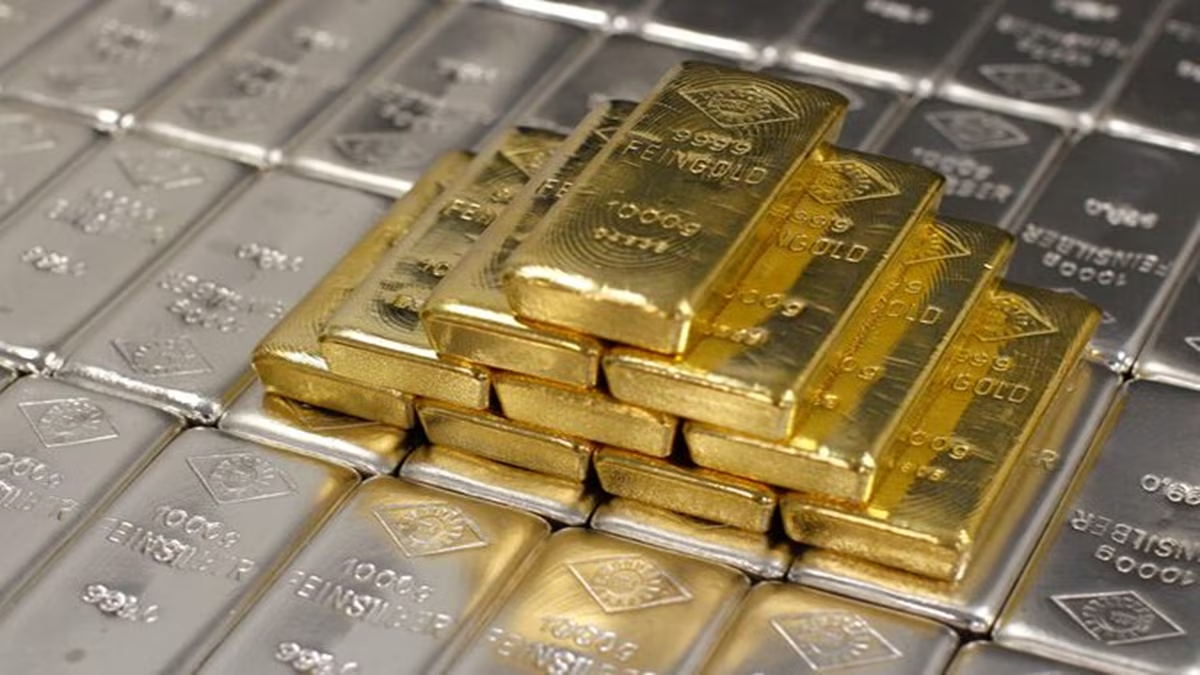
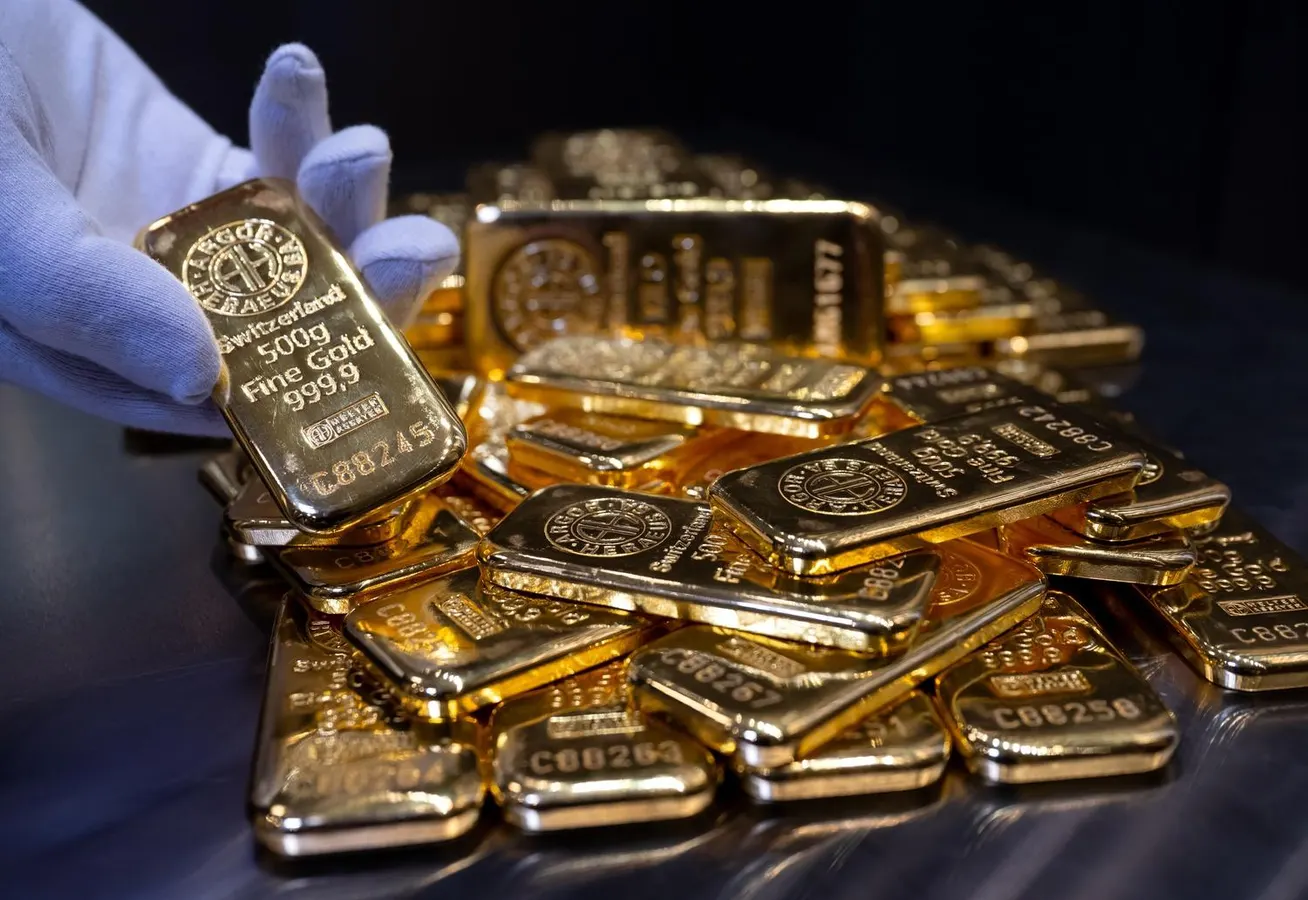
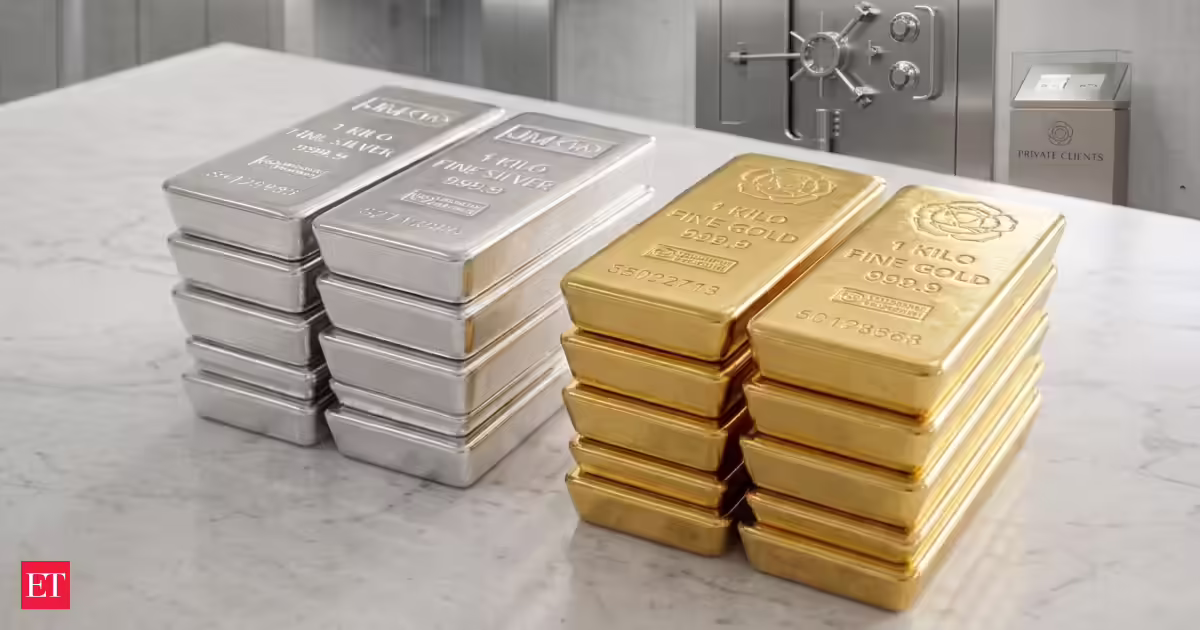
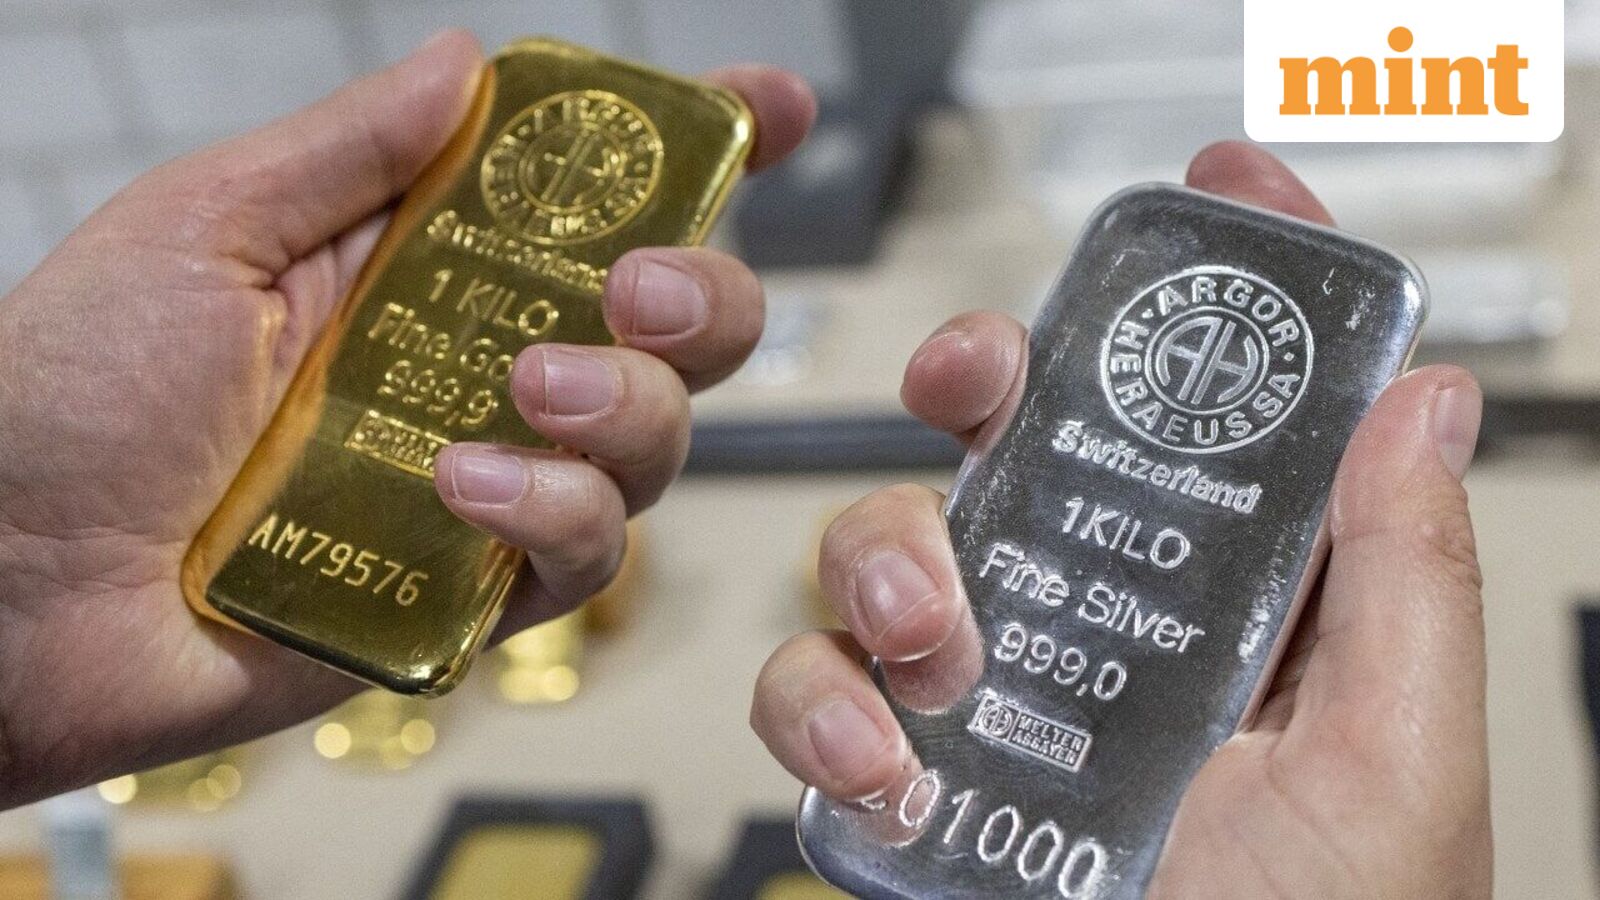
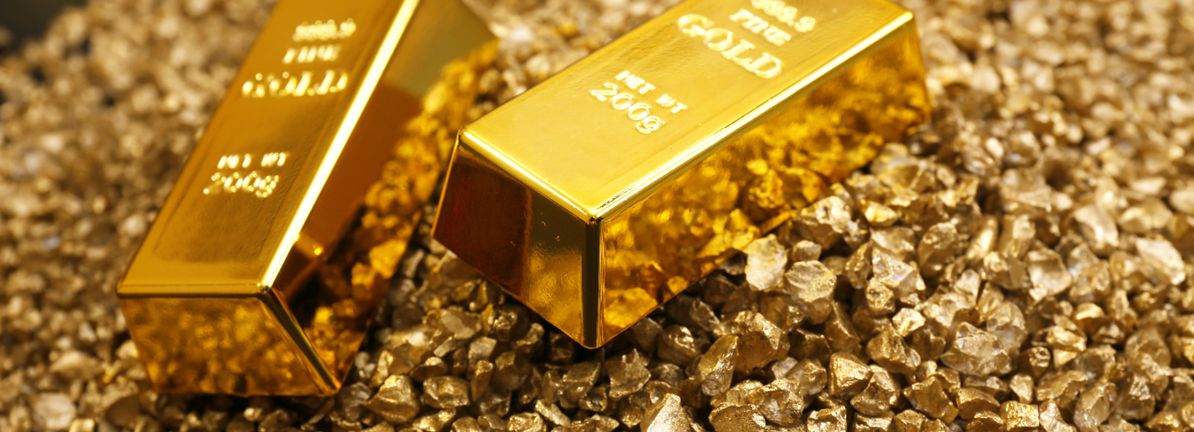
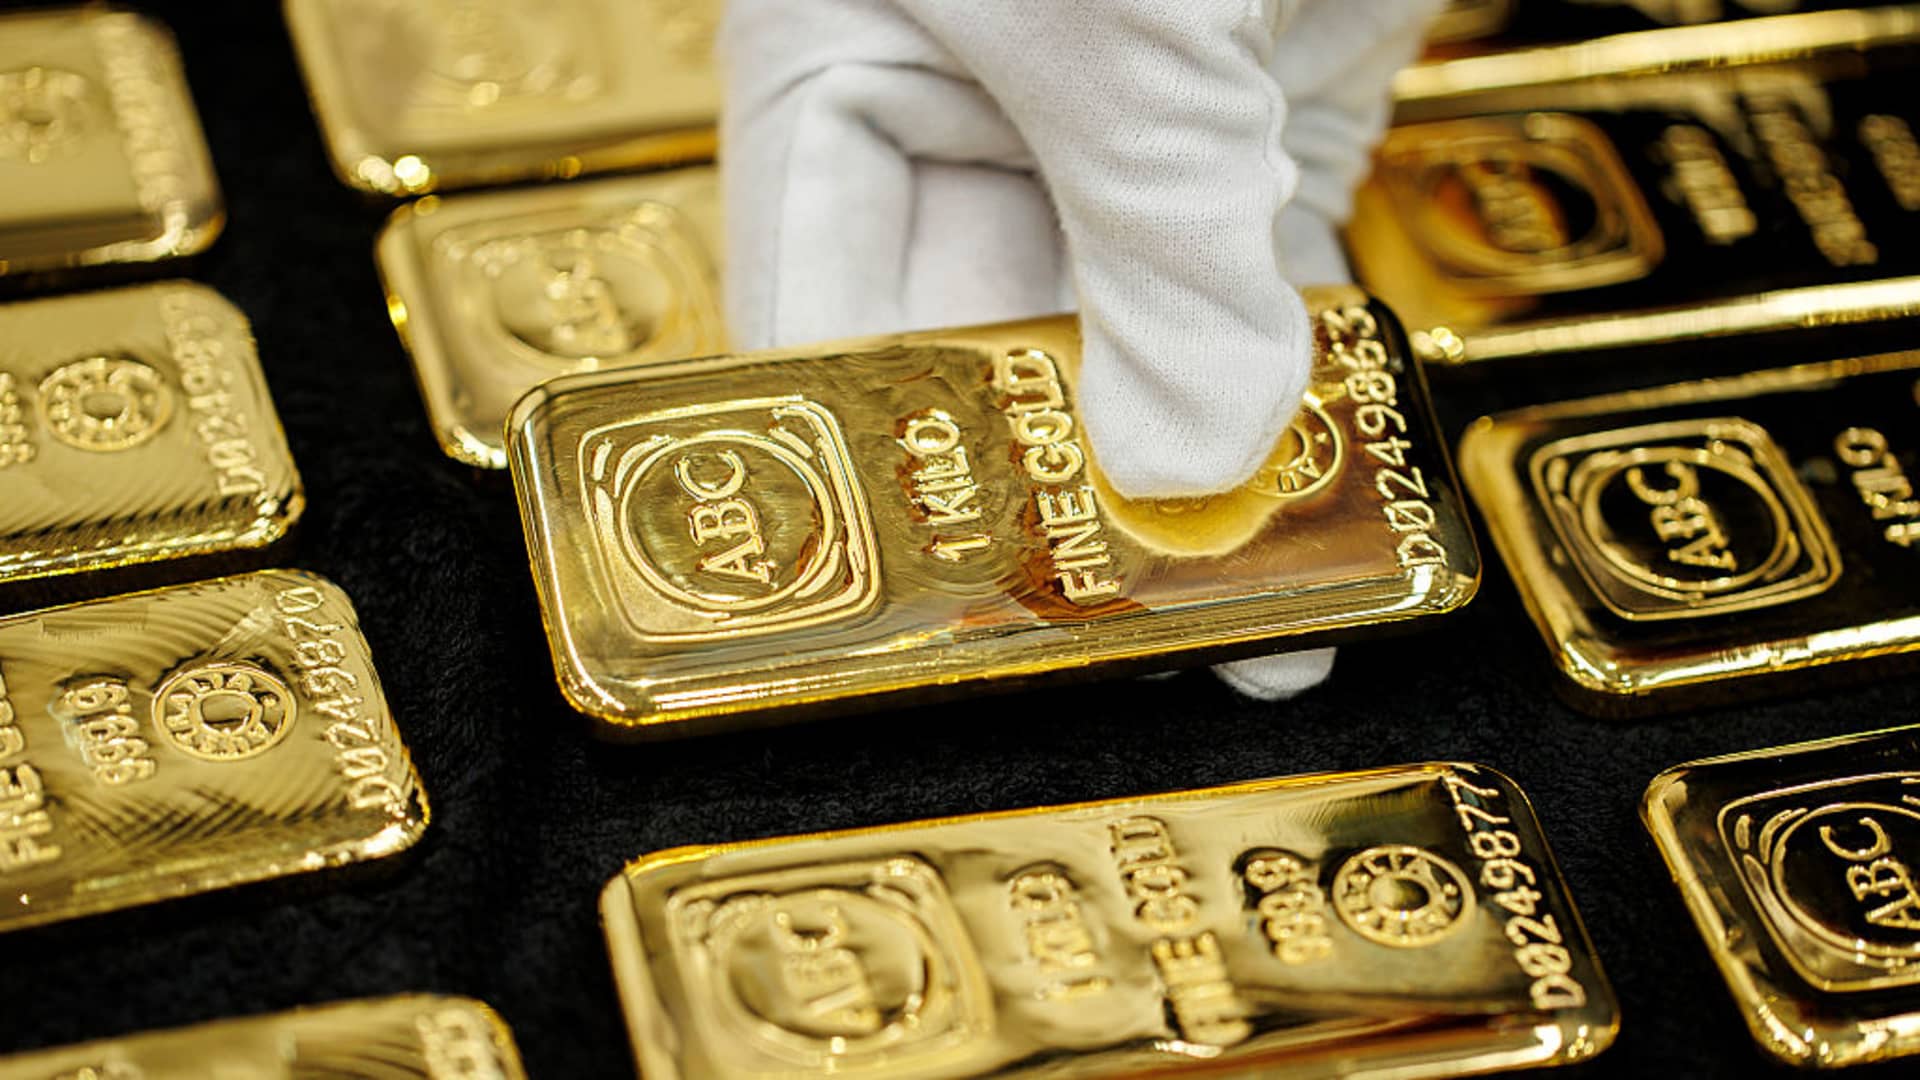
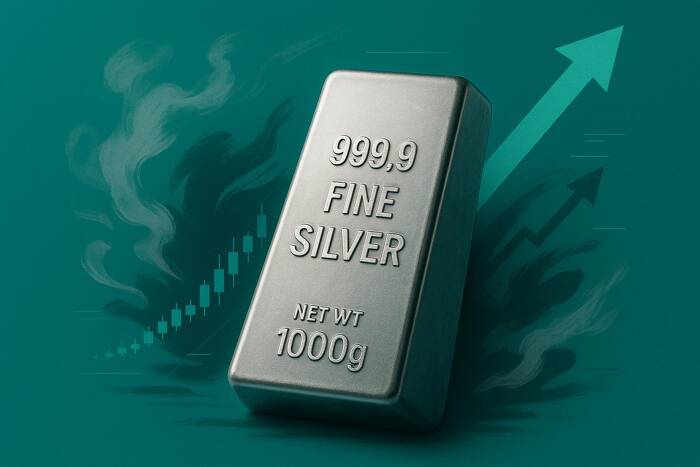
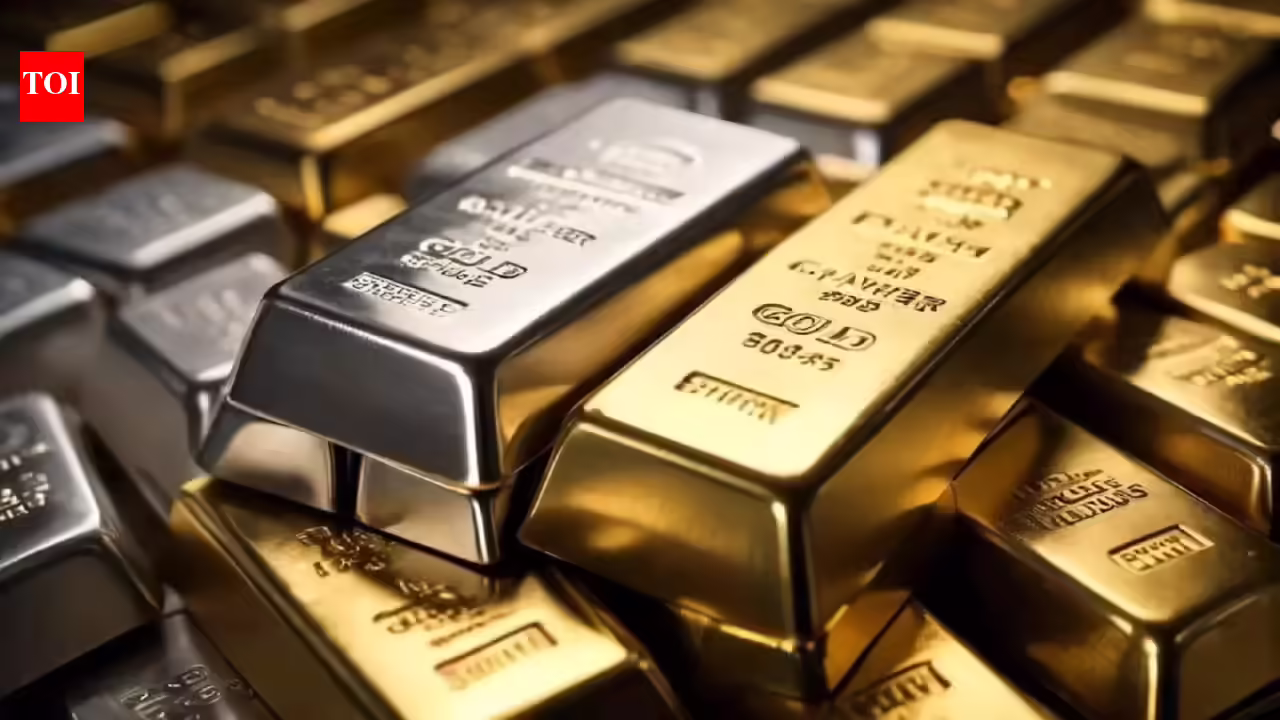
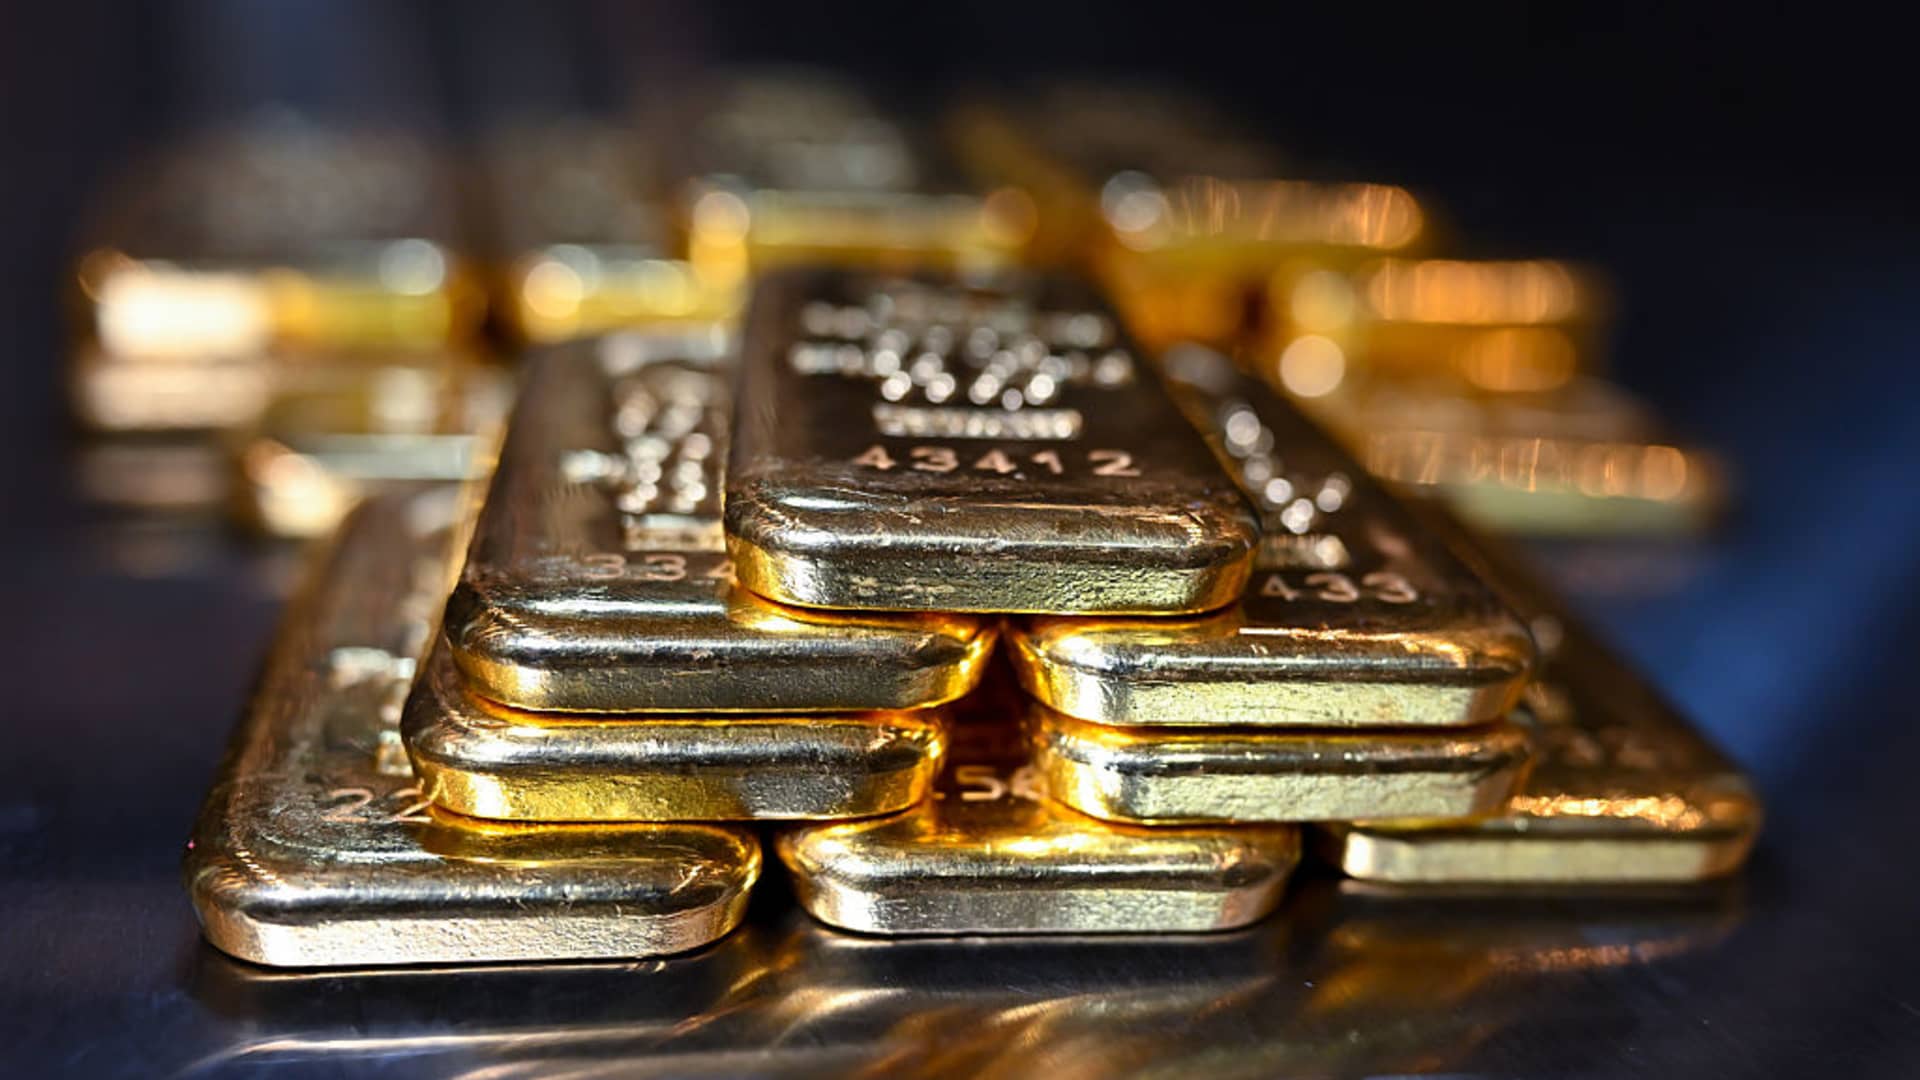
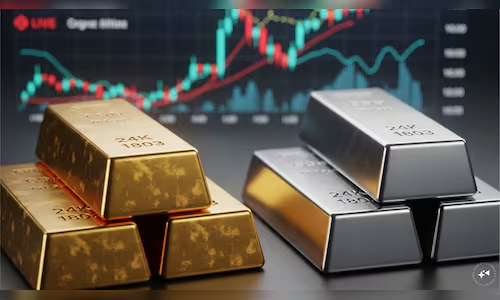
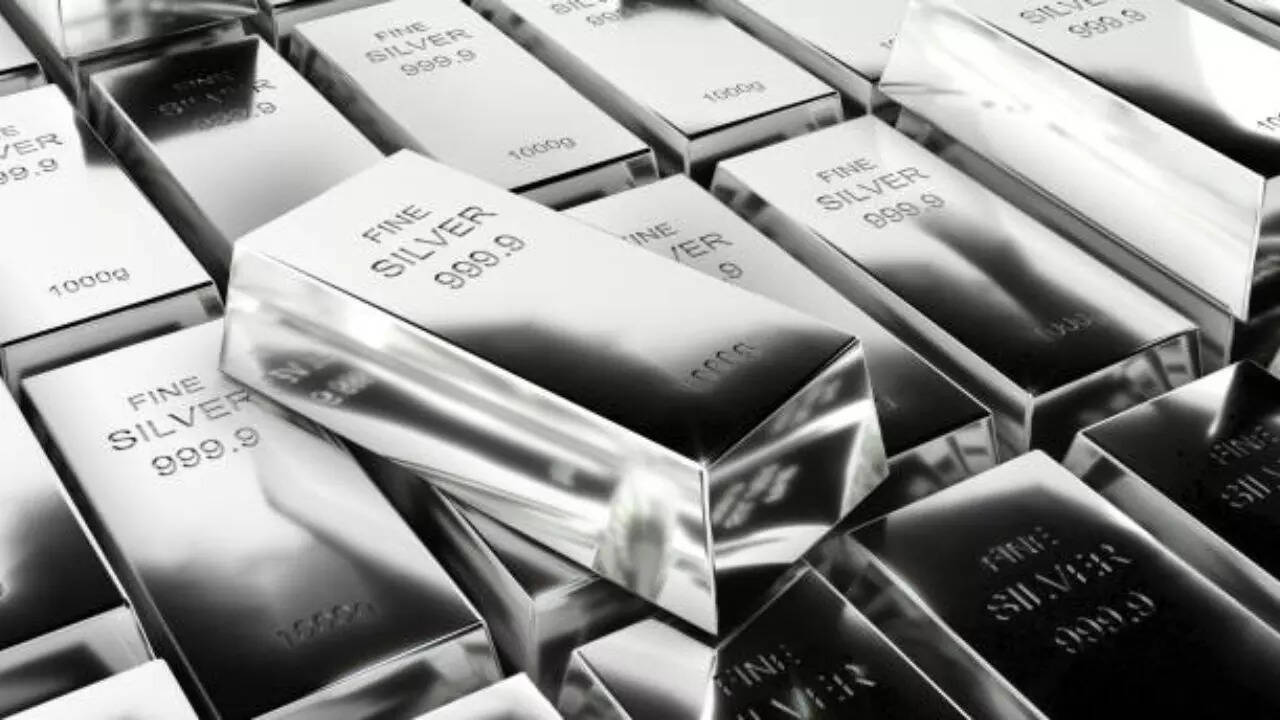
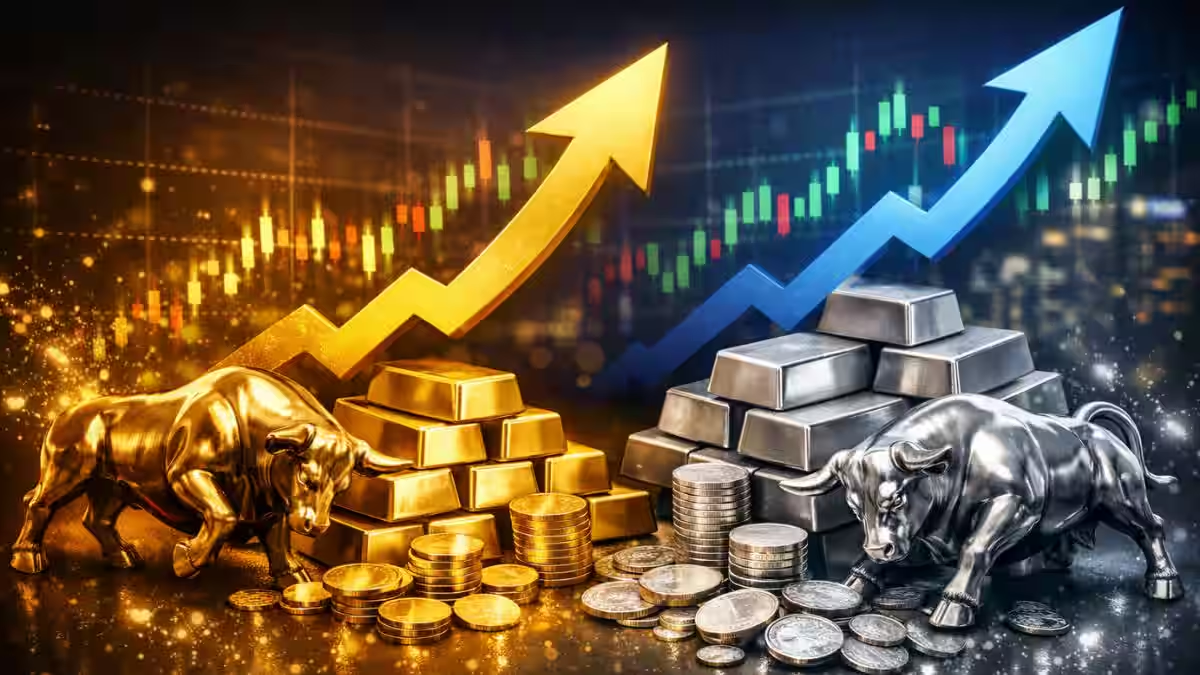
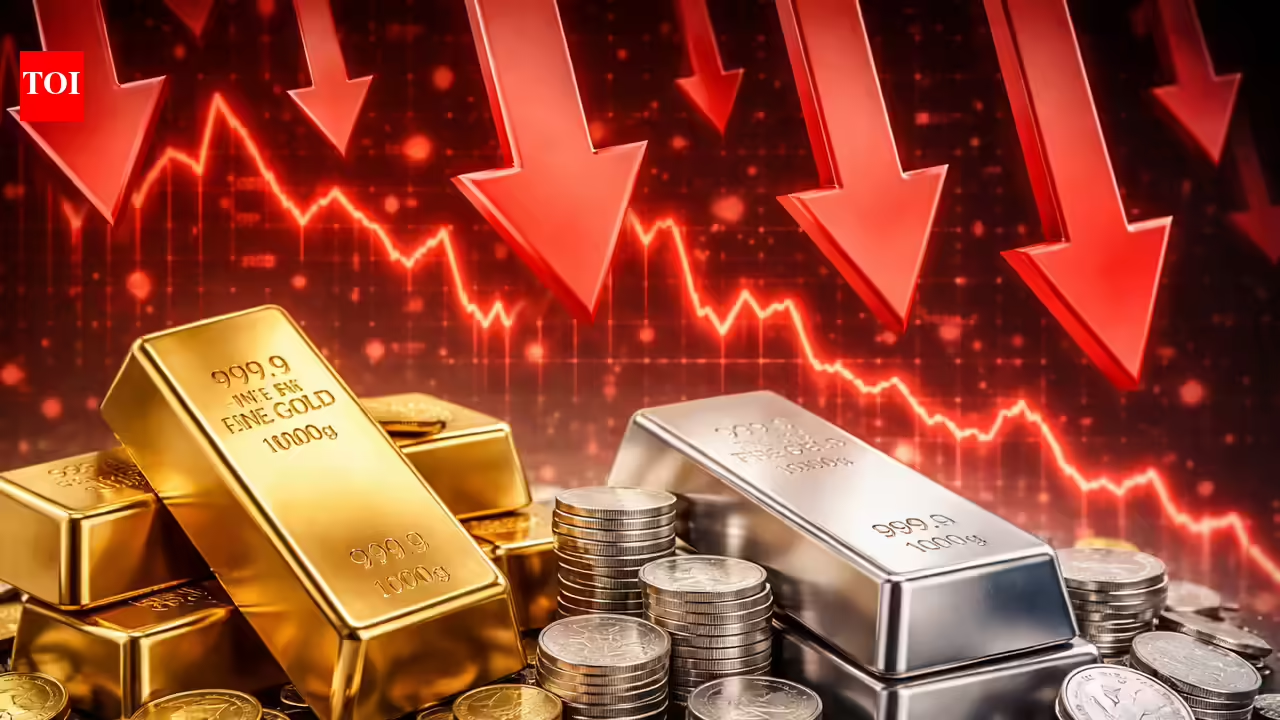
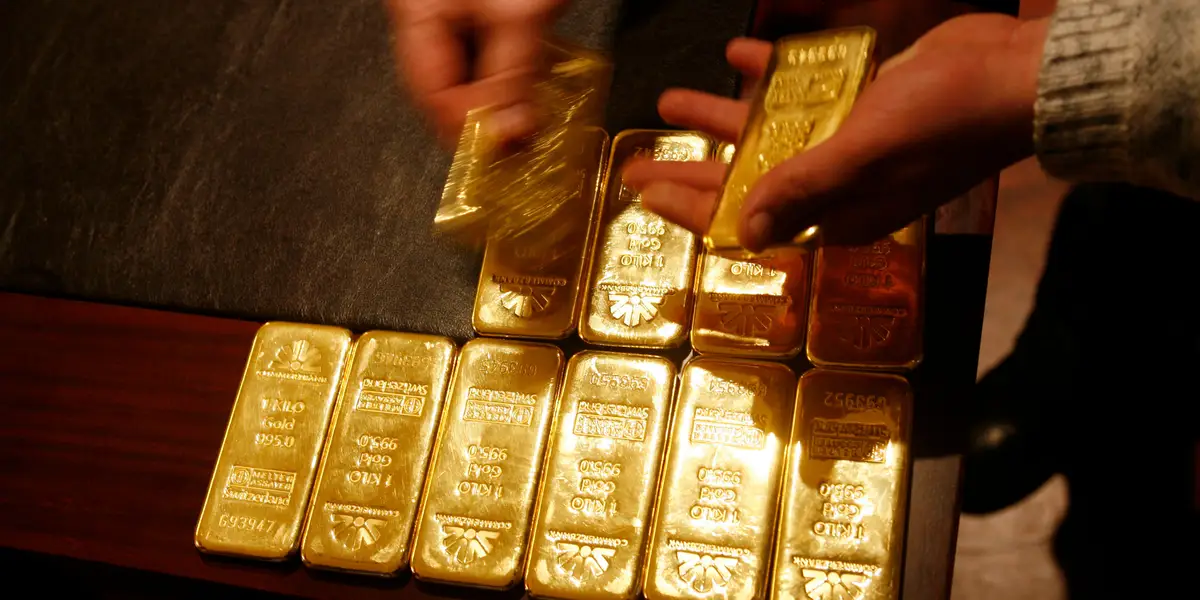
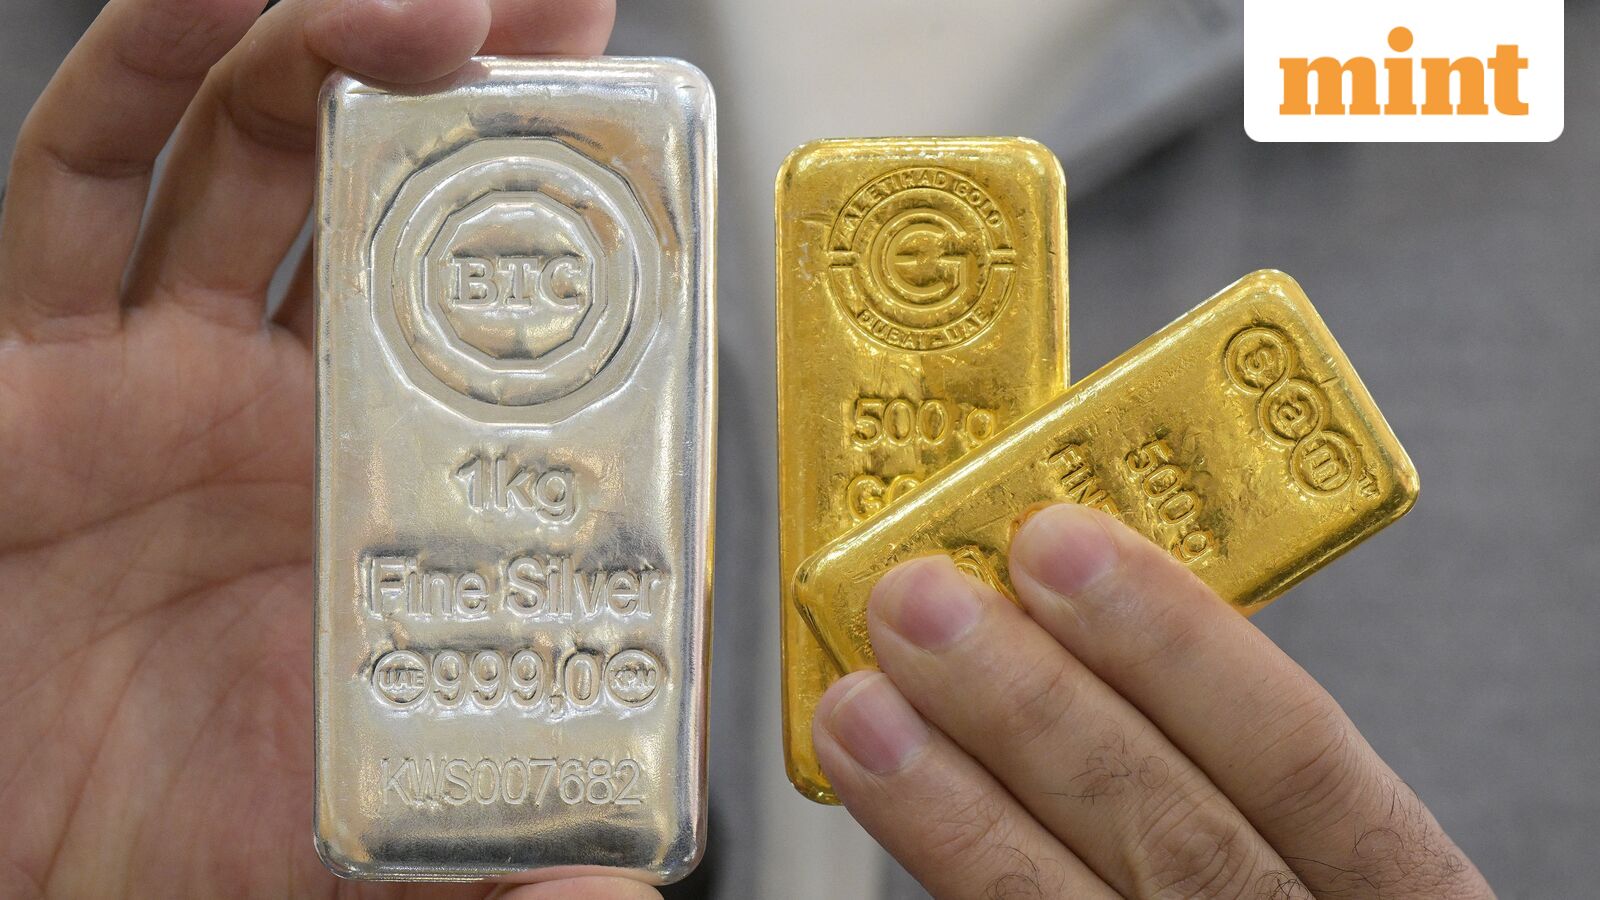
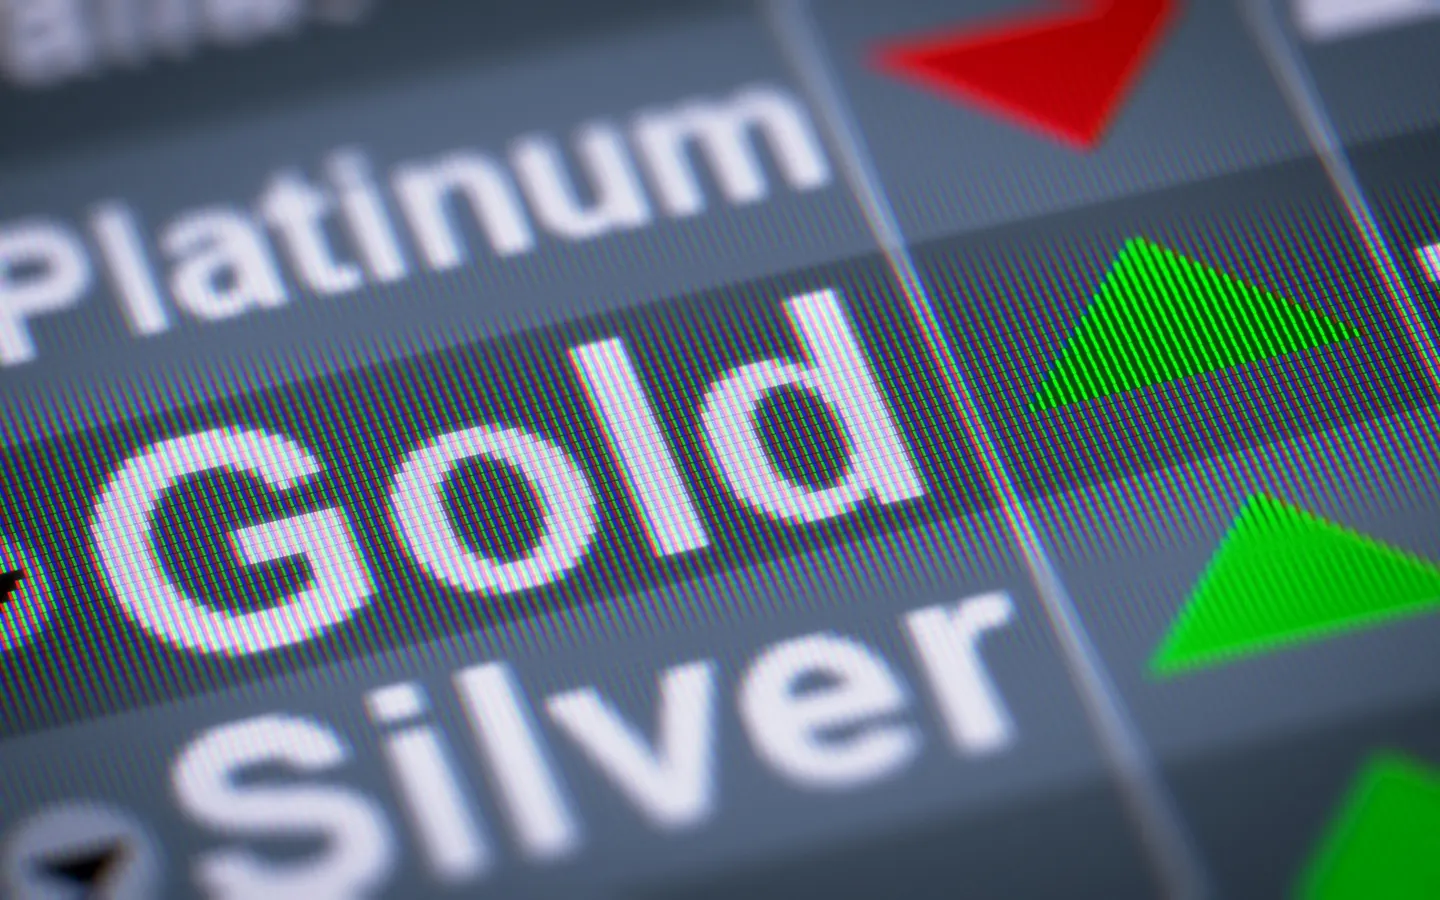
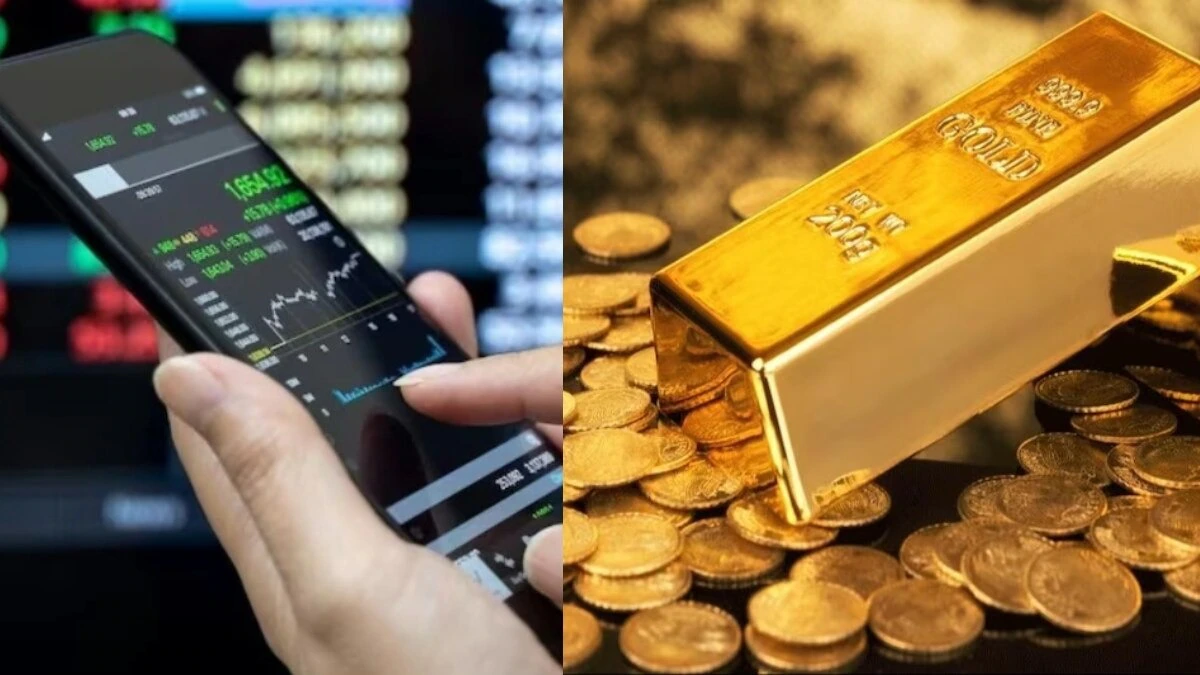
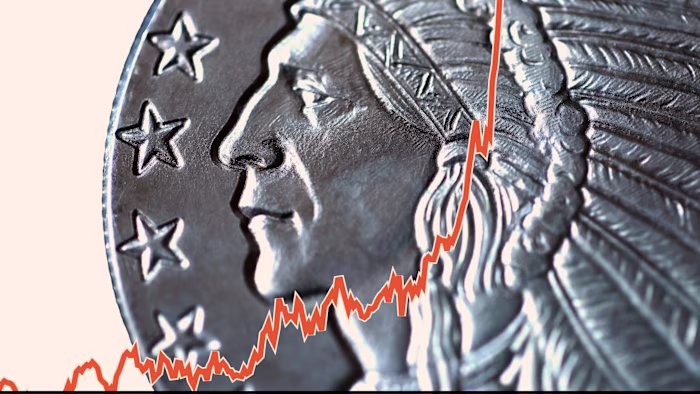
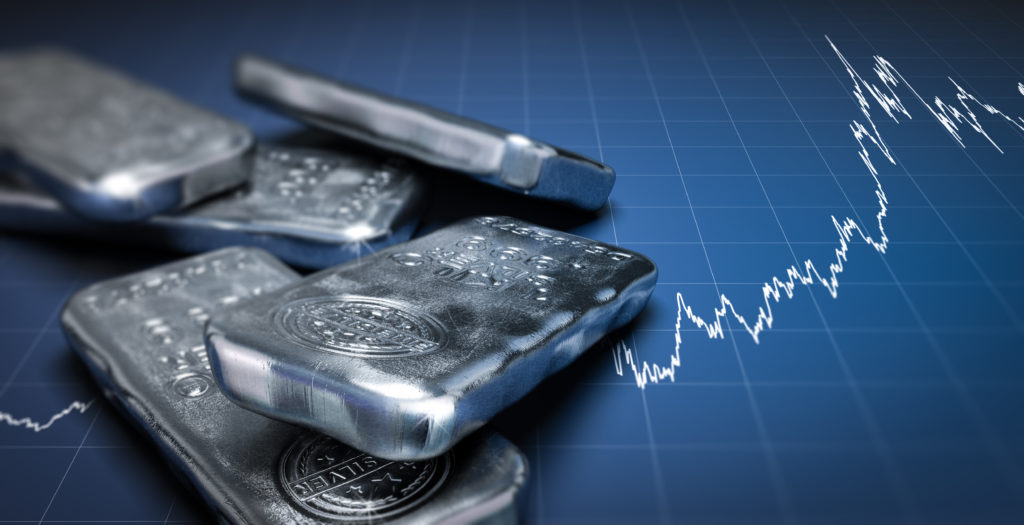
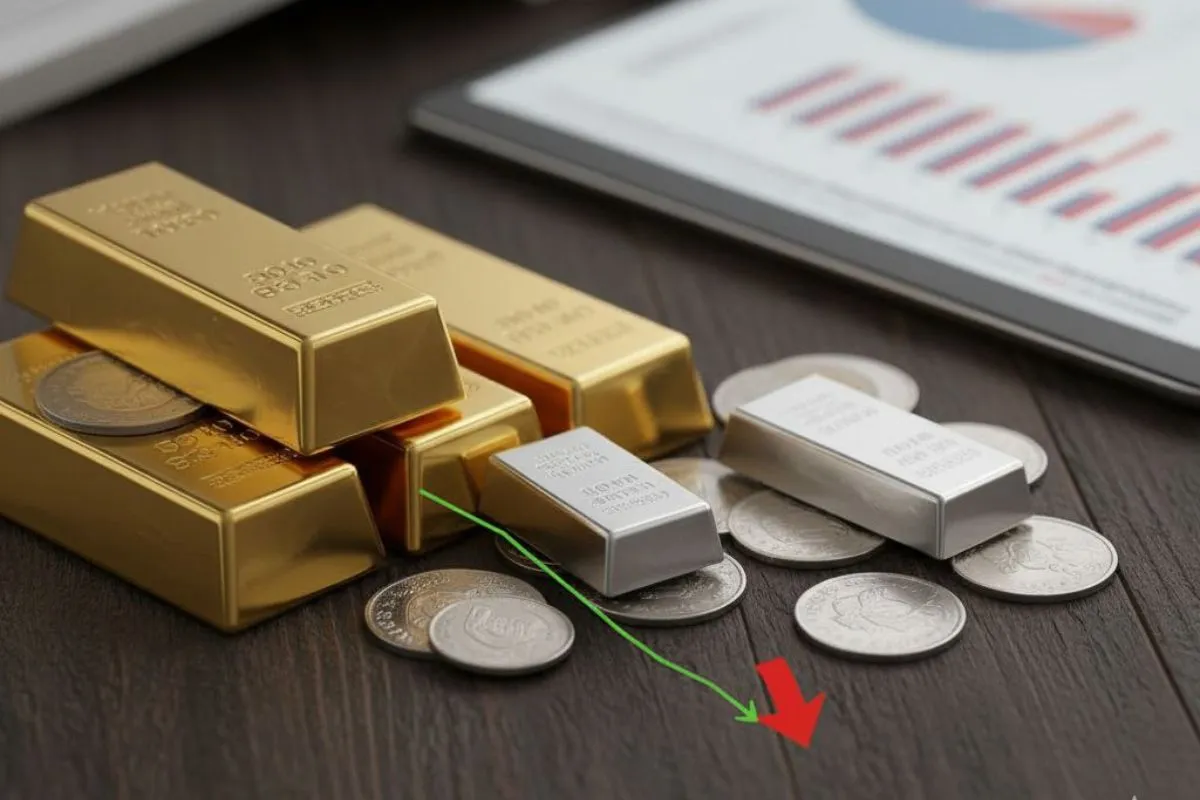
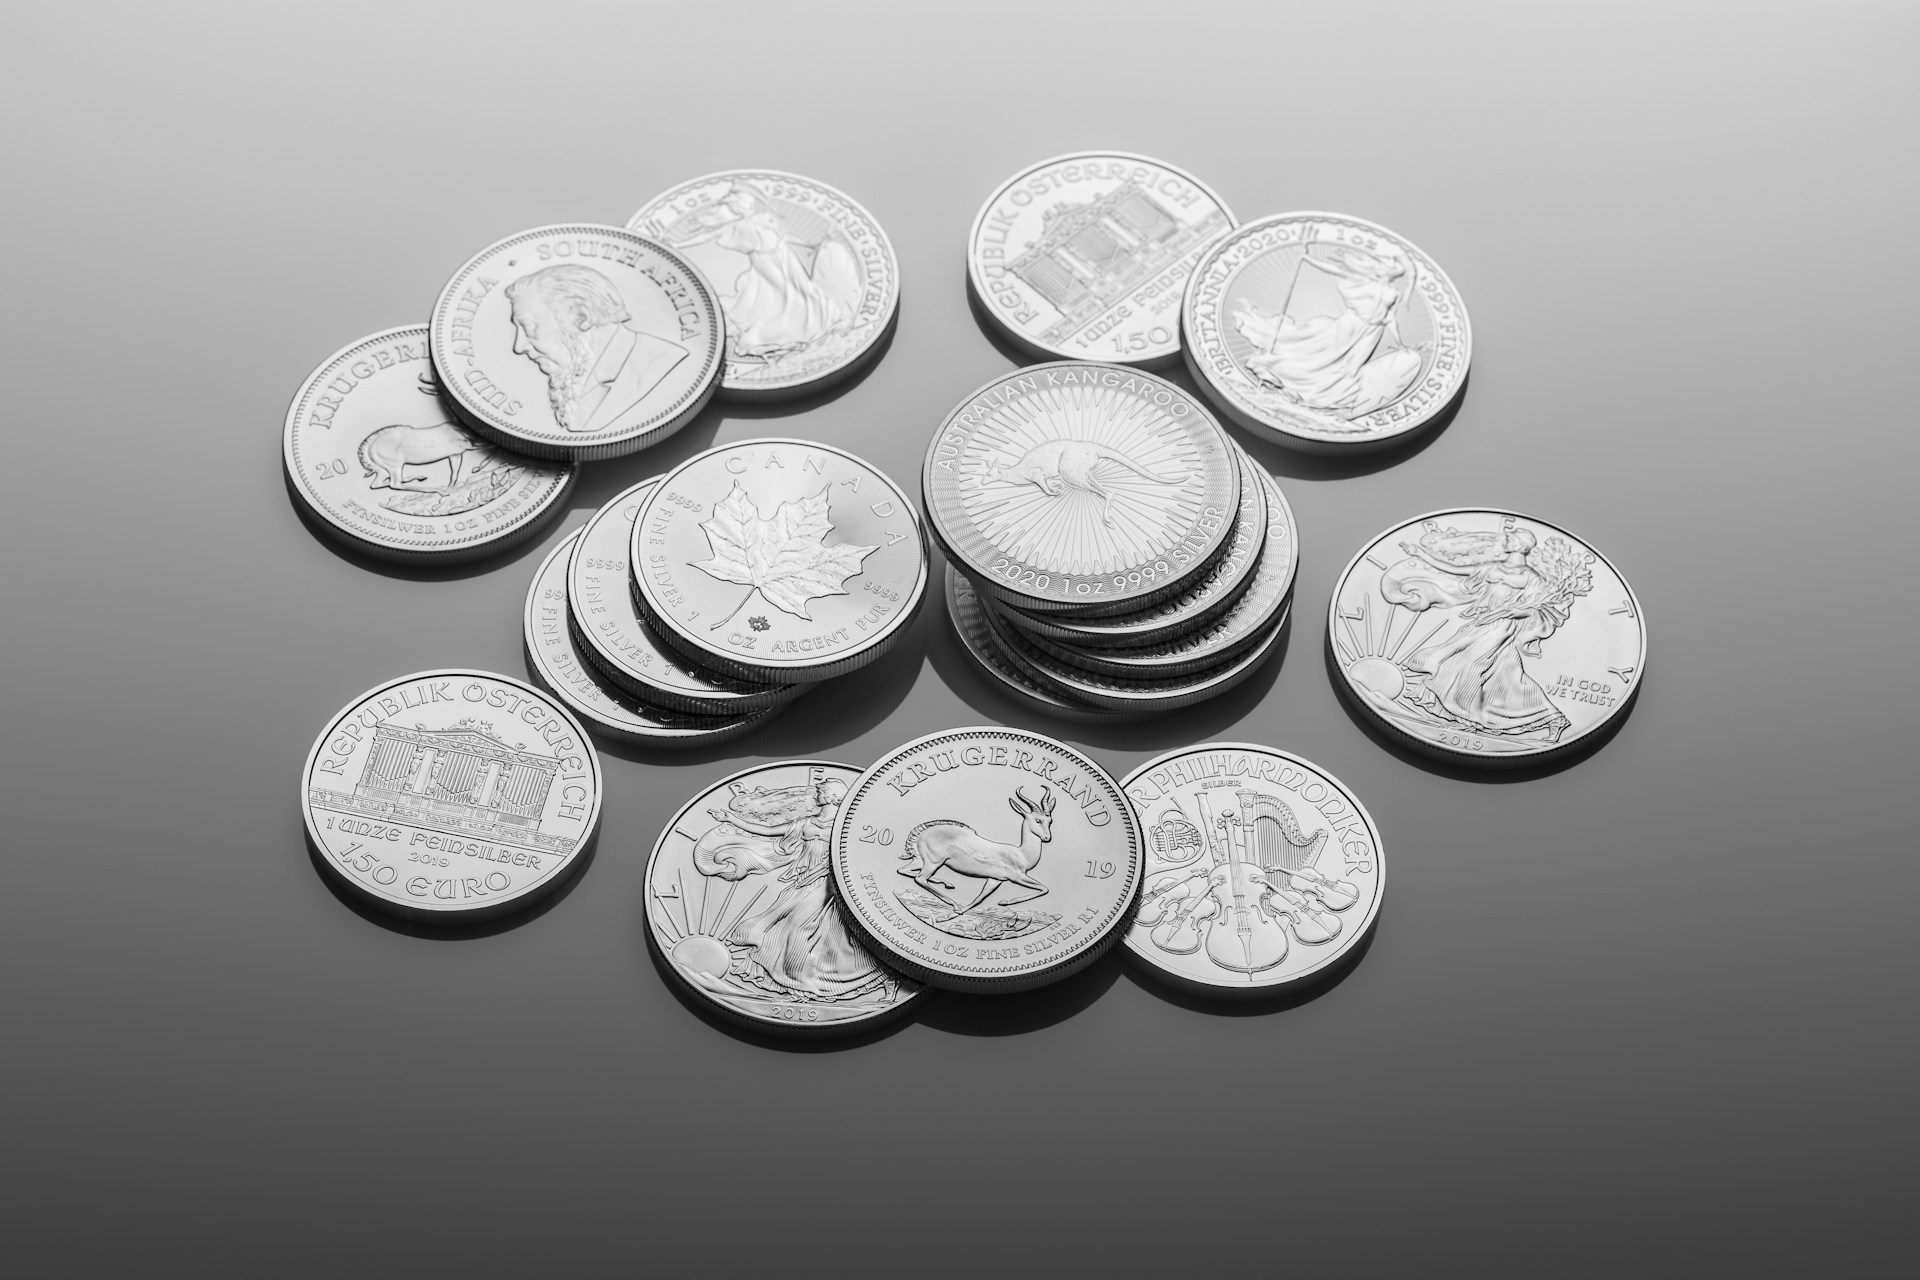
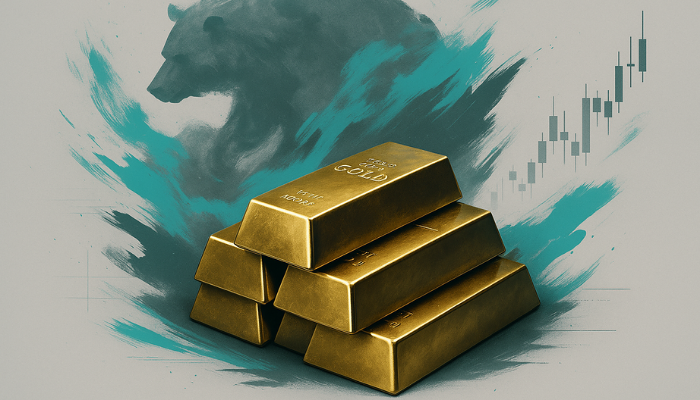
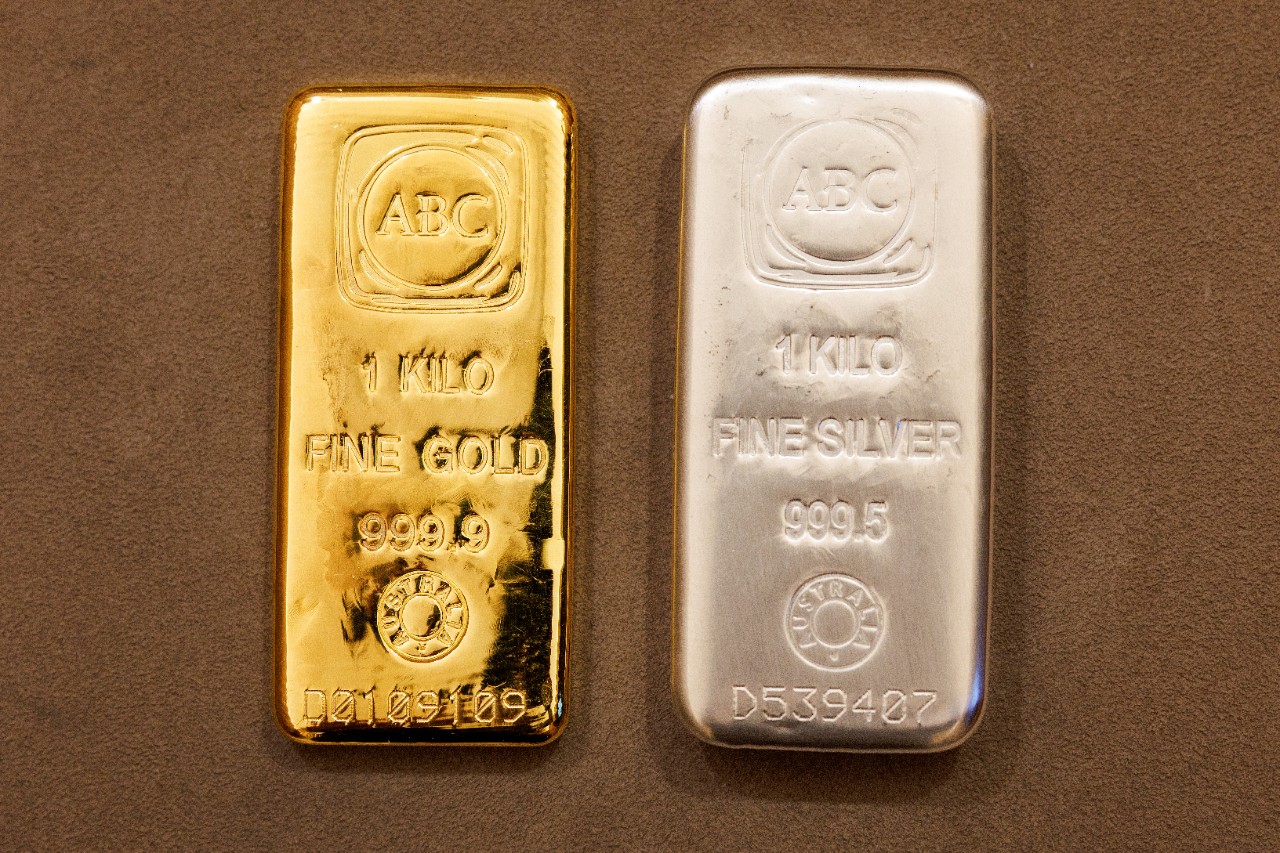
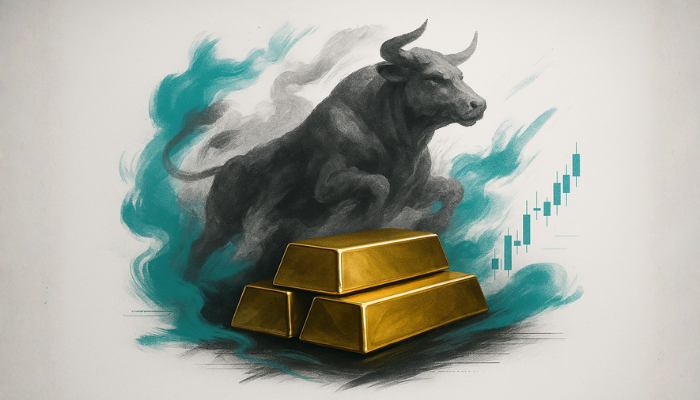
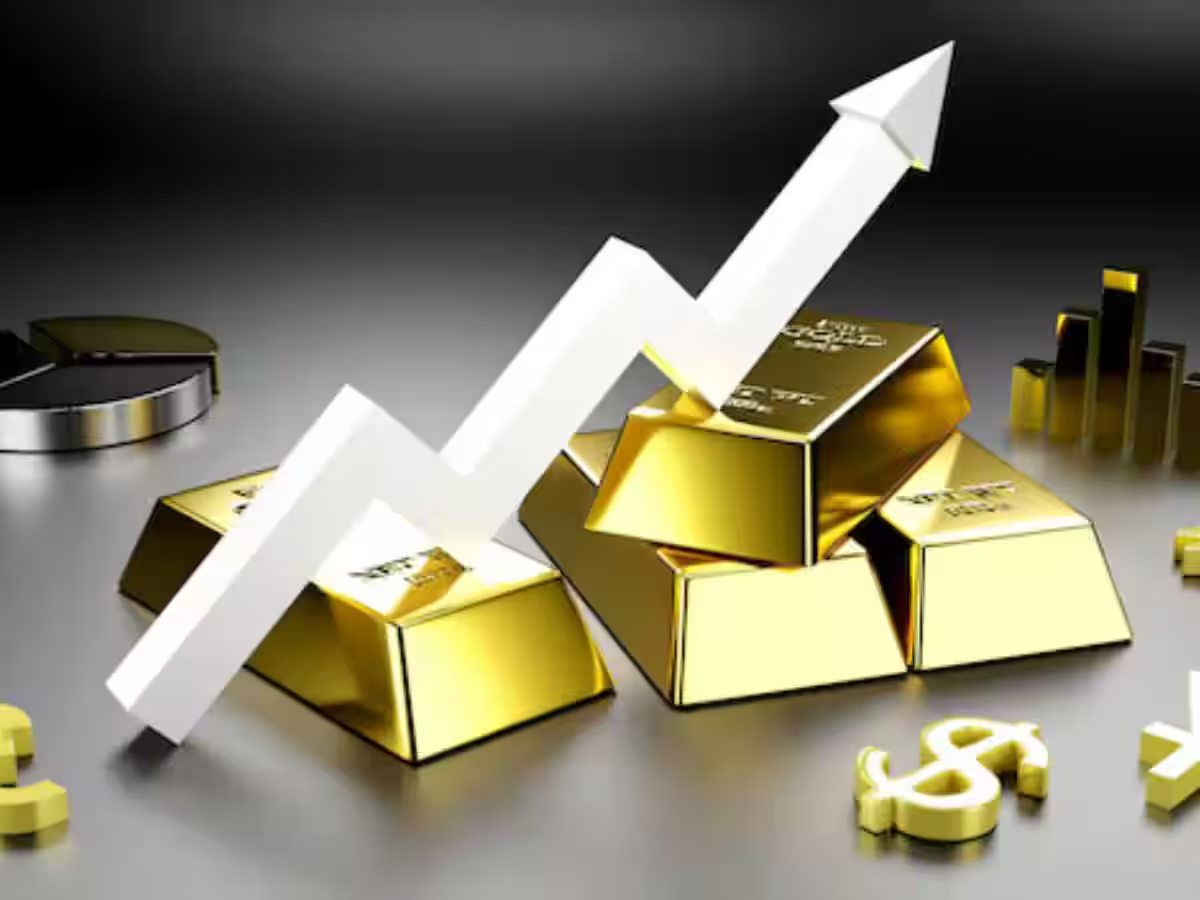
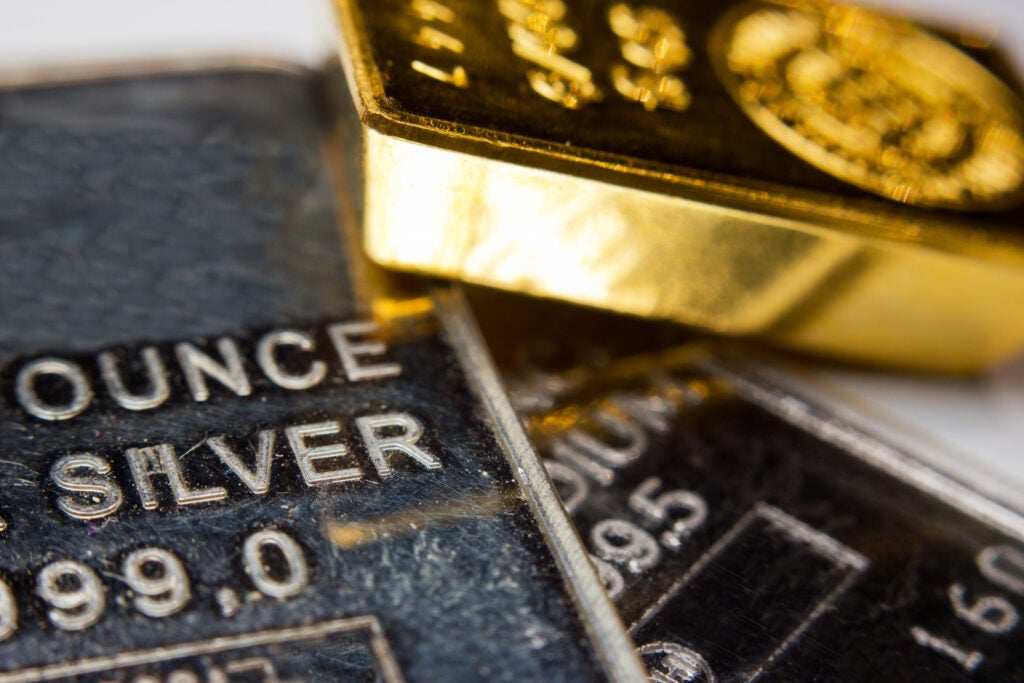
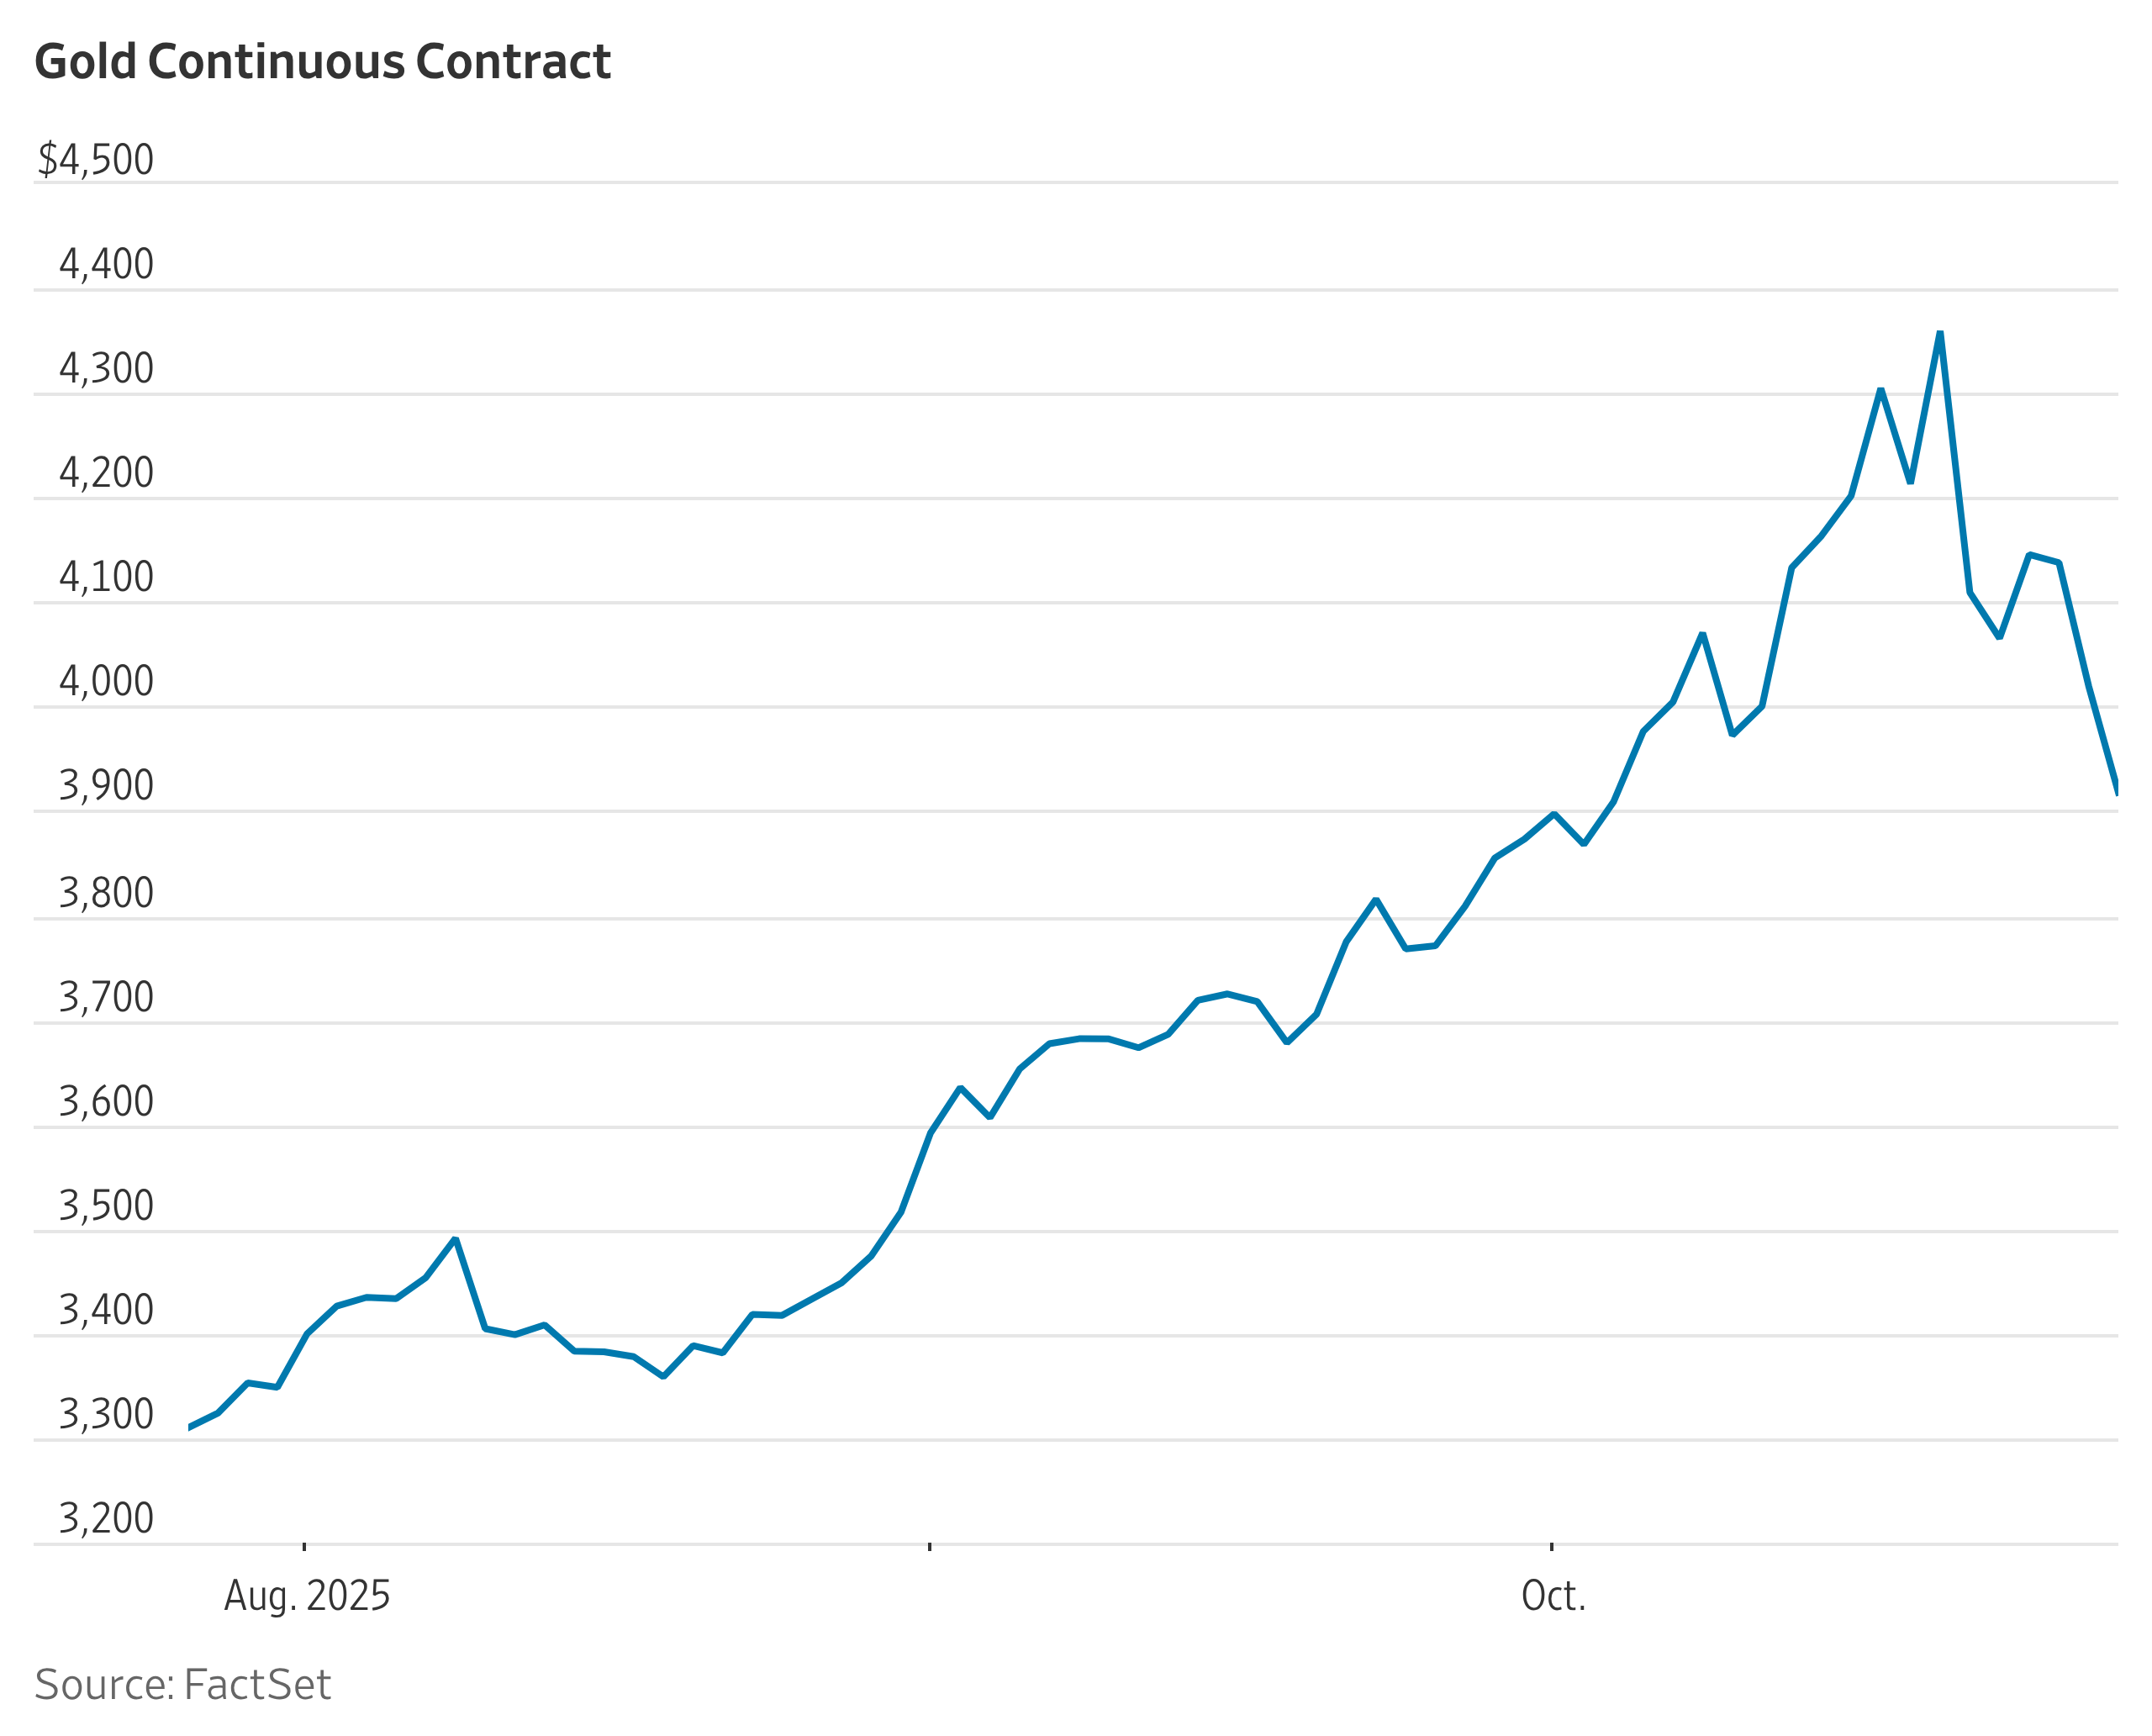
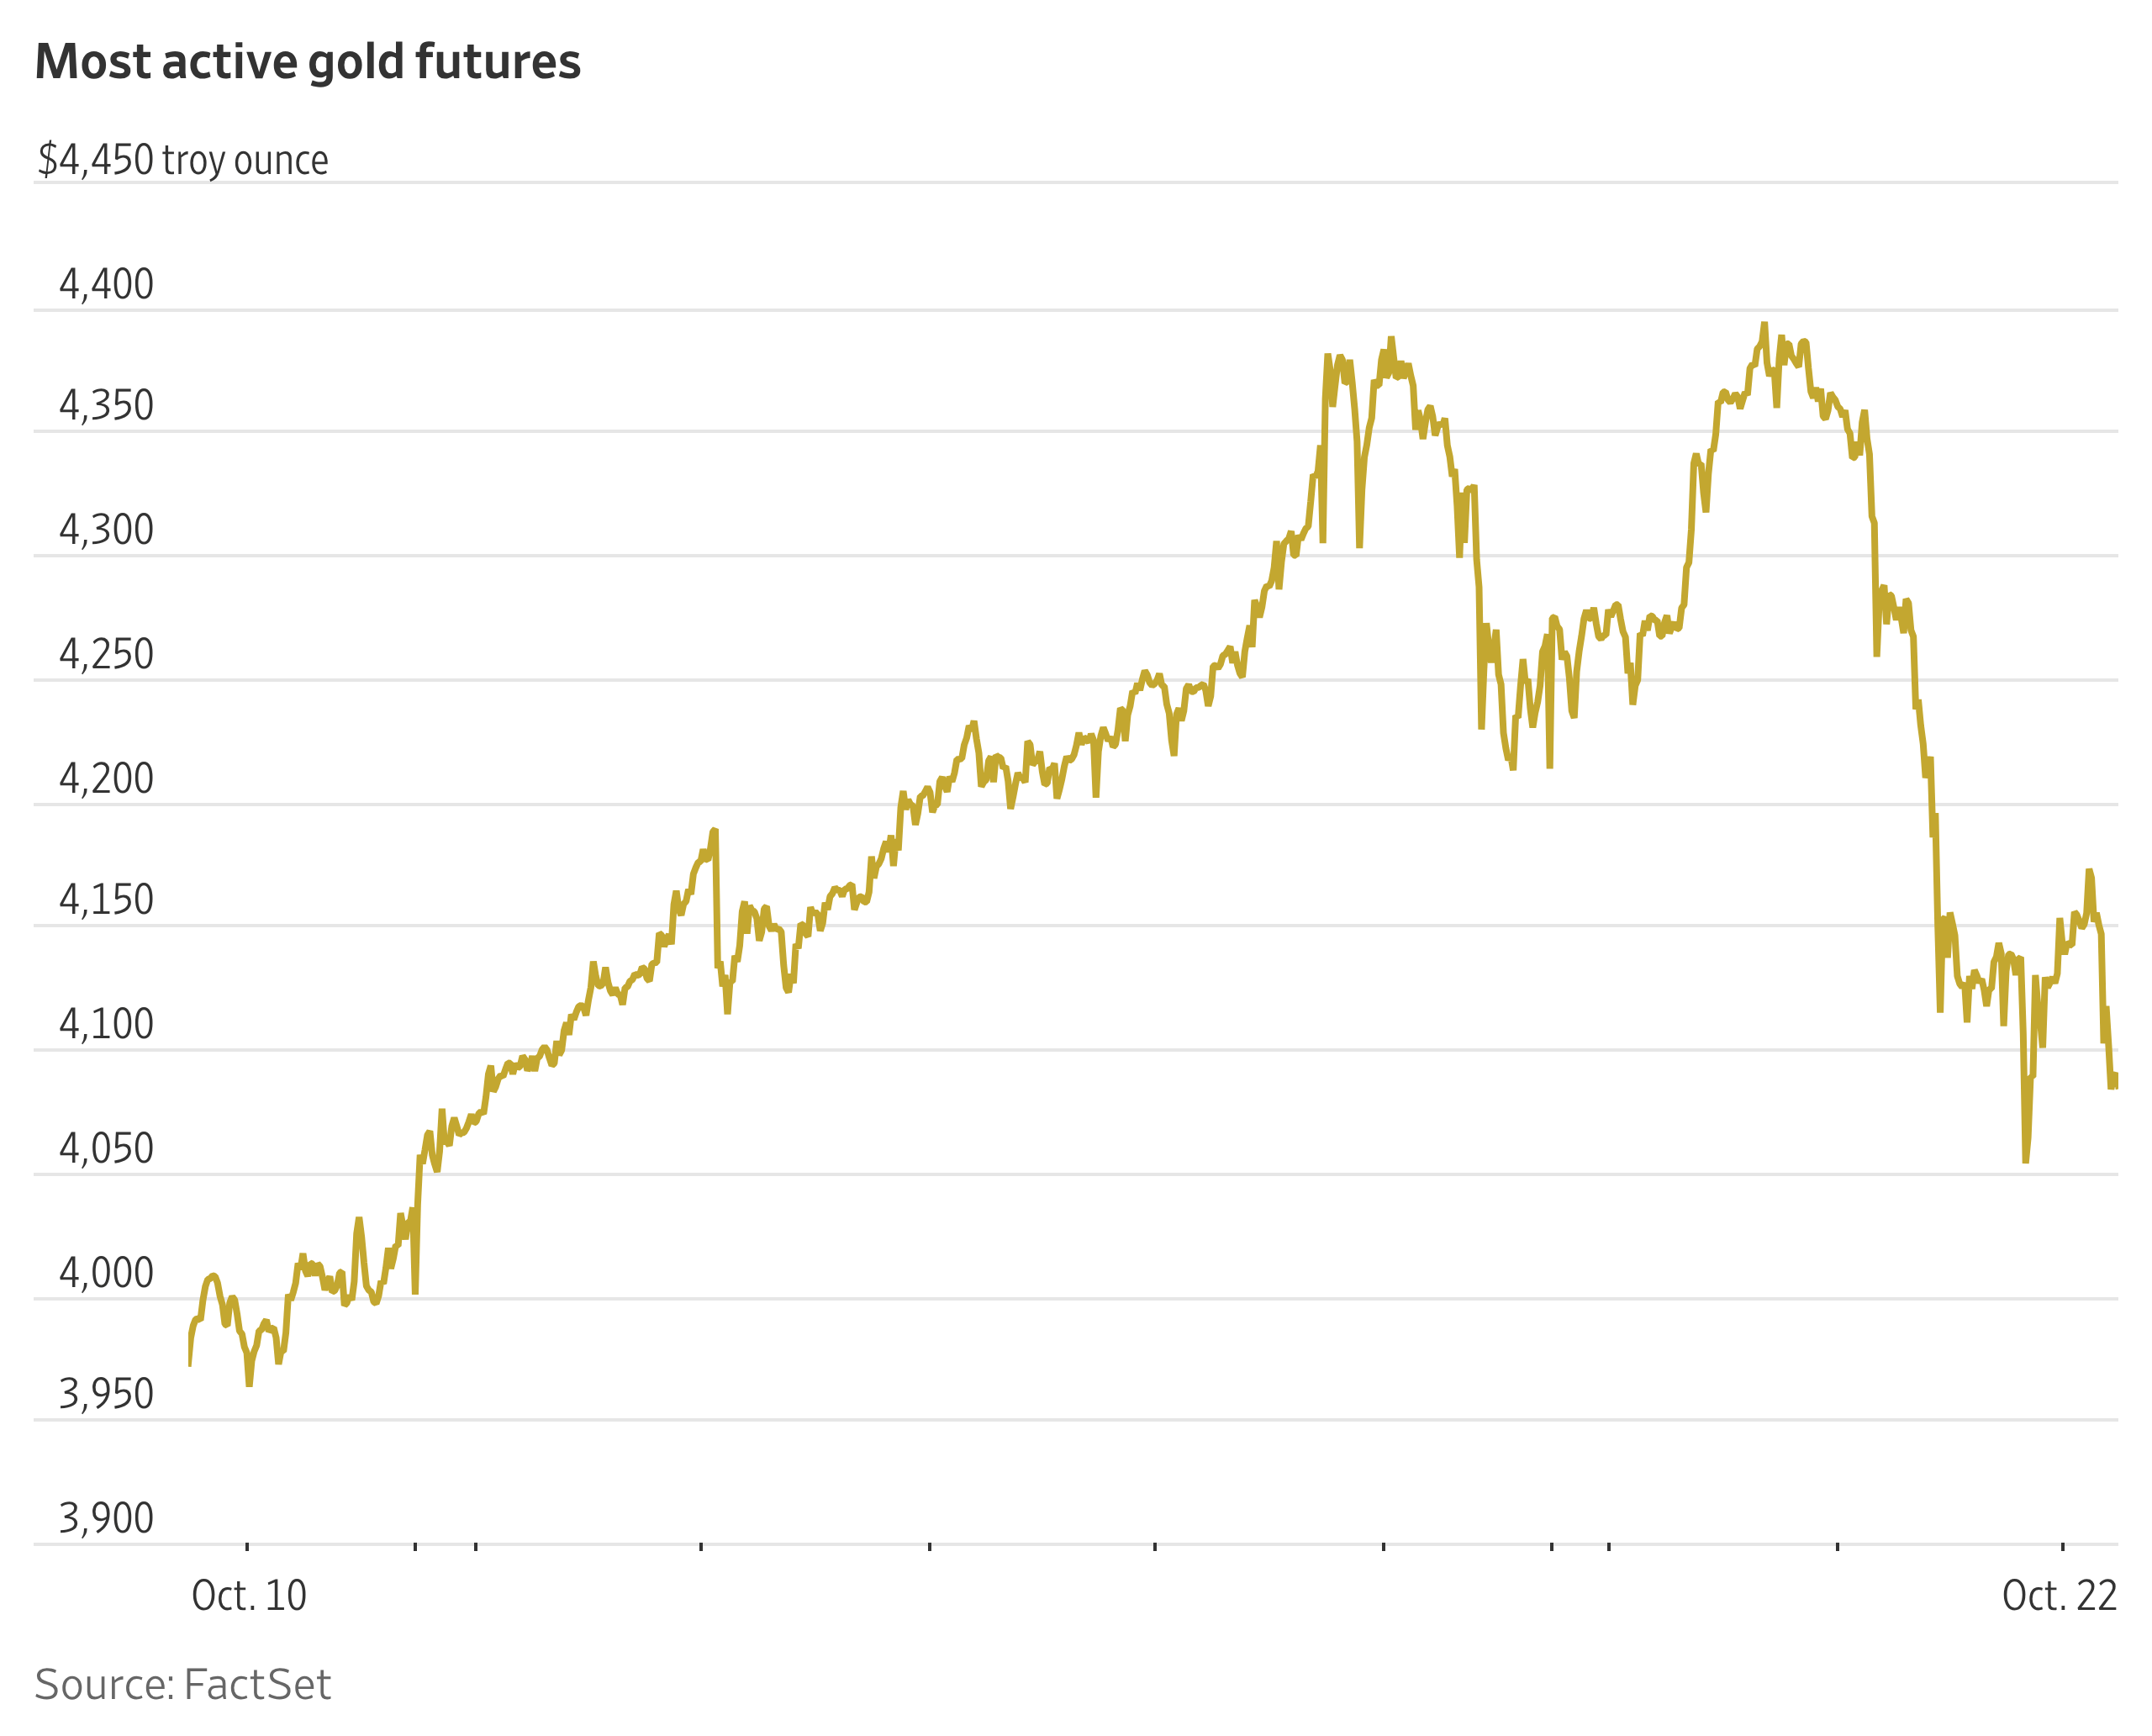
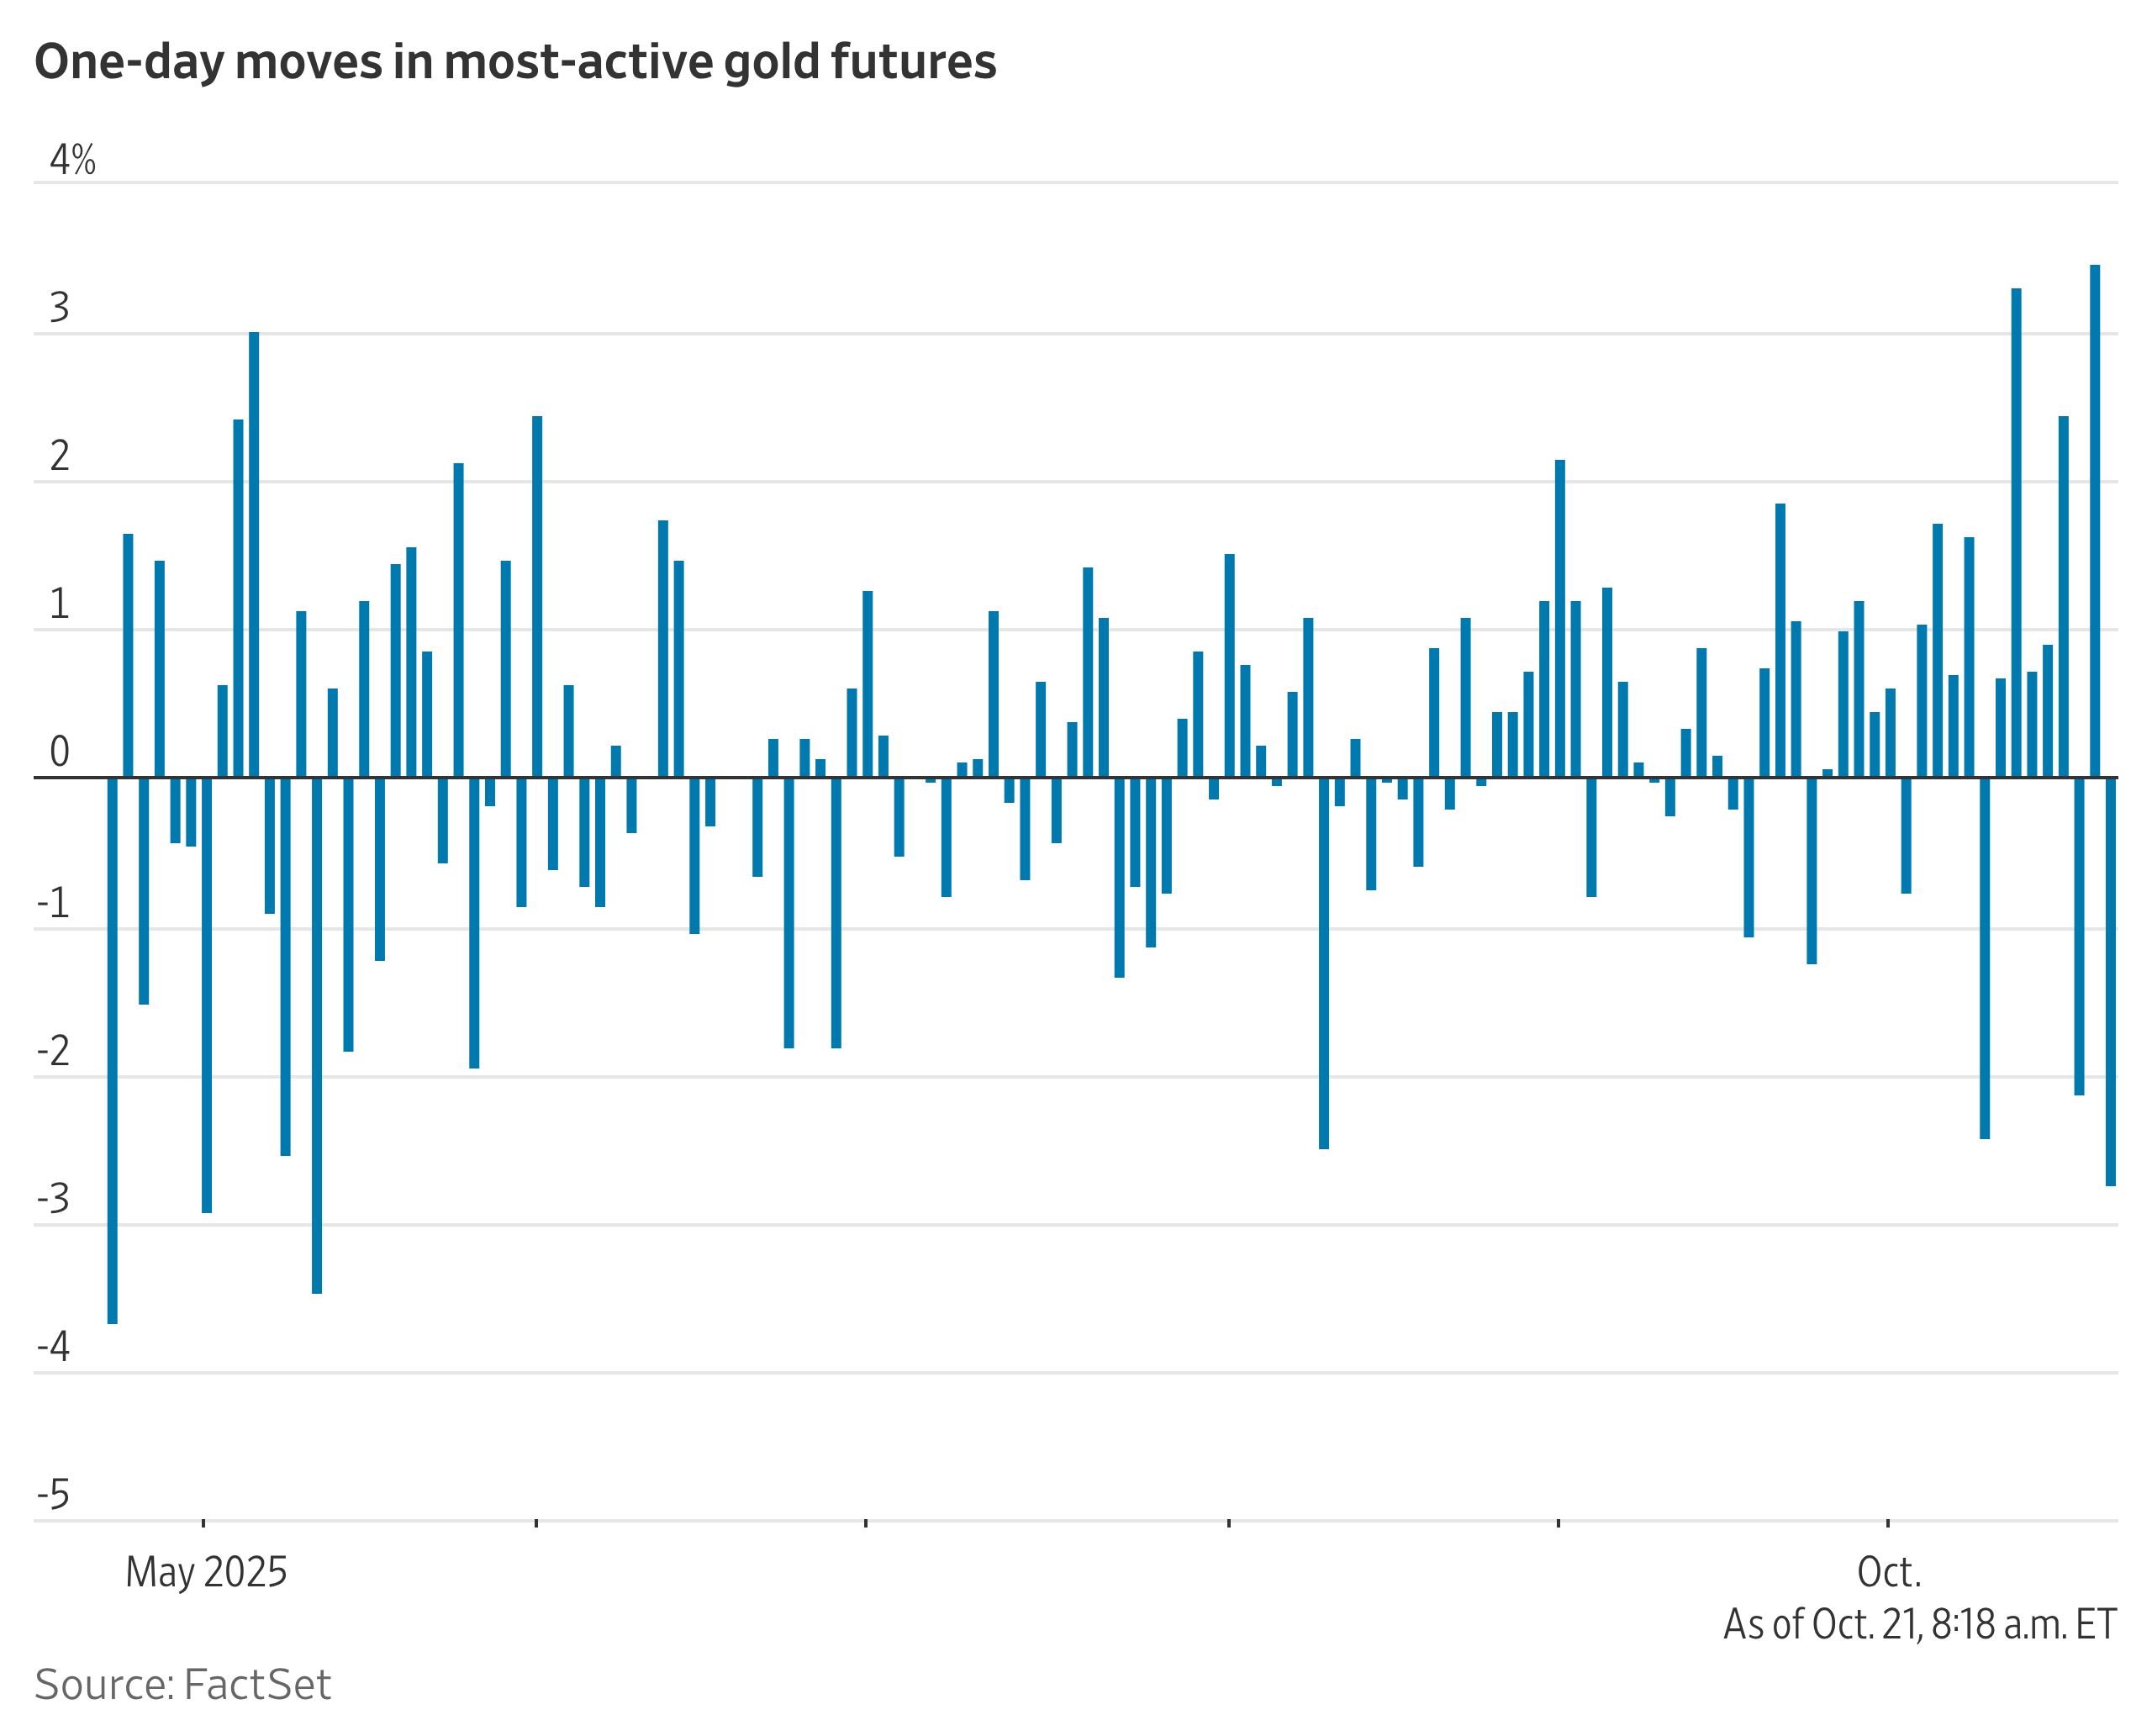
Gold has gained approximately 26% year-to-date in 2026, trading near $4,750 this morning. Silver is up only 4.6% over the same period. The gold-silver ratio sits at approximately 63.8:1, against a January low of approximately 45:1 when silver was surging.
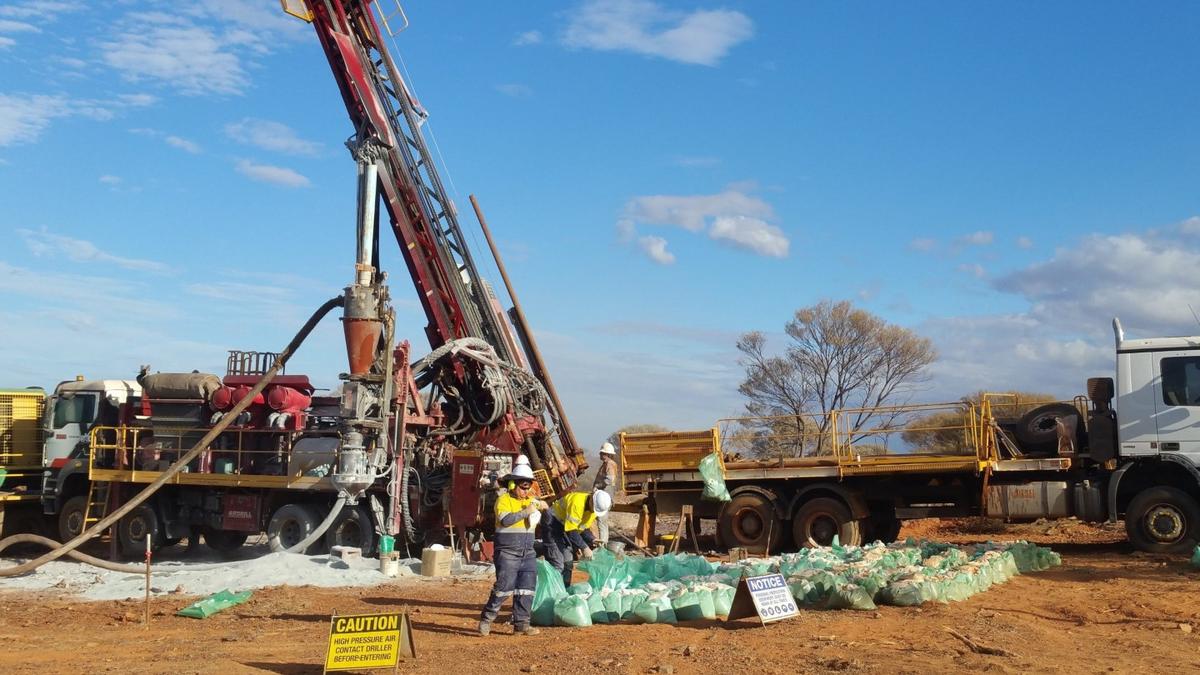
The divergence is explained by the same rate mechanism: gold benefits more immediately from monetary demand, while silver’s industrial component creates a more complex near-term picture. Industrial silver demand softens in a recession, and recession risk is rising — Goldman Sachs, EY-Parthenon, and Moody’s Analytics now put US recession probability between 30% and 49%.
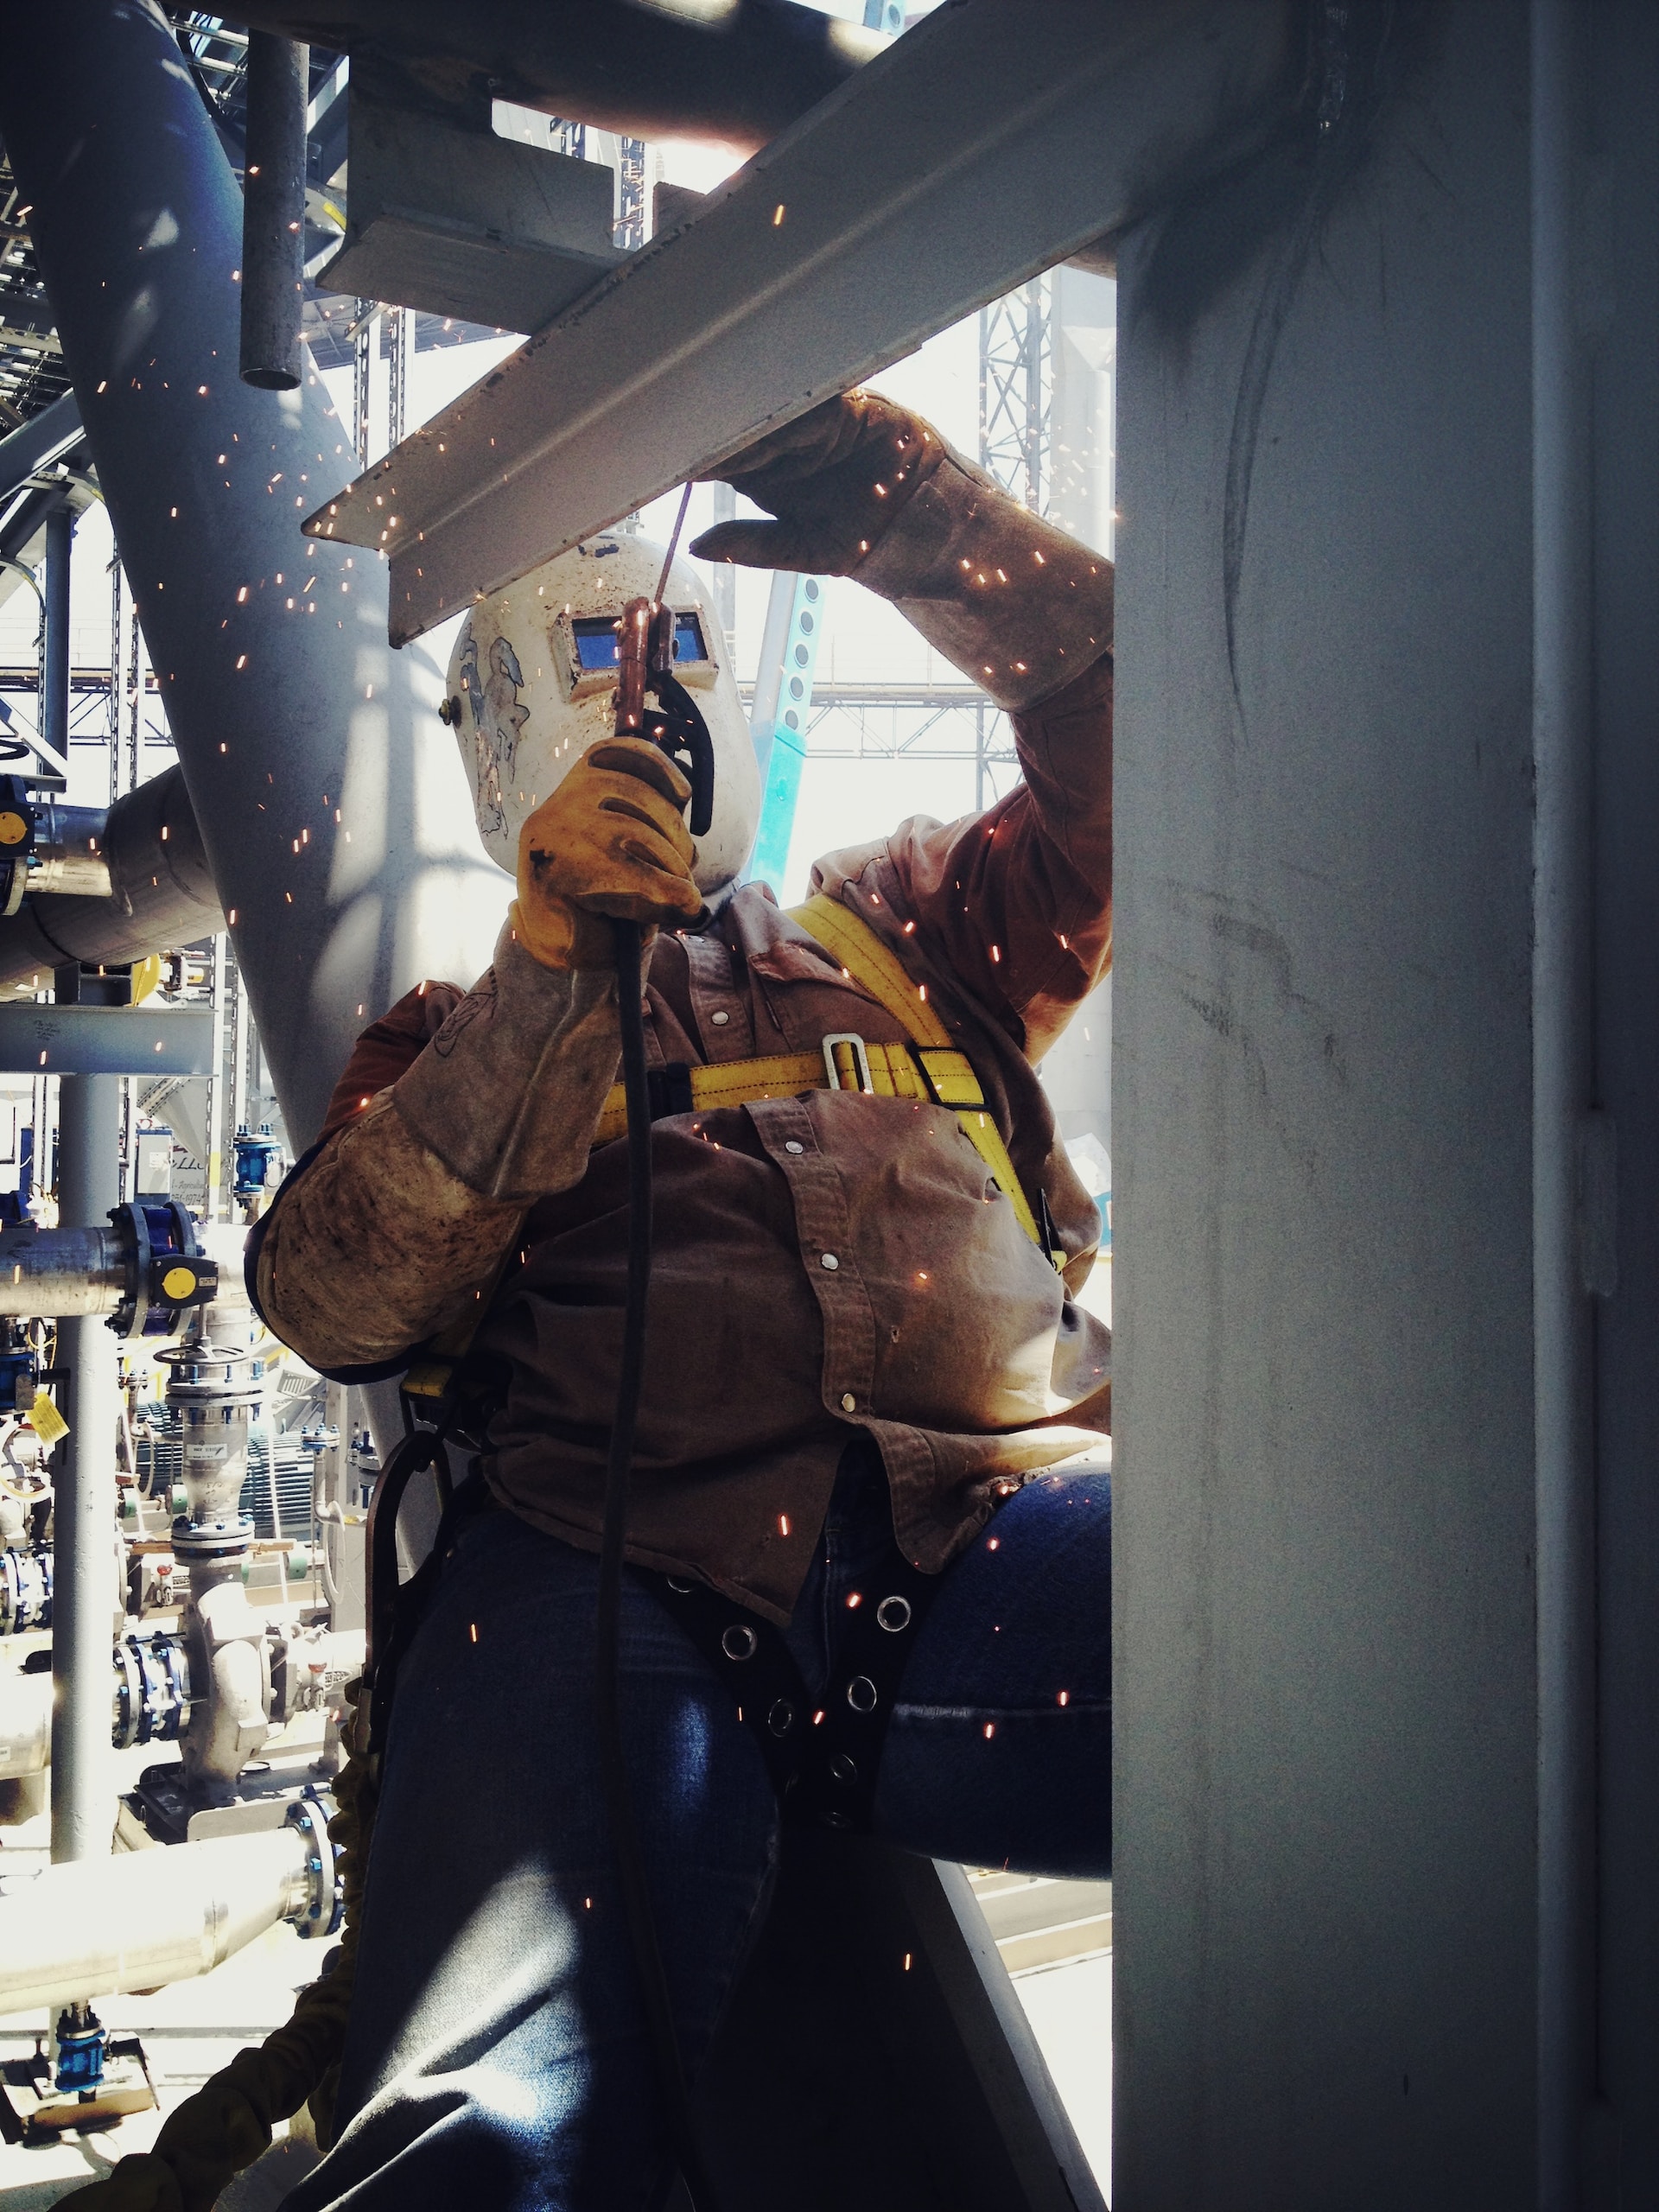
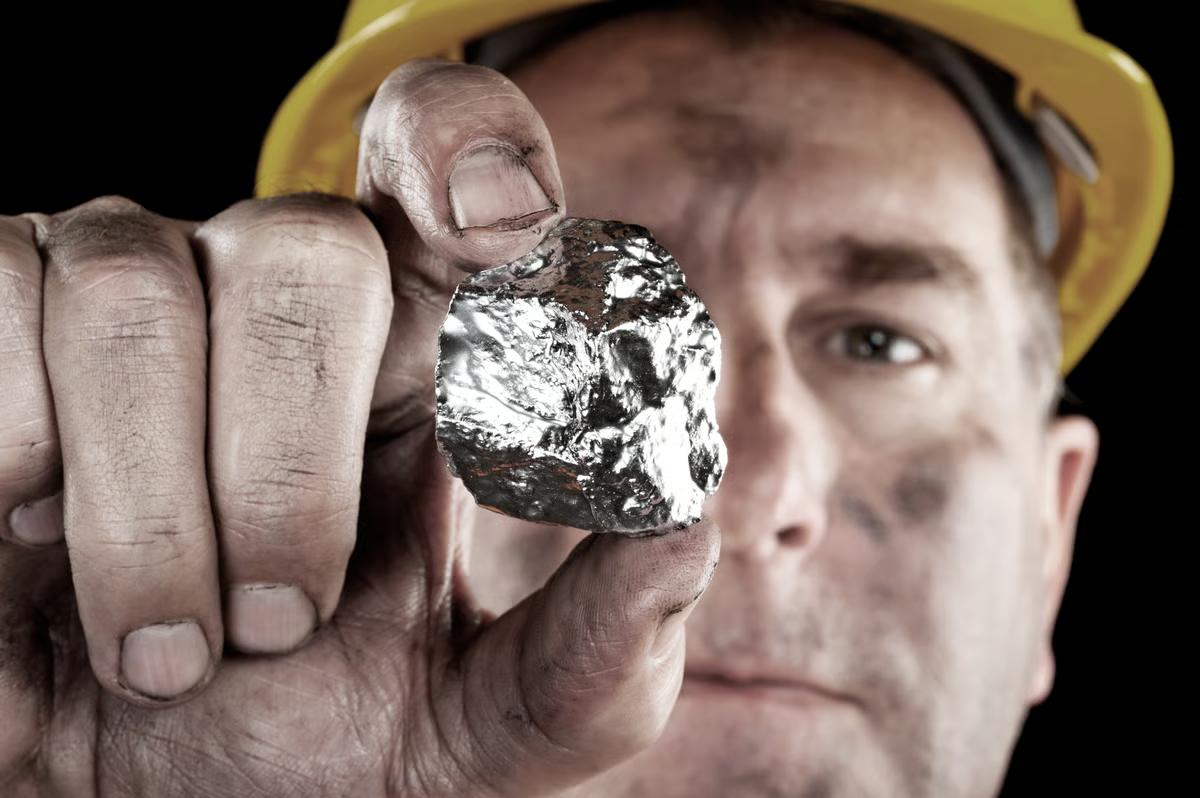
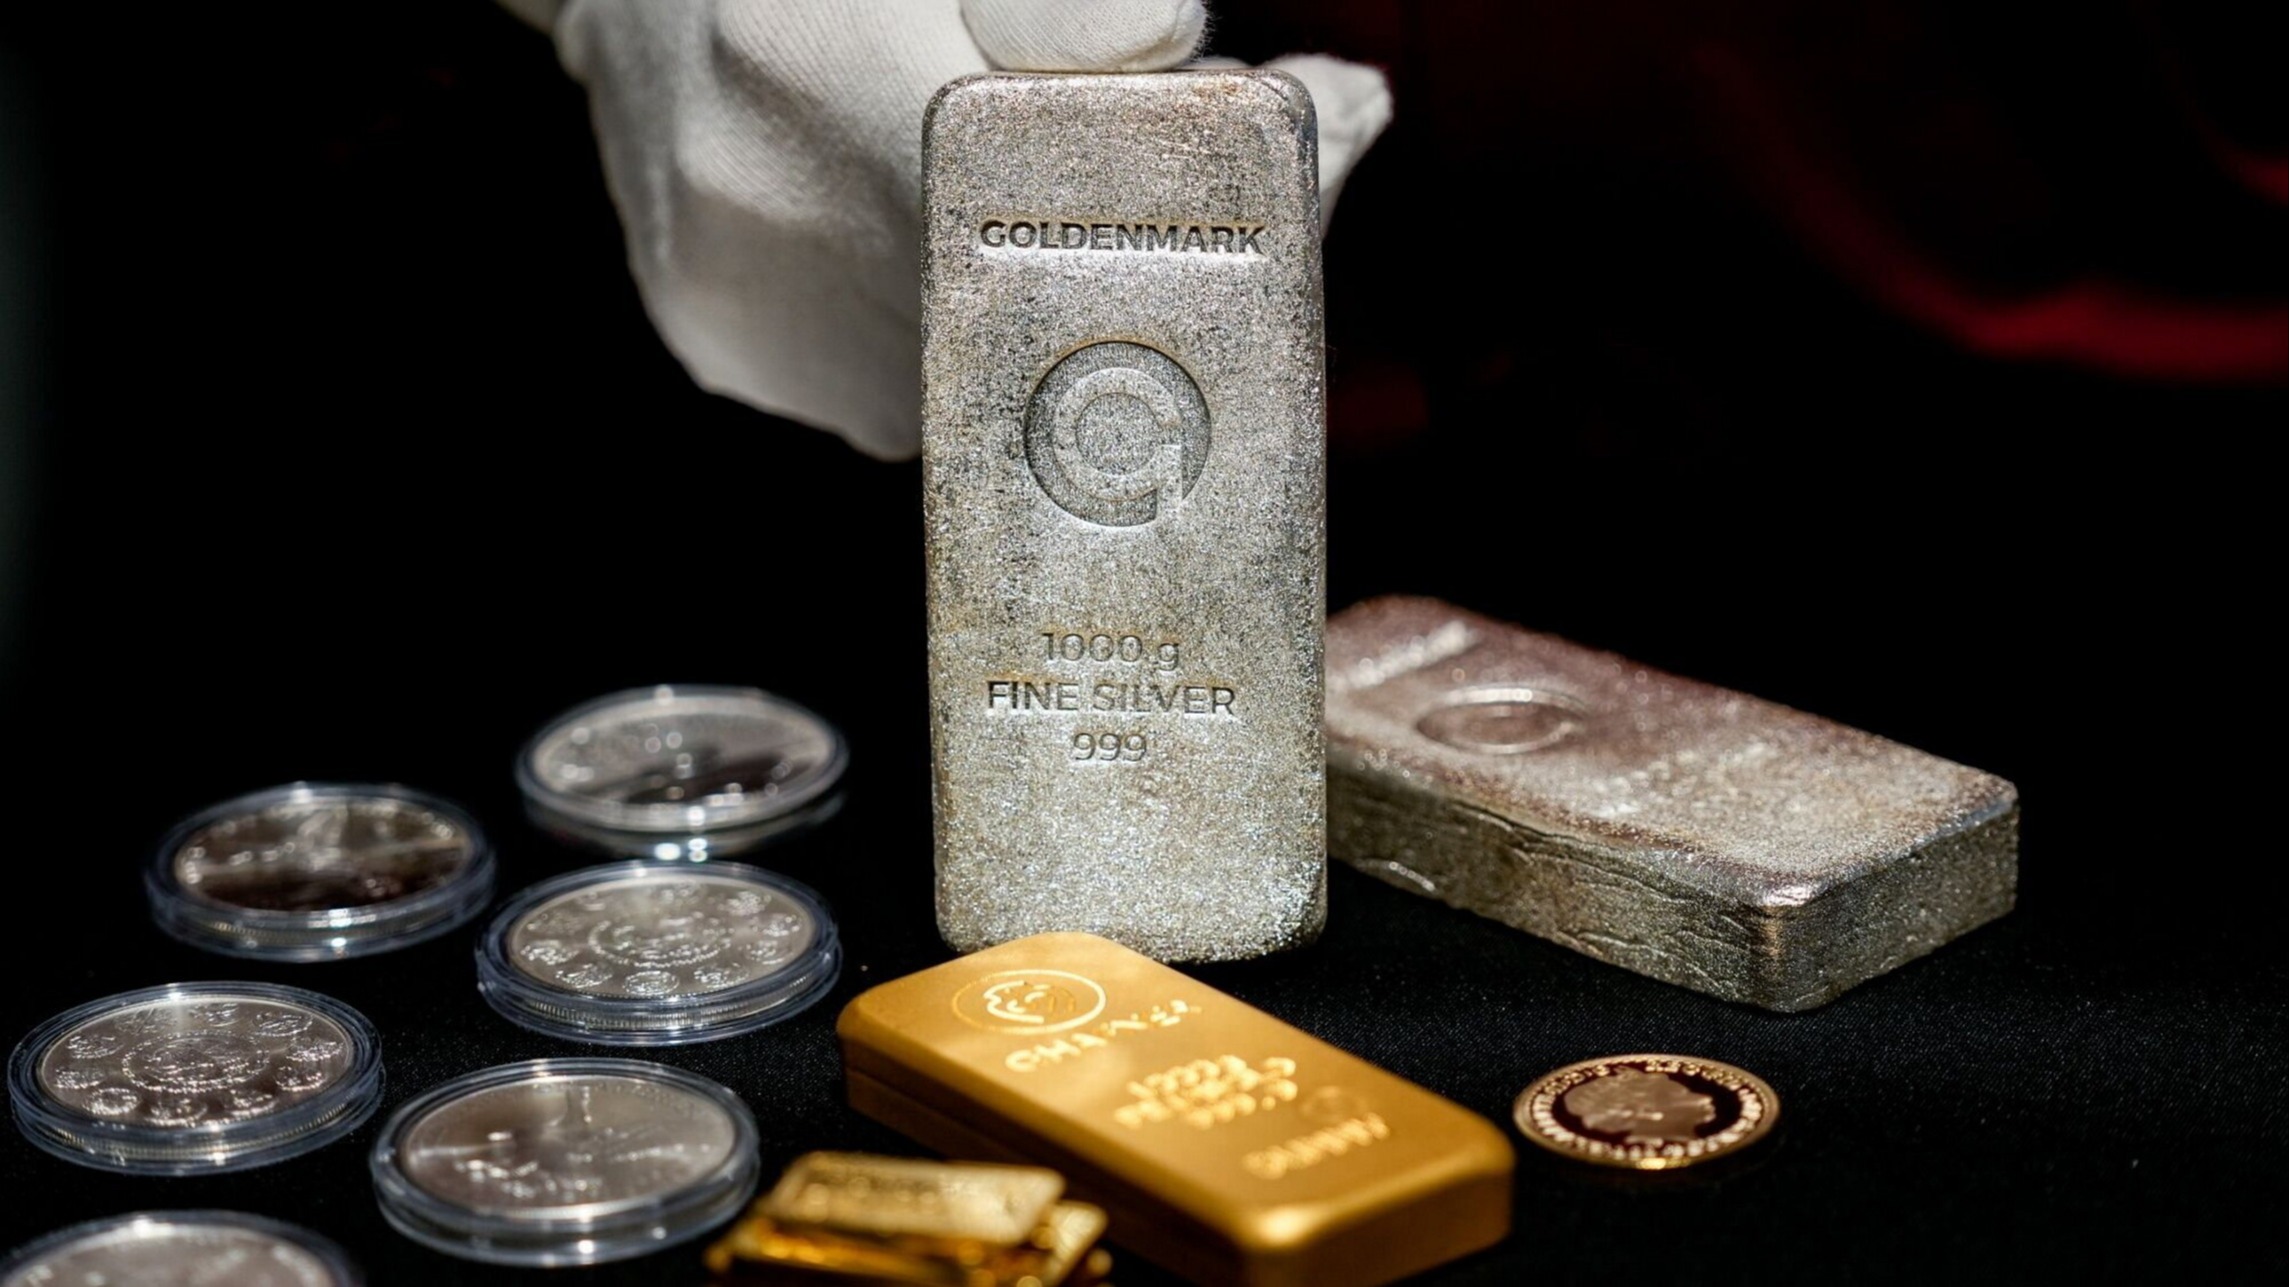
But this is precisely where the stagflation dynamic introduces a specific advantage for silver. Silver’s “dual nature” means that in a stagflation environment, both of its demand drivers can activate simultaneously. The monetary demand floor builds as real rates compress. The industrial demand floor is maintained by structural consumption from solar, EVs, AI data centres, and semiconductors — sectors that do not contract during mild slowdowns at the rate discretionary spending does. Gold has mostly monetary demand. Silver has both.
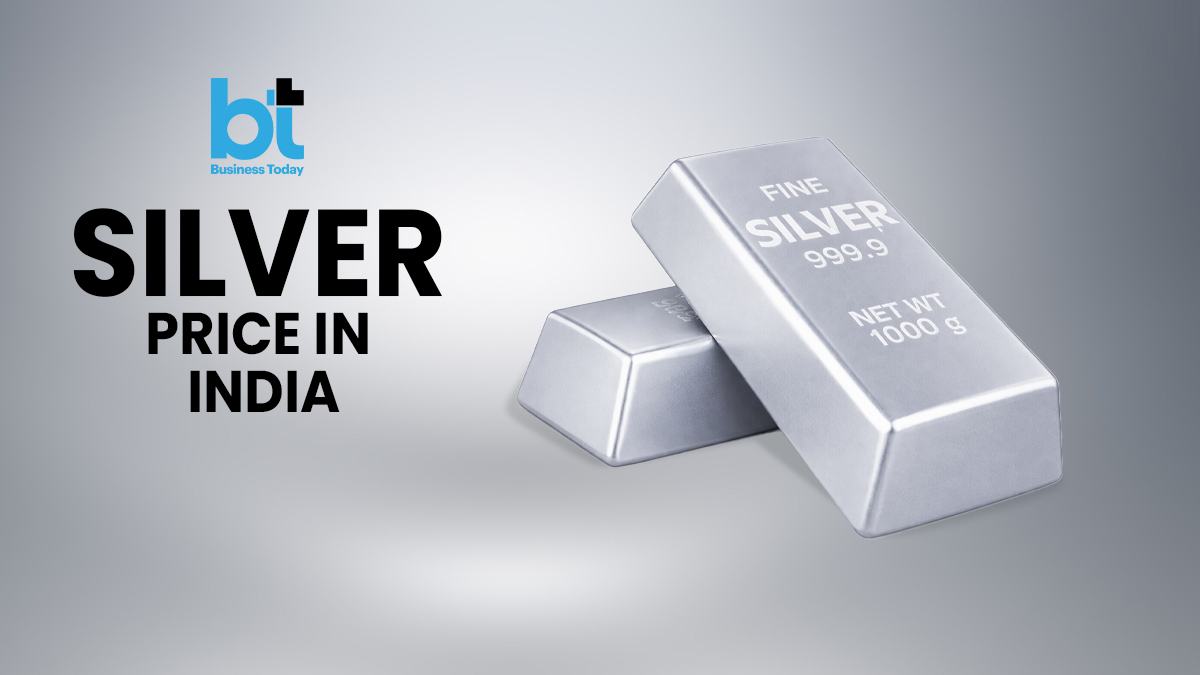
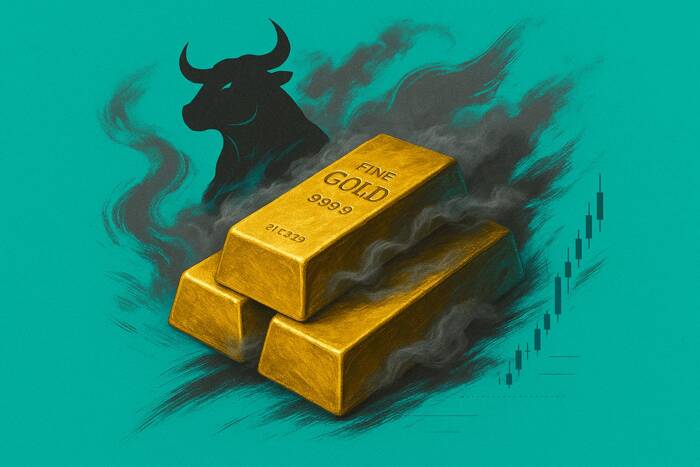
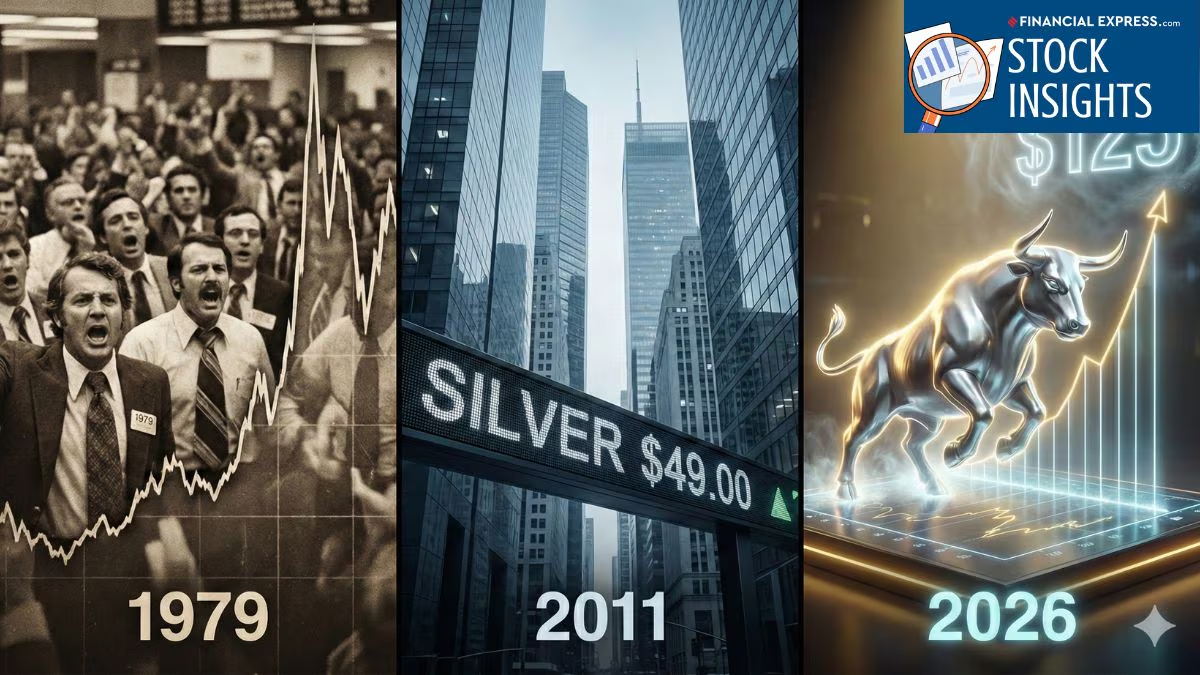
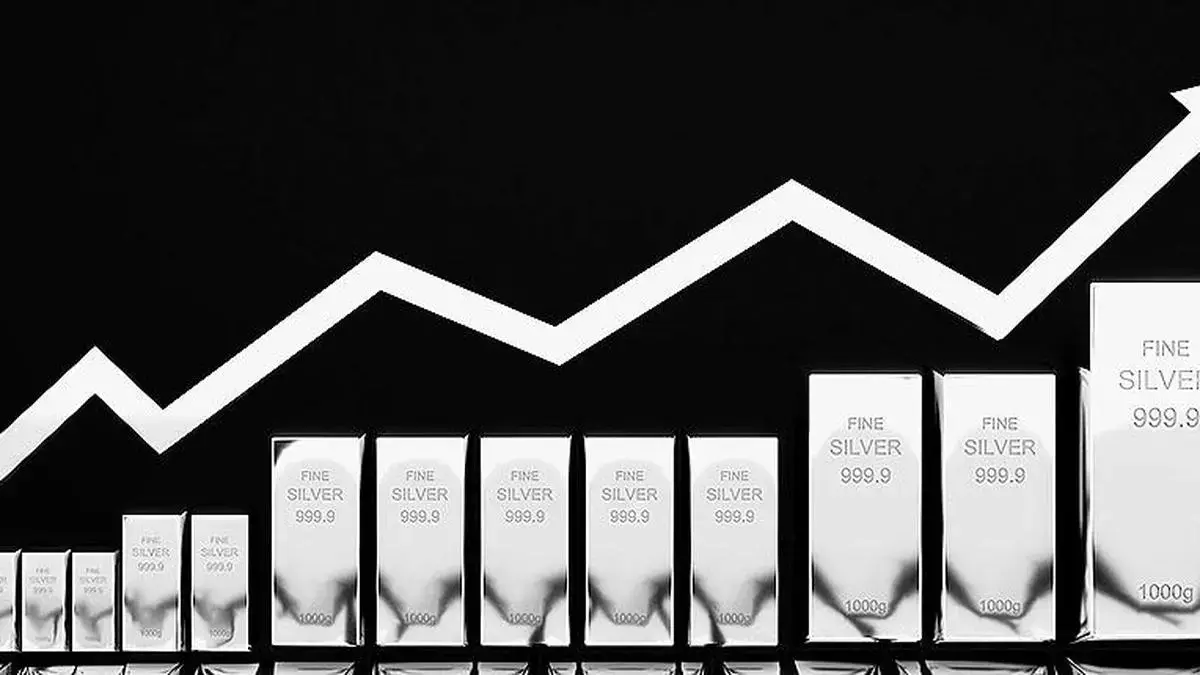
The 1970s data make this concrete. Silver gained approximately 1,546% from December 1969 to December 1979 — from $1.83 to $30.13 per ounce — across a decade defined by the Nixon gold window closure, two oil crises, and chronic above-target inflation. The current CPI trajectory at this precise inflection point maps most closely to 1971–1974 in structure: 3.3% CPI at the beginning of what became a multi-year inflation problem, with growth already decelerating.
The current configuration does not need to replicate the 1970s to generate significant silver performance. It simply needs to continue in the direction the March data confirms it is already heading.
What This Means
The 3.3% CPI print activates Catalyst #59: Silver’s Regime-Dependent Inflation Sensitivity from “Silver Rising” in hard, official government data rather than in analytical frameworks. It upgrades Catalyst #65: 1970s Stagflation Precedent Shows Extreme Performance from a structural narrative to a mainstream institutional parallel now being cited across bank research. And it confirms the environment that makes Catalyst #63: Dual Nature Providing Superior Protection specifically applicable: both demand levers becoming active at the same time.
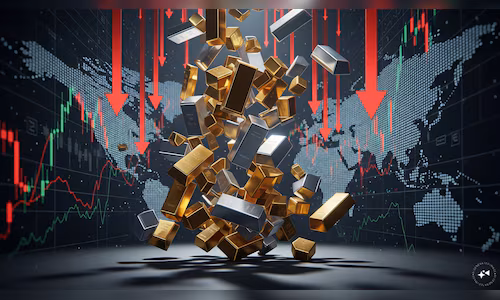
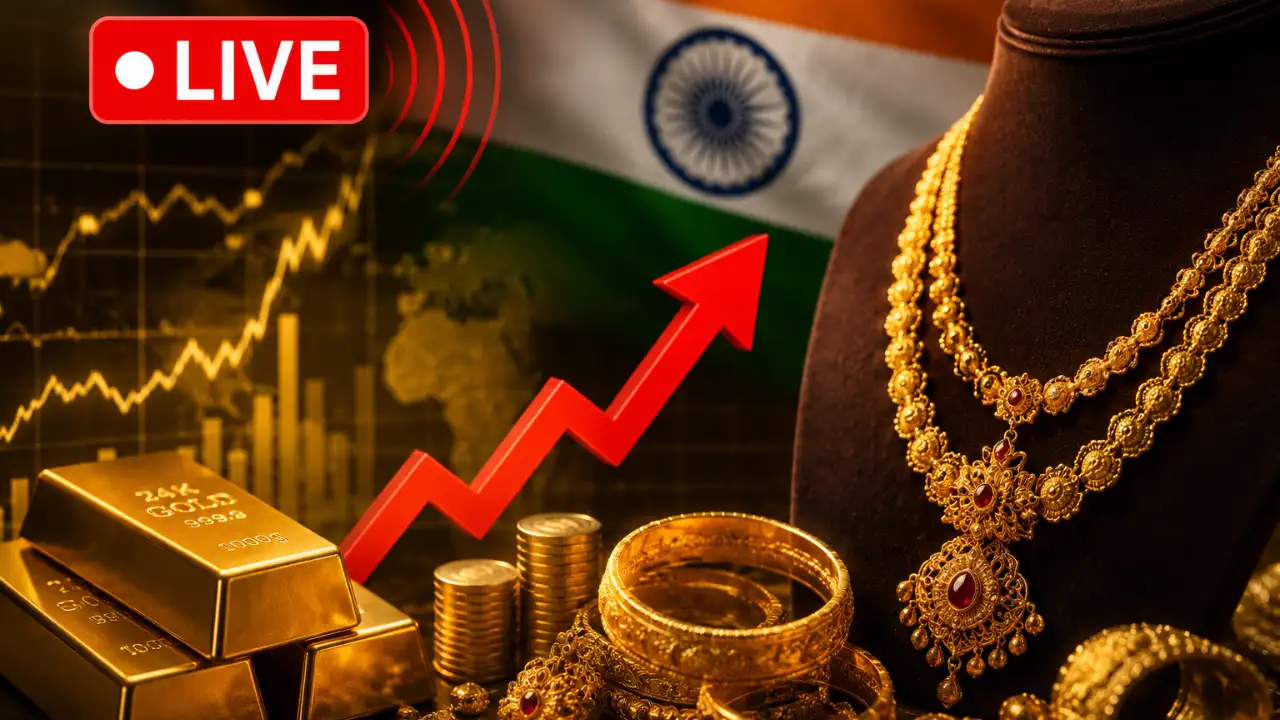
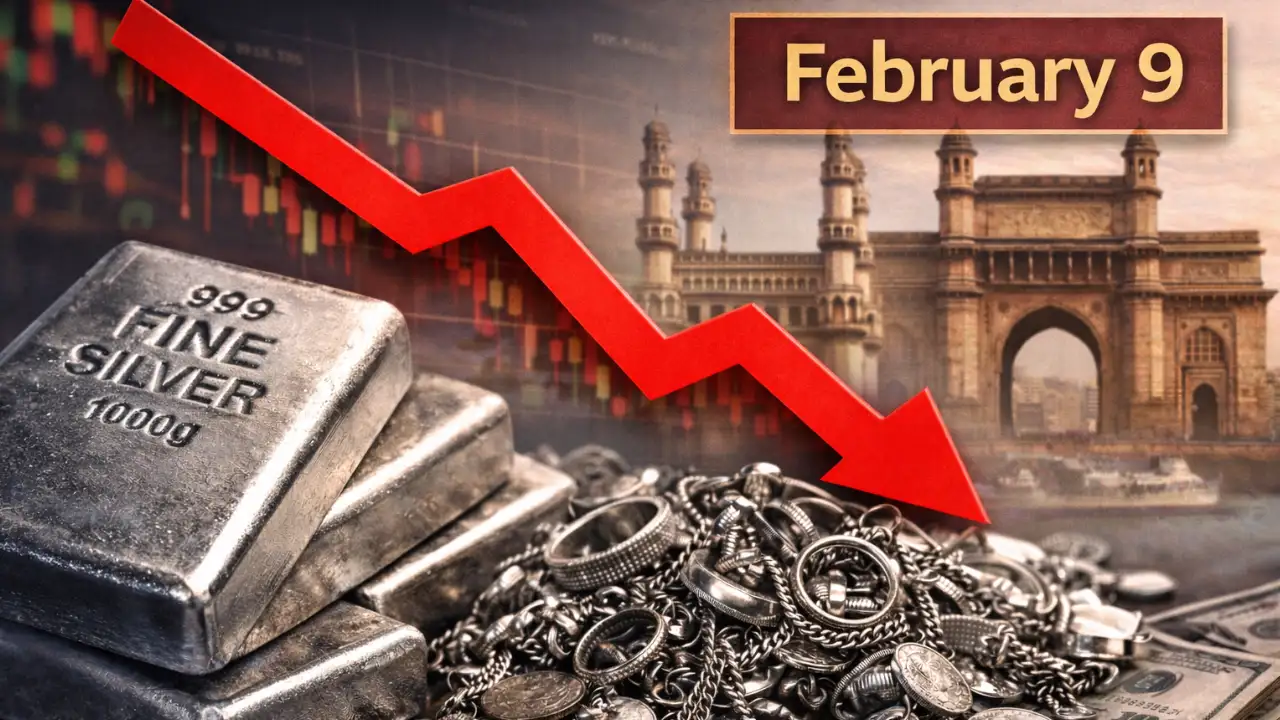
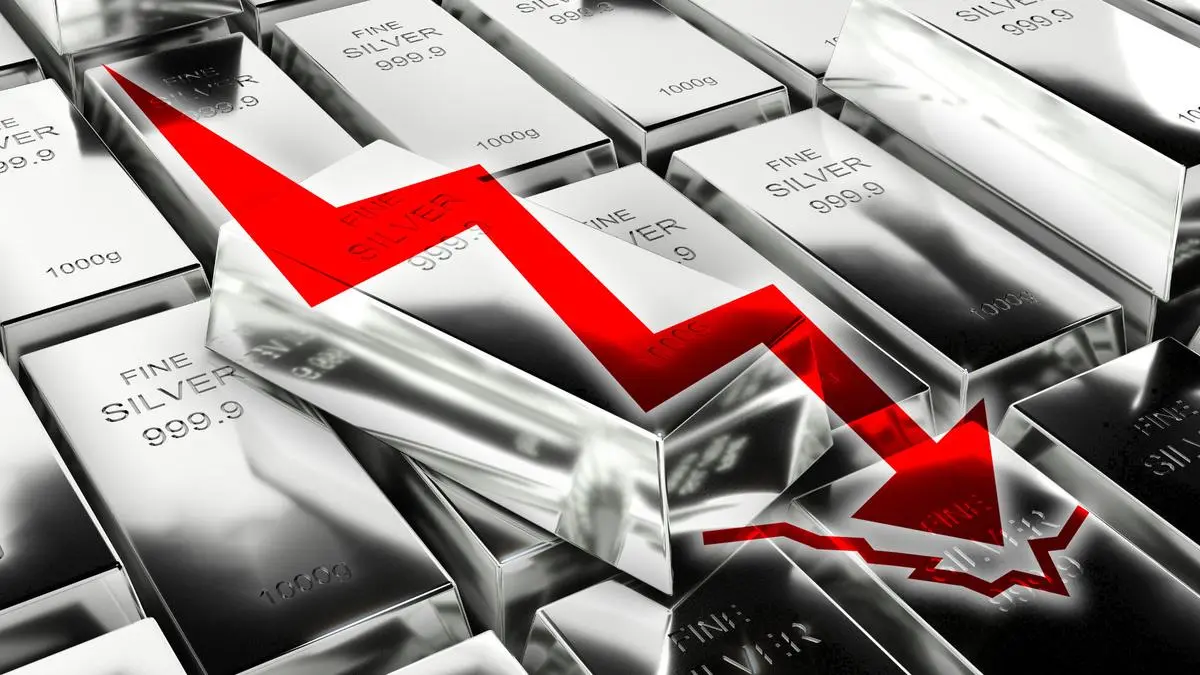
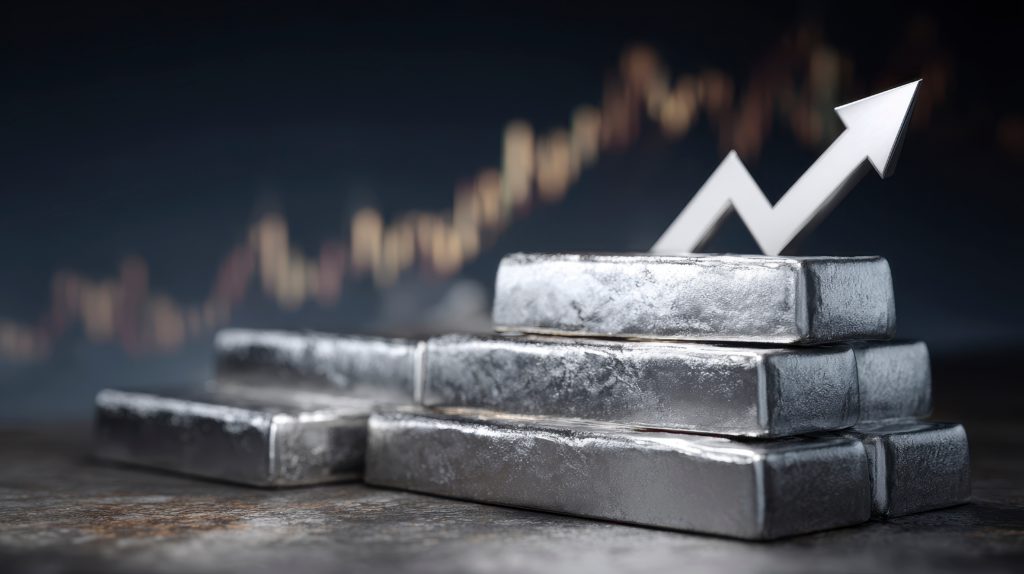
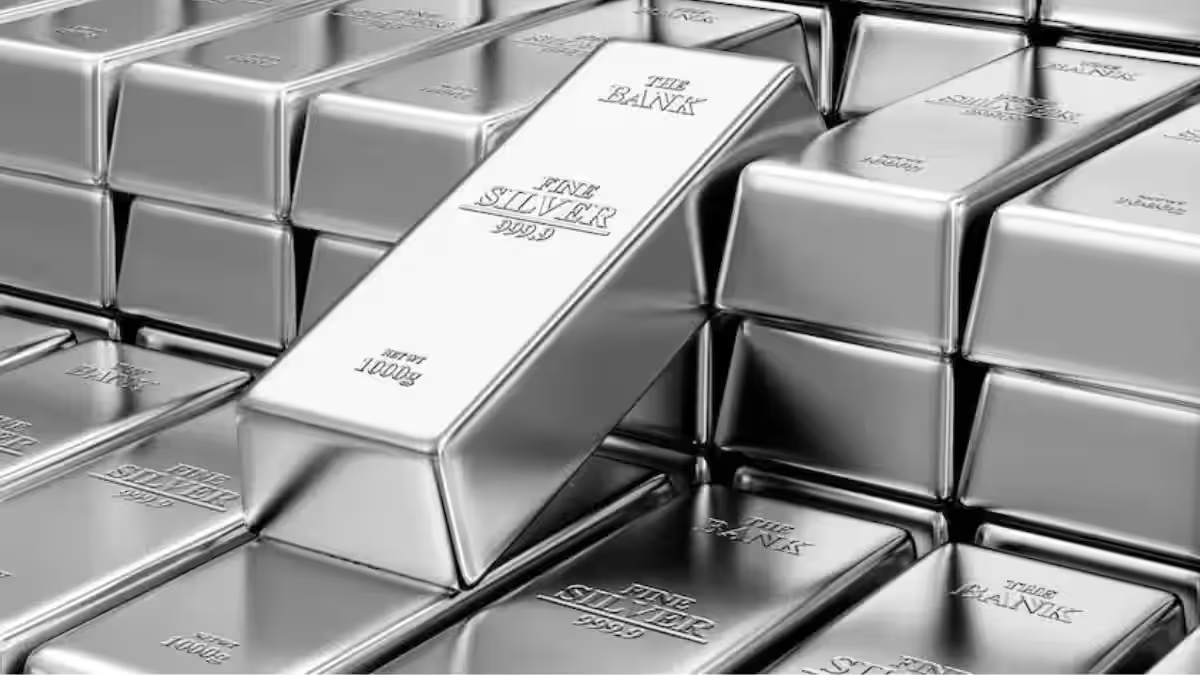
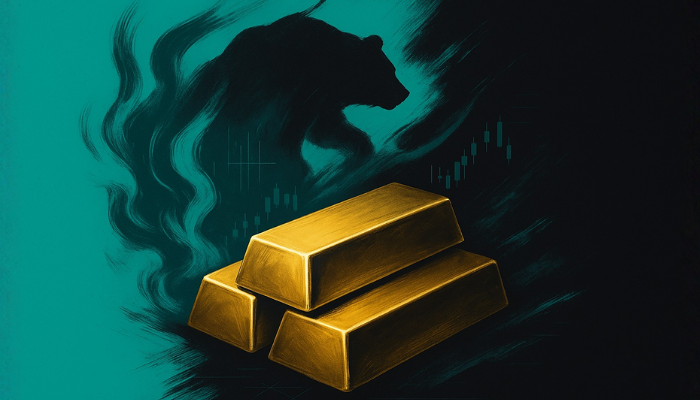
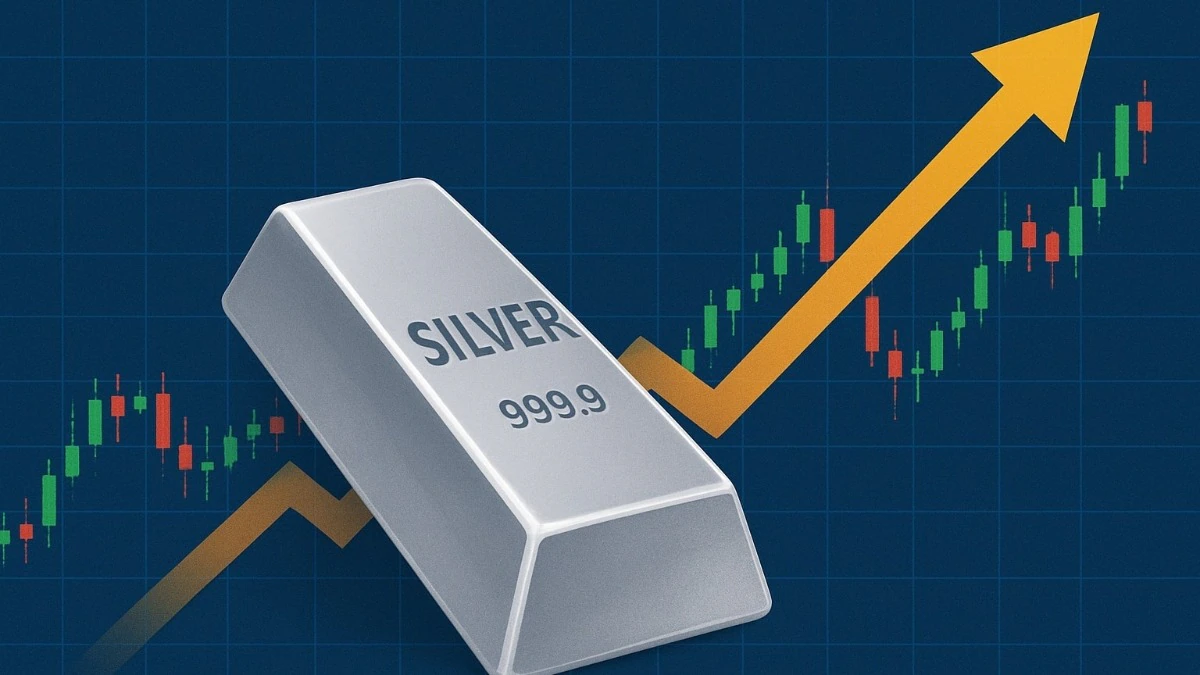
Silver is 39% below its January high. The fundamentals that drove that high have not weakened. In the case of the stagflation thesis — the central monetary argument for silver — they have just received their strongest official confirmation to date.
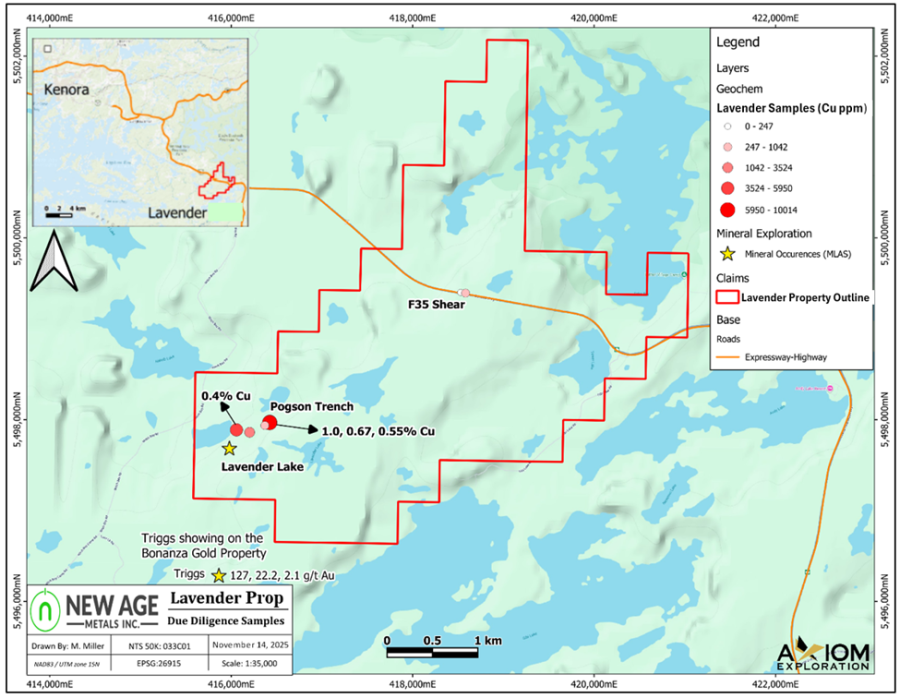
The Silver Catalyst Issue #13 covers seven more Deep Dives: the Hormuz blockade and what $102/barrel oil means for silver’s mining cost floor, the COMEX inventory situation with May delivery First Notice Day approaching, the 64% semiconductor revenue surge and its industrial silver implications, the Section 301 trade investigation closing today and the tariff risk to Mexico’s 185–200 Moz annual supply, the LBMA London vault drawdown and why the free float has fallen below a single average day’s traded volume, the Samsung solid-state battery commercial deployment timeline, and the Warsh Fed confirmation delay and fiscal dominance as a structural argument for why this inflation is difficult to contain. If you want to follow silver’s performance throughout 2026 as this market develops, I encourage you to get “Silver Rising” with complimentary 2-week access to the Silver Catalyst newsletter.
Thank you.
The Silver Engineer