
Precious metals outshine equities in the long run
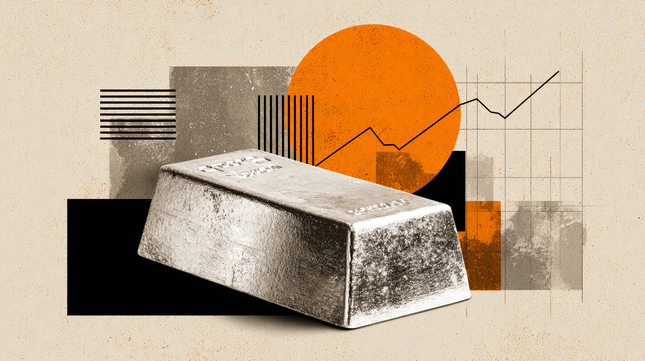
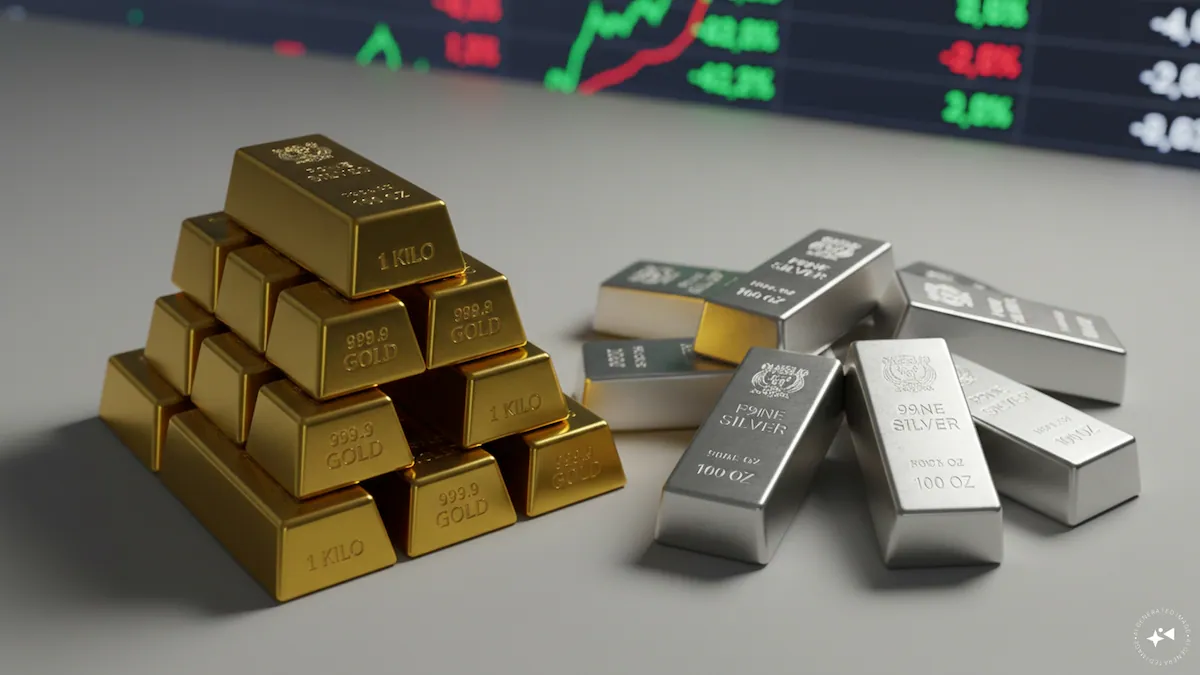
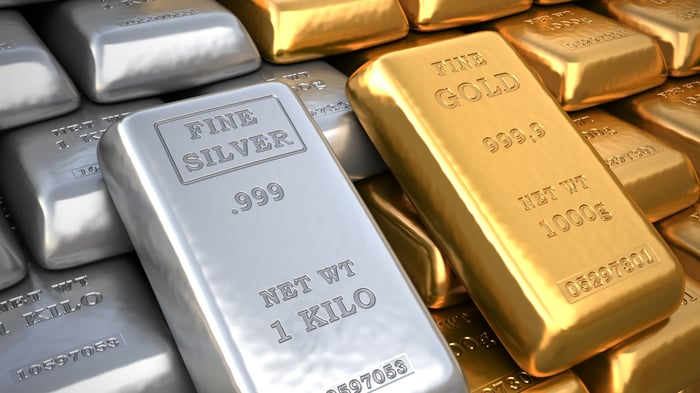
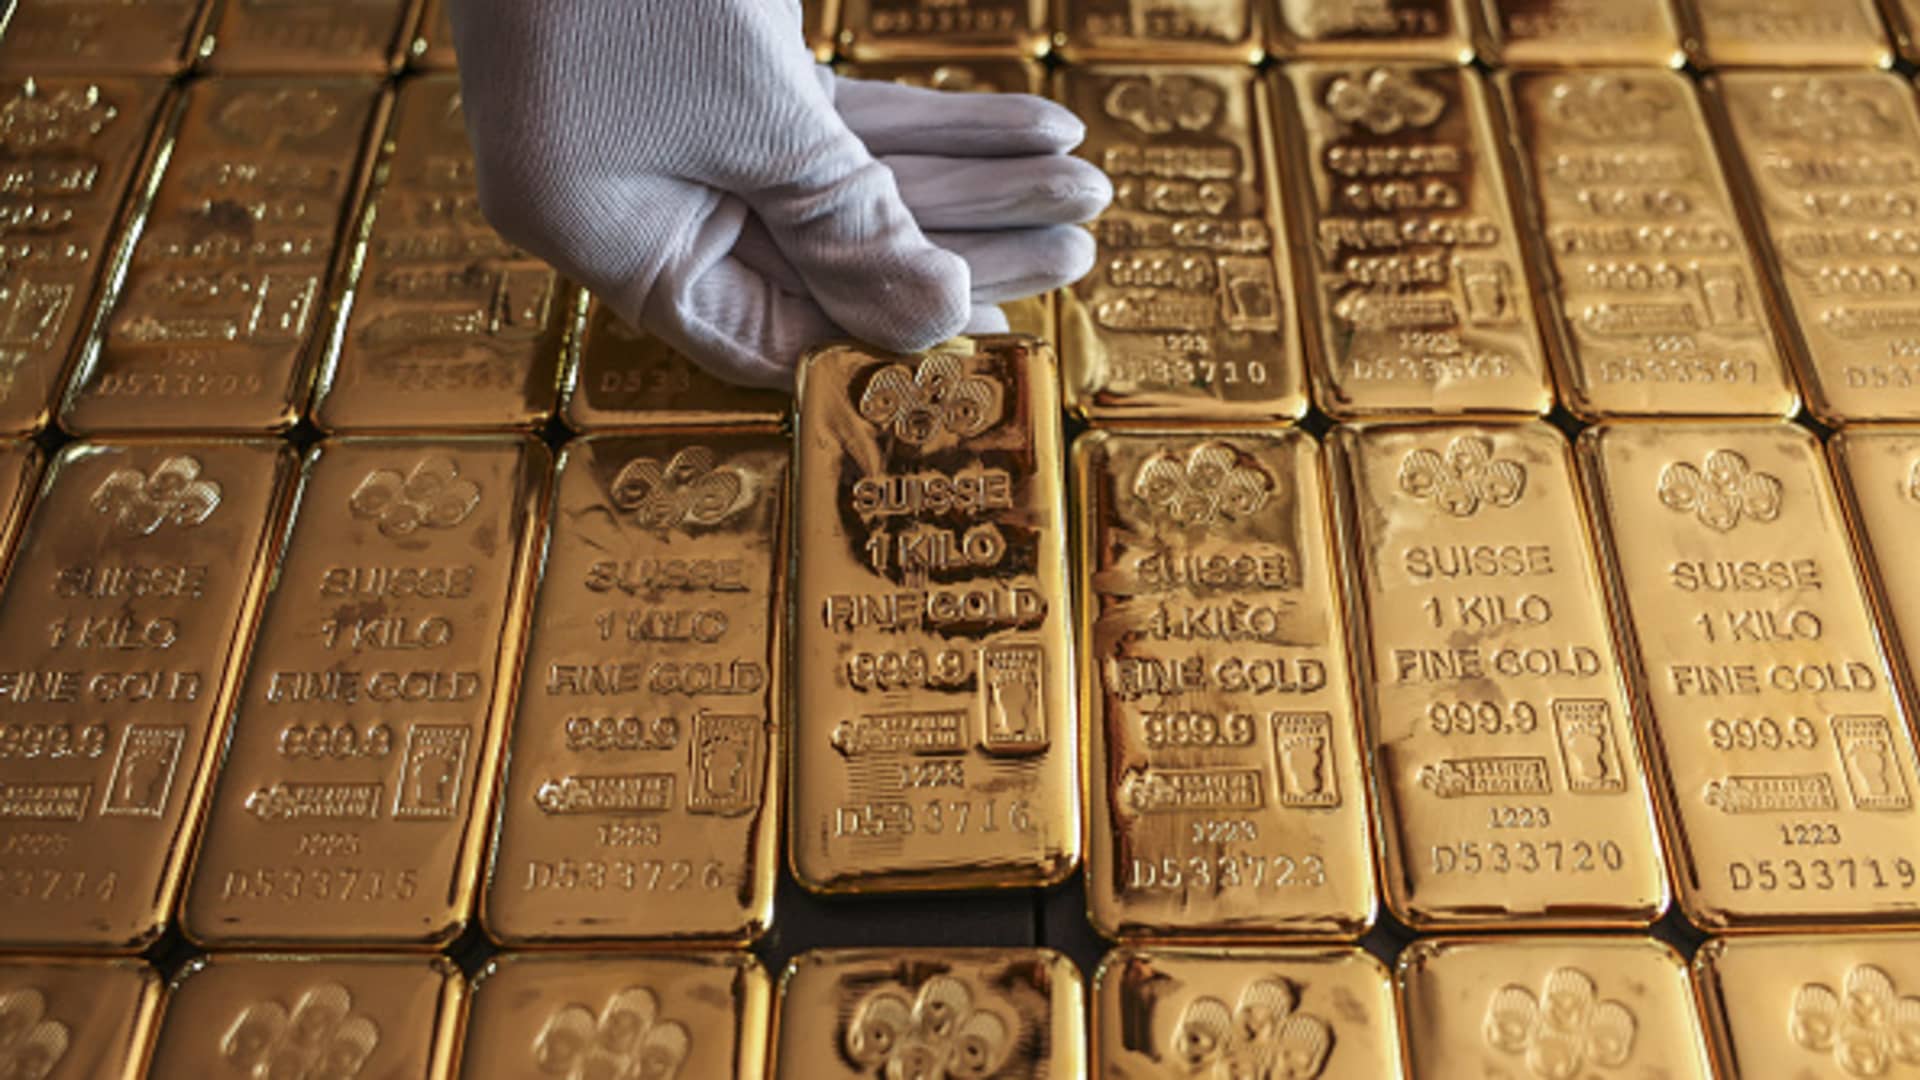
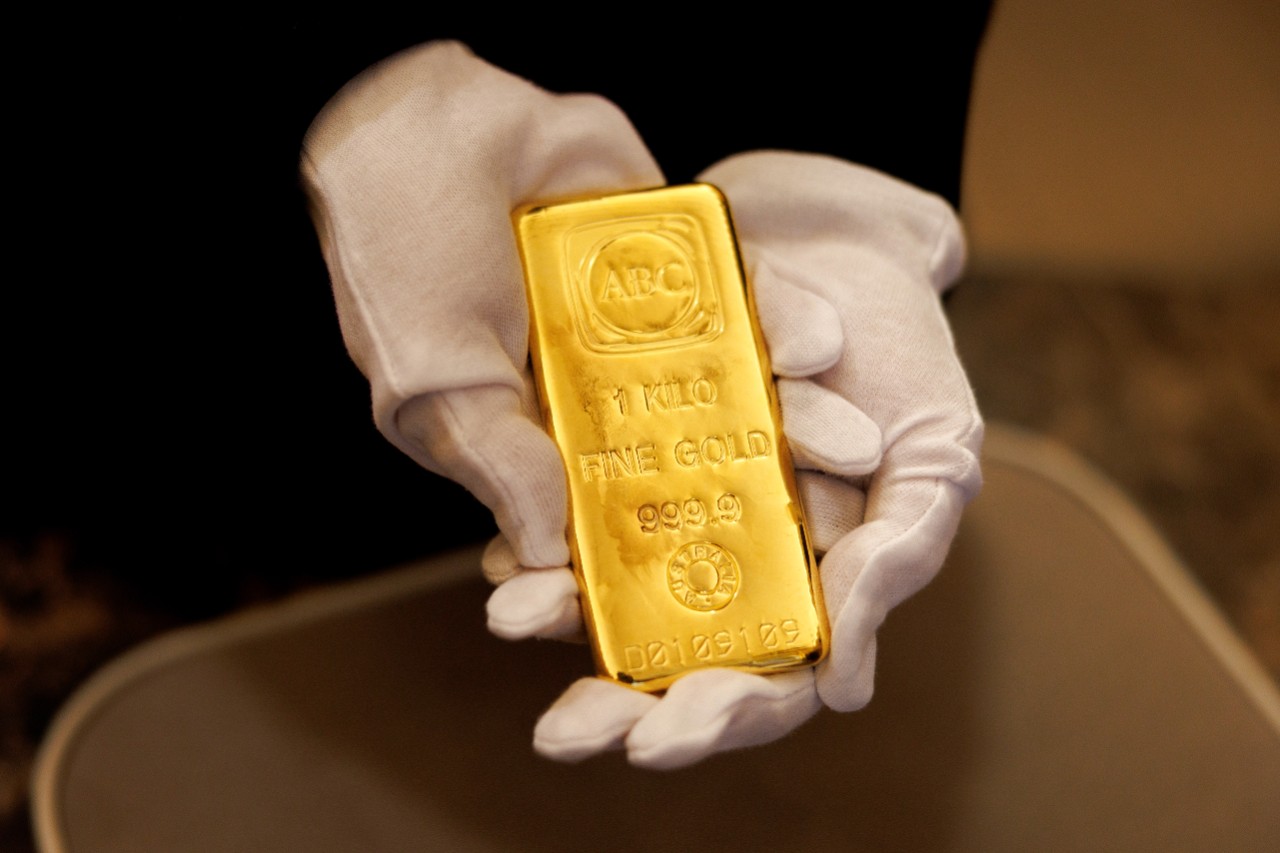
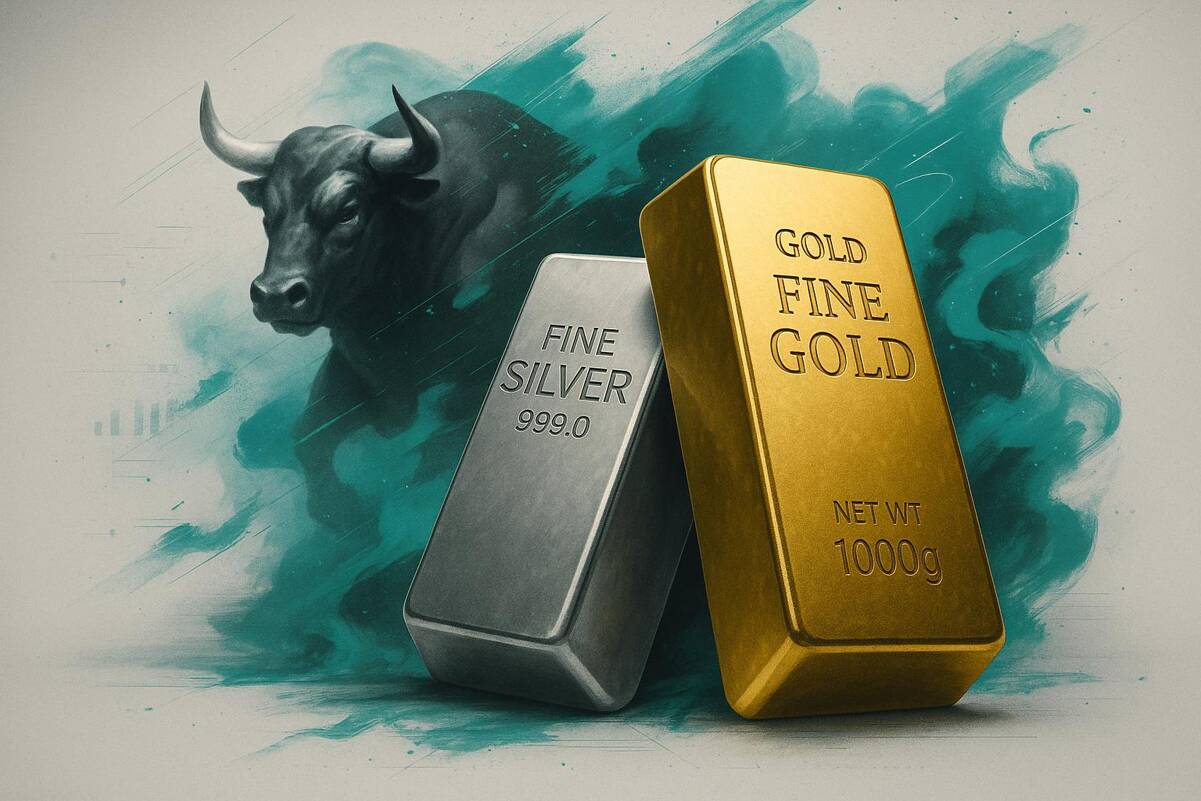
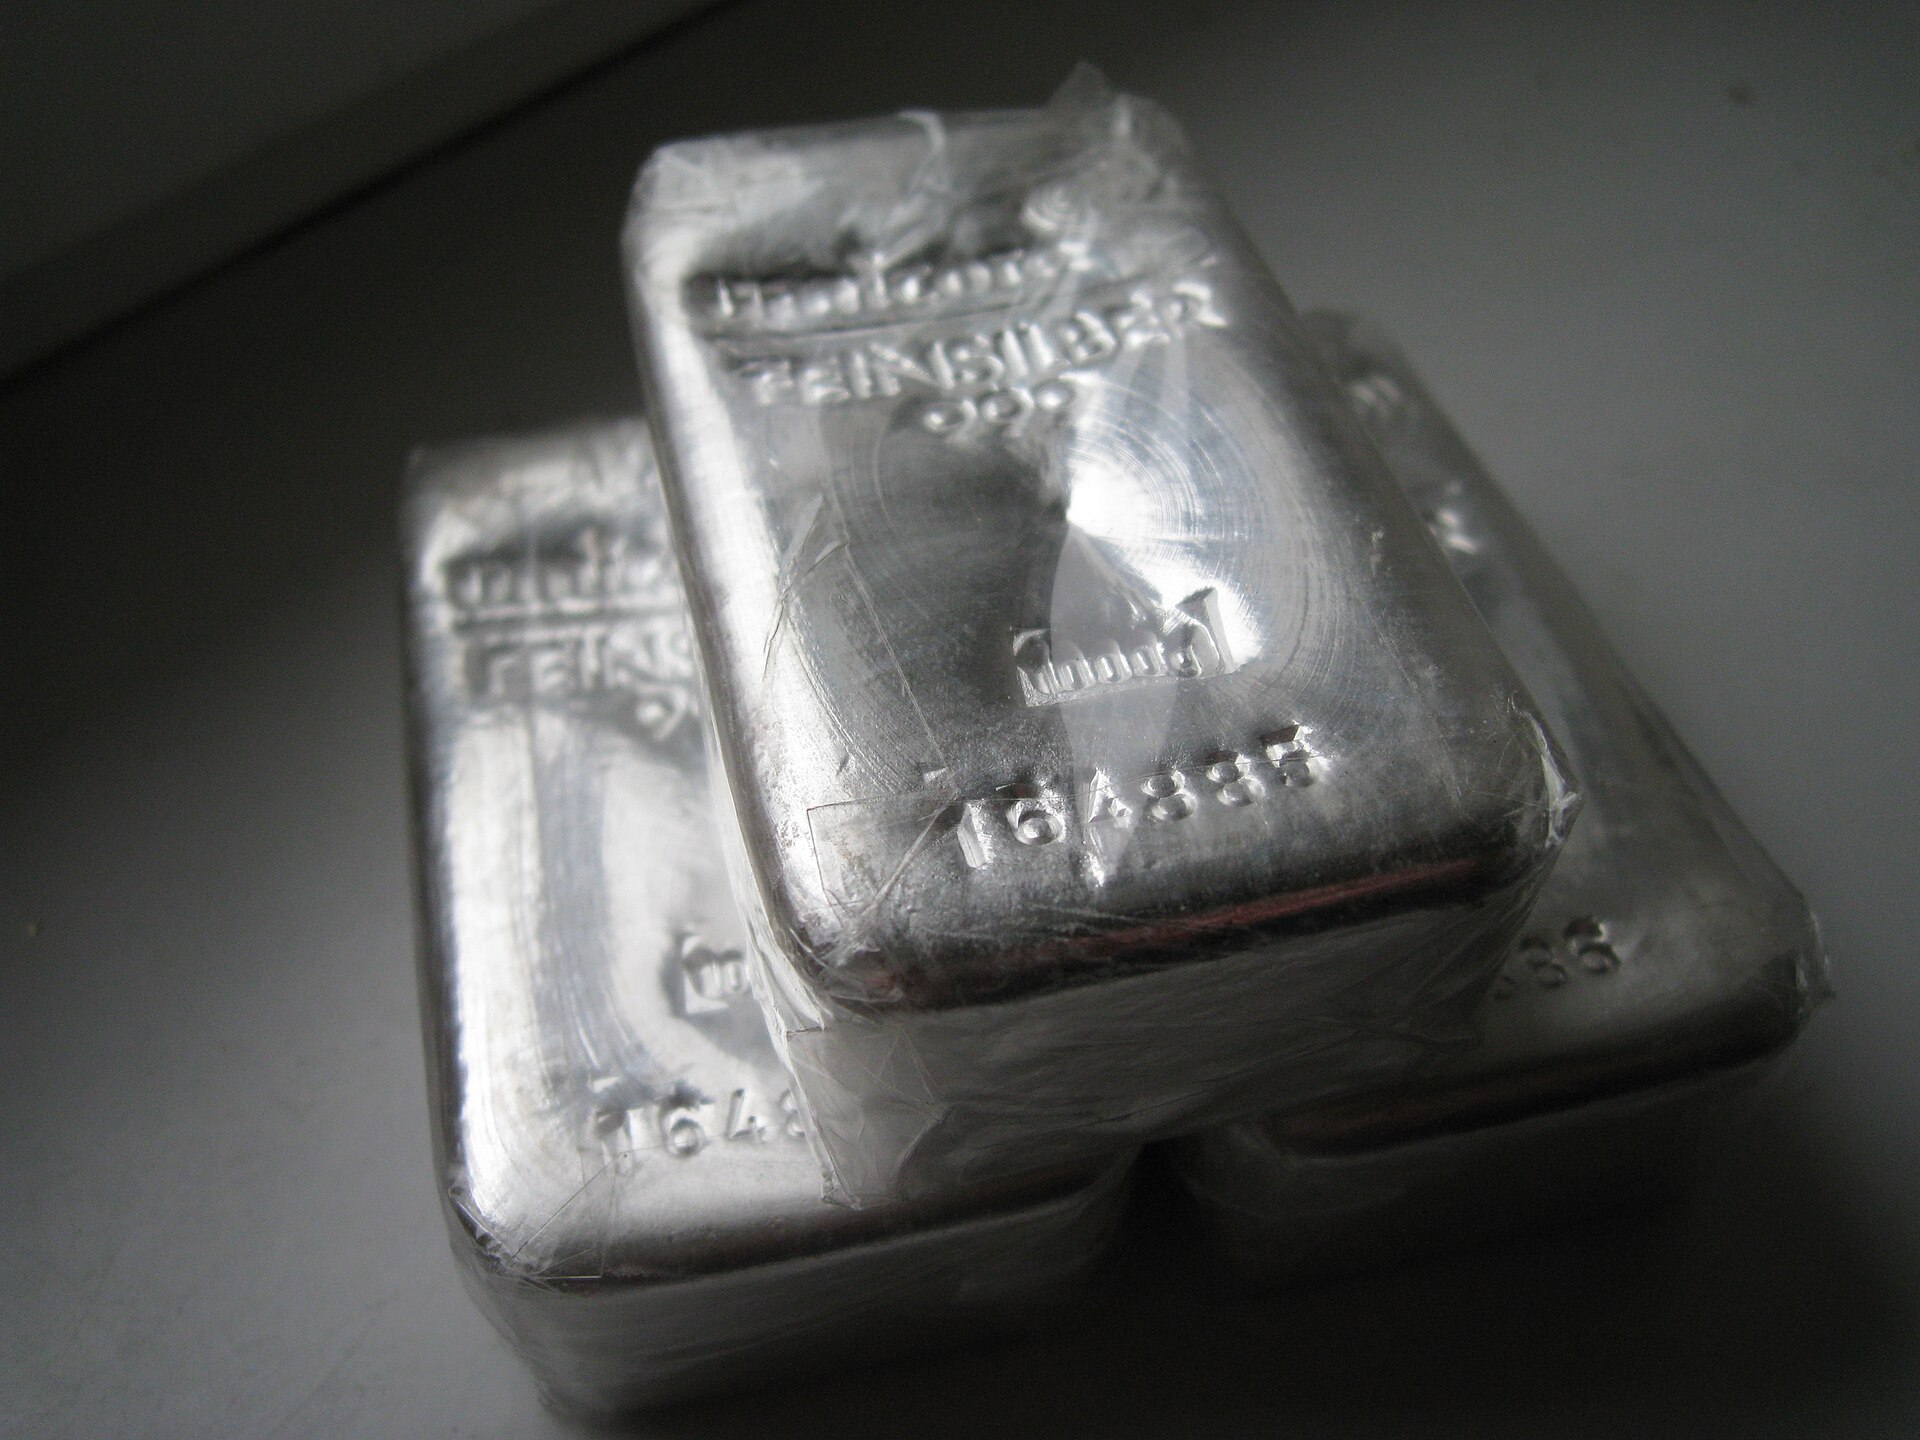
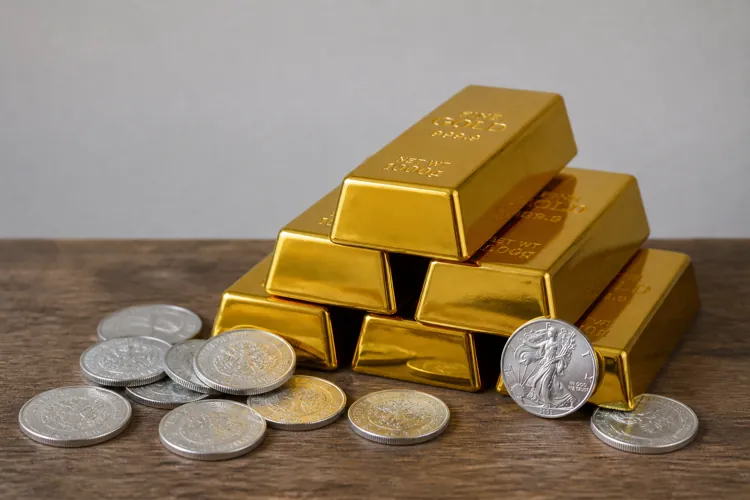
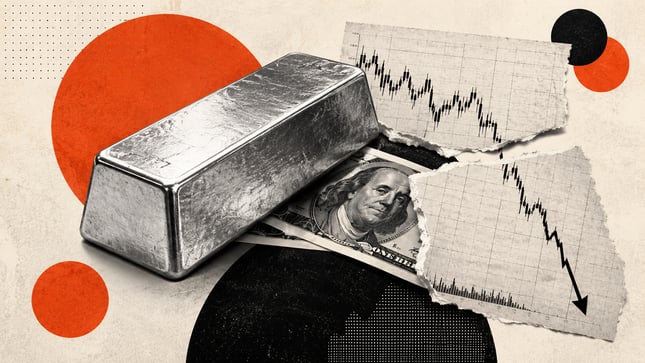
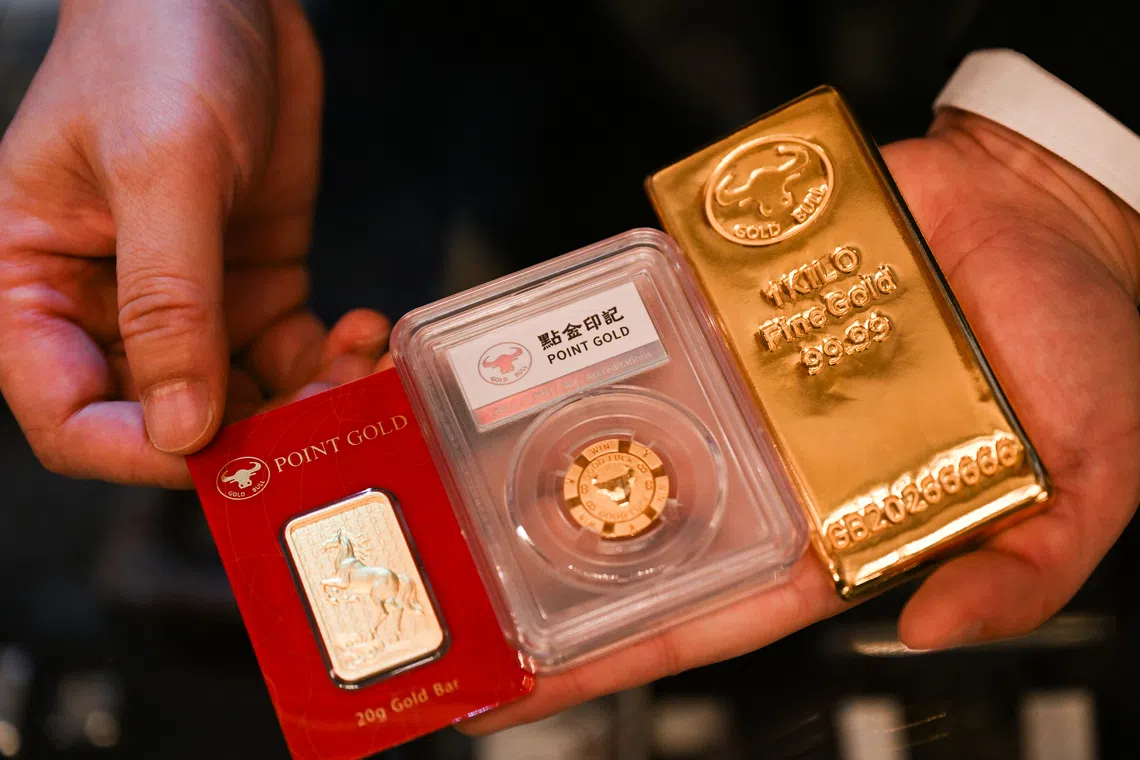
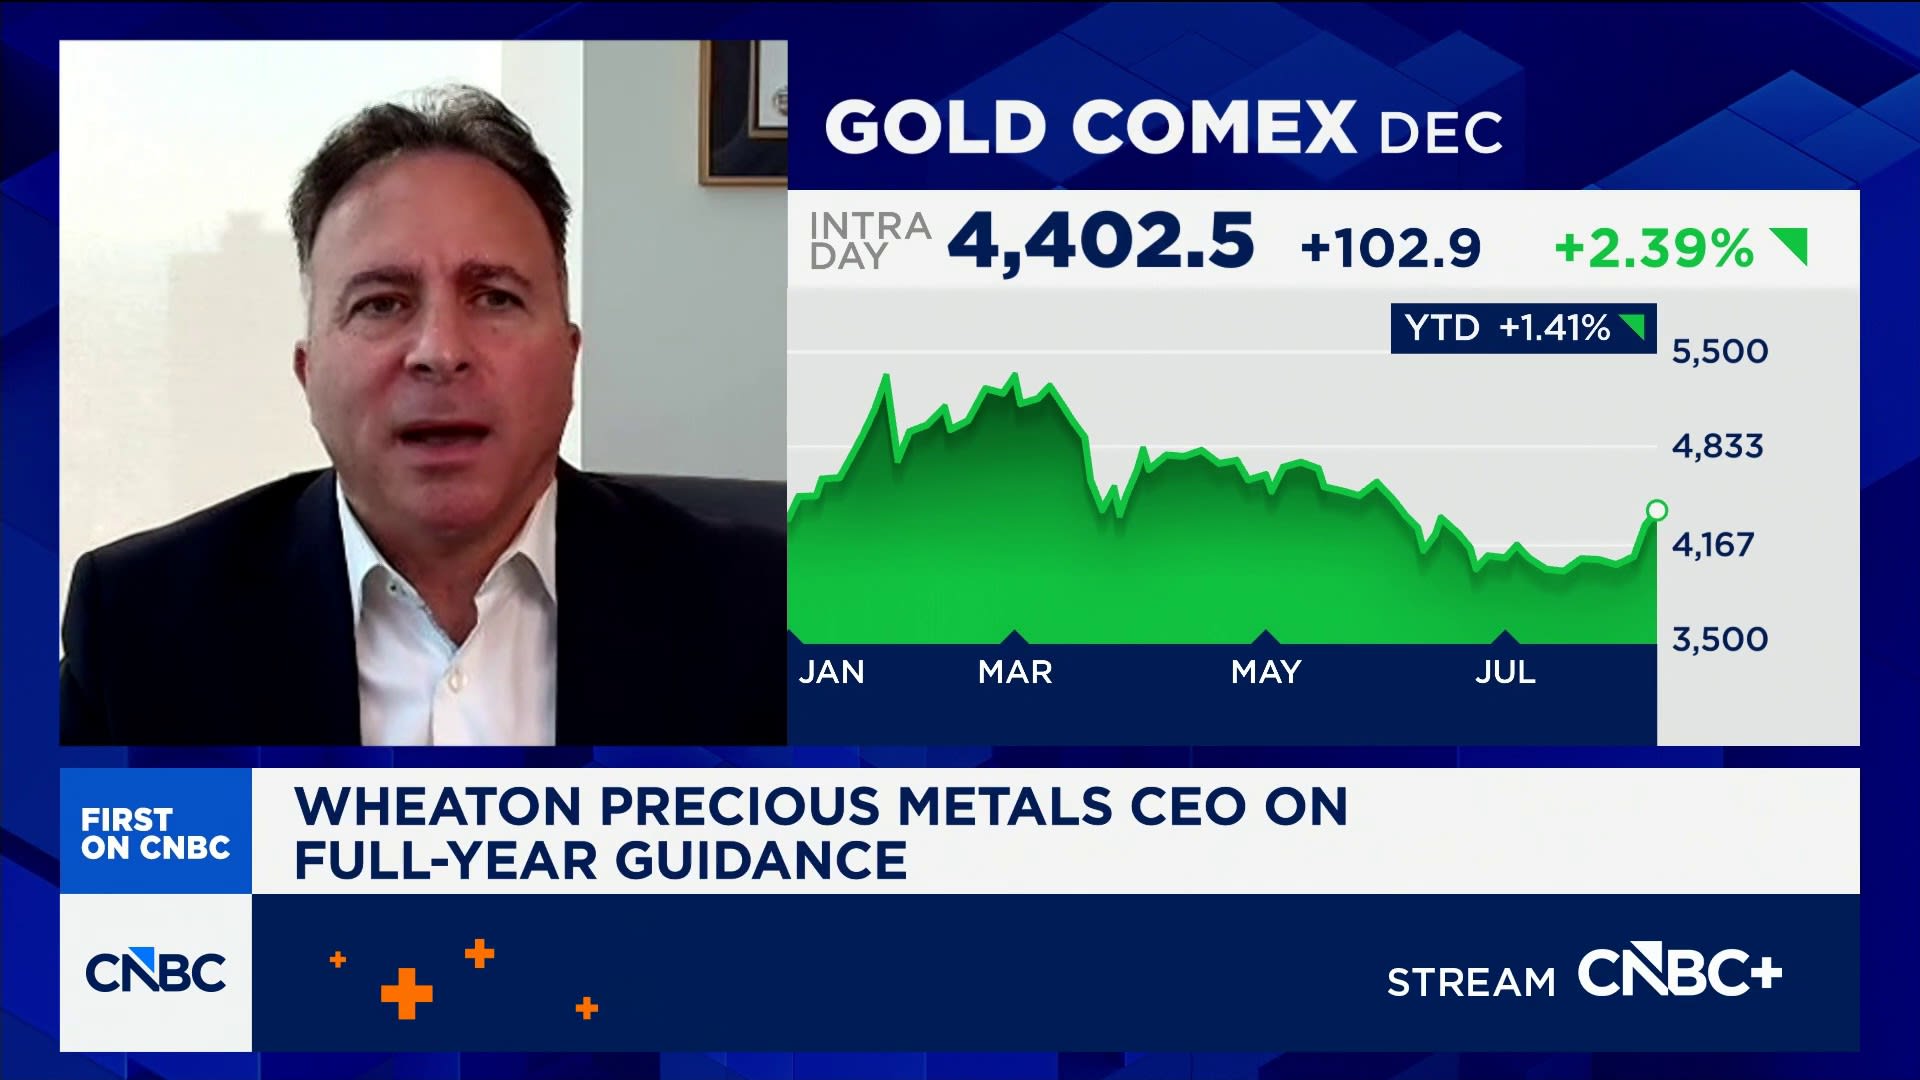
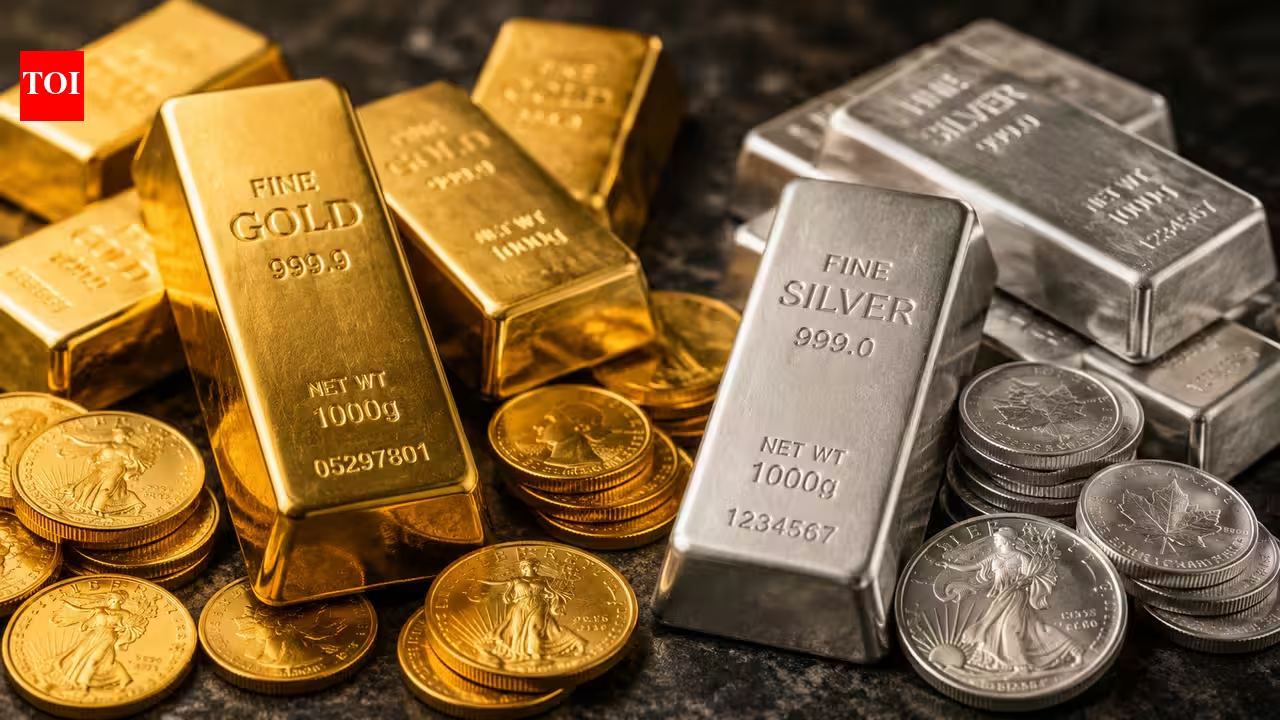
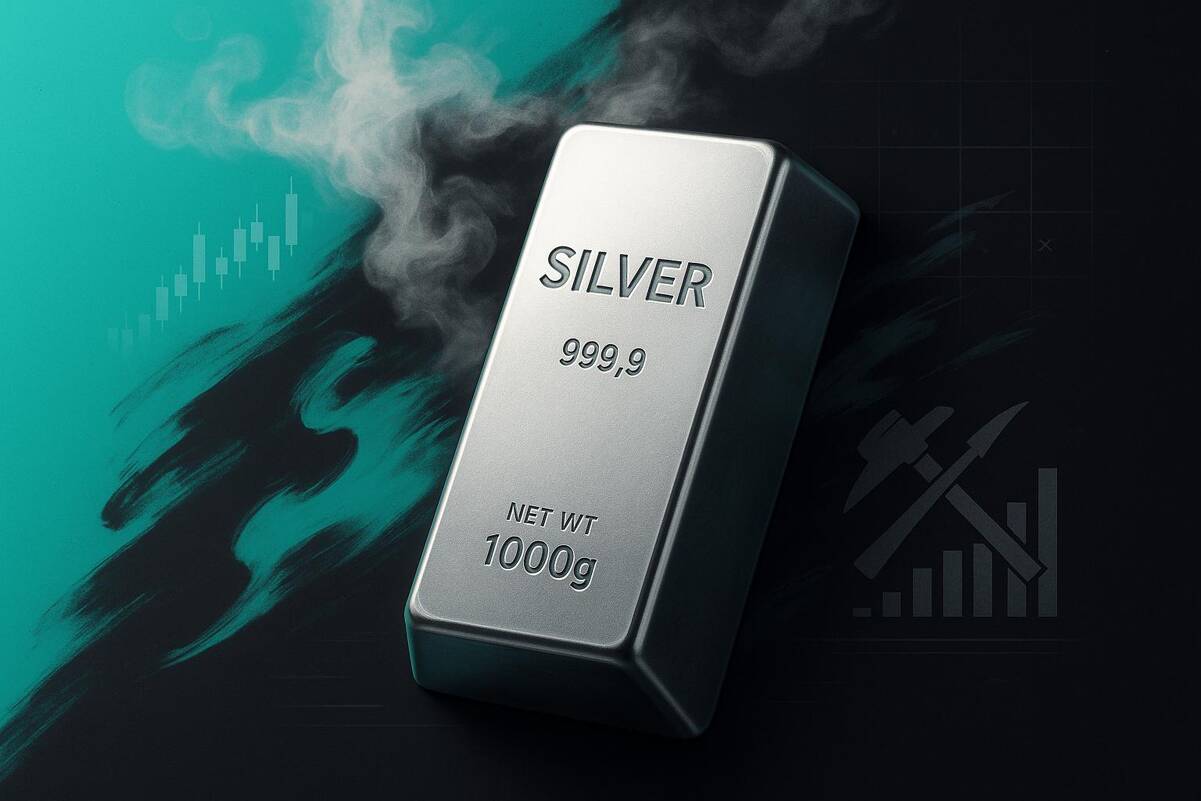
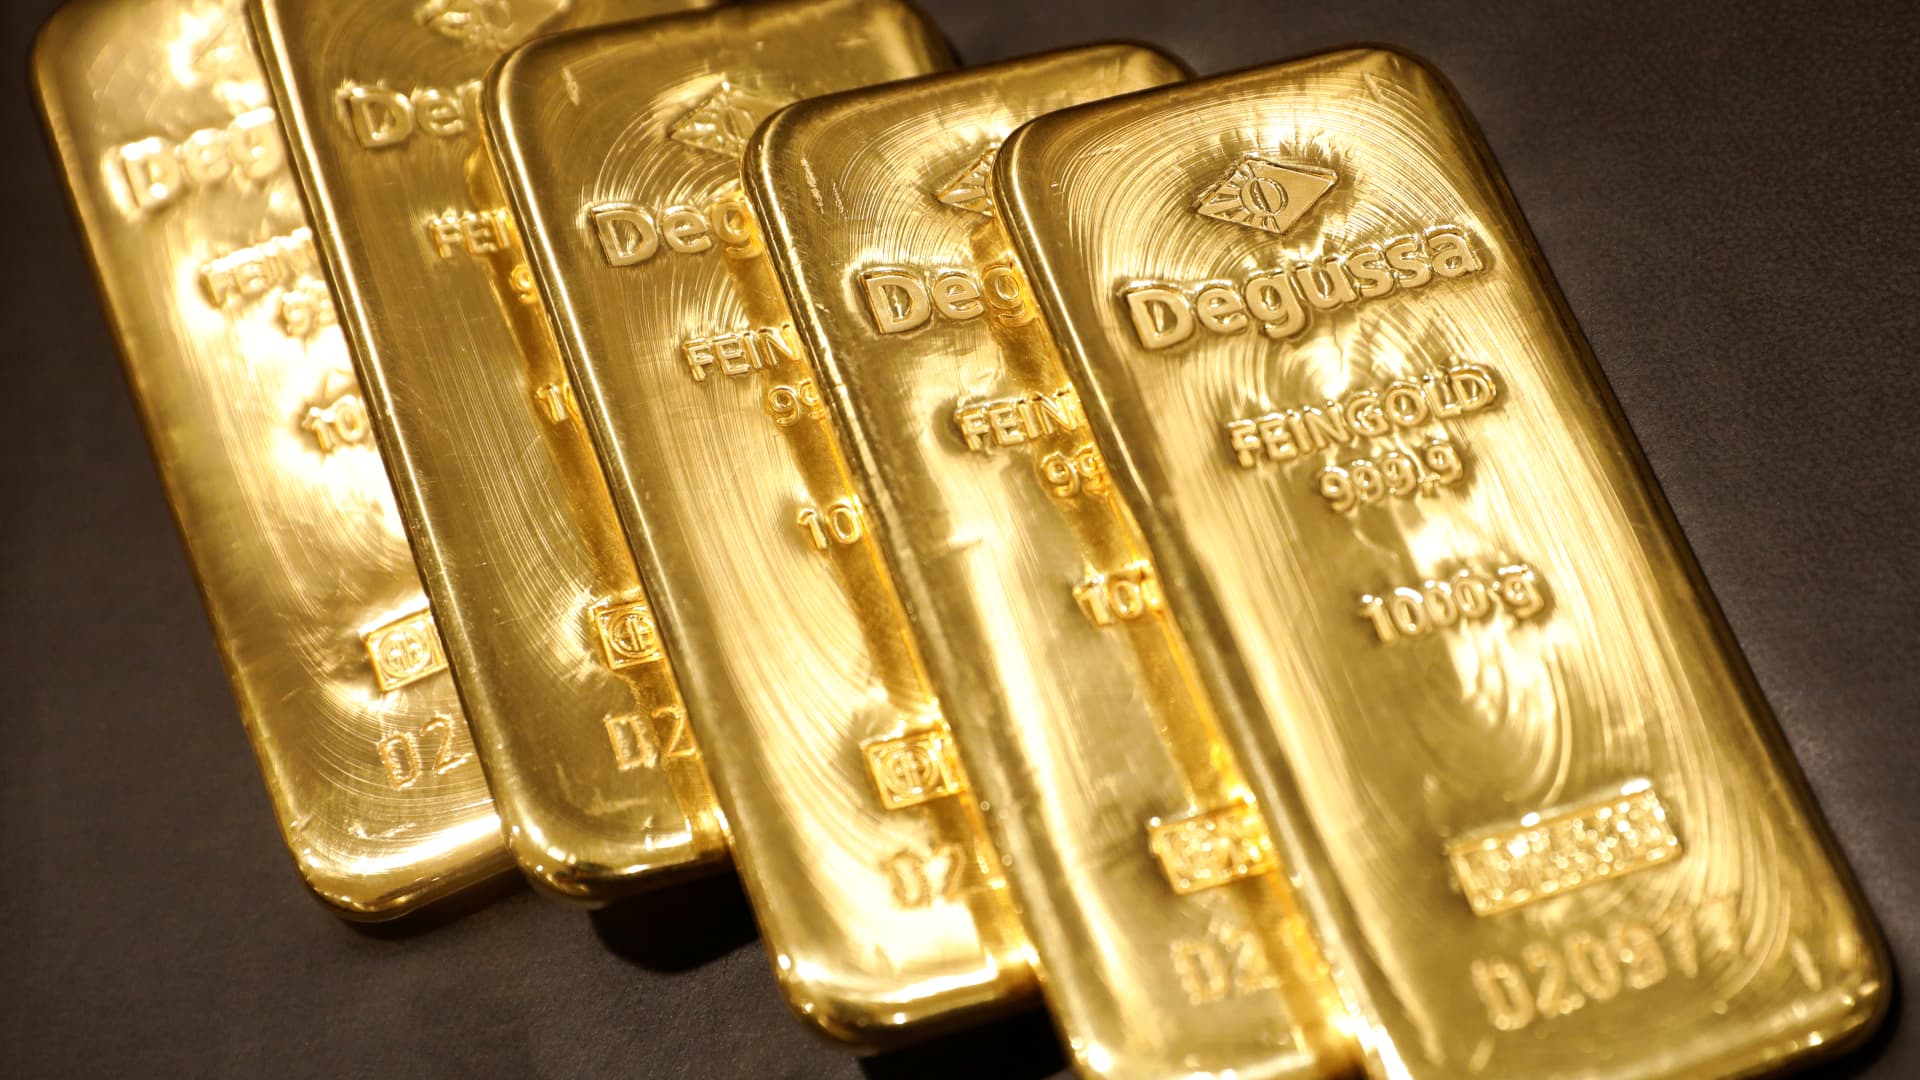
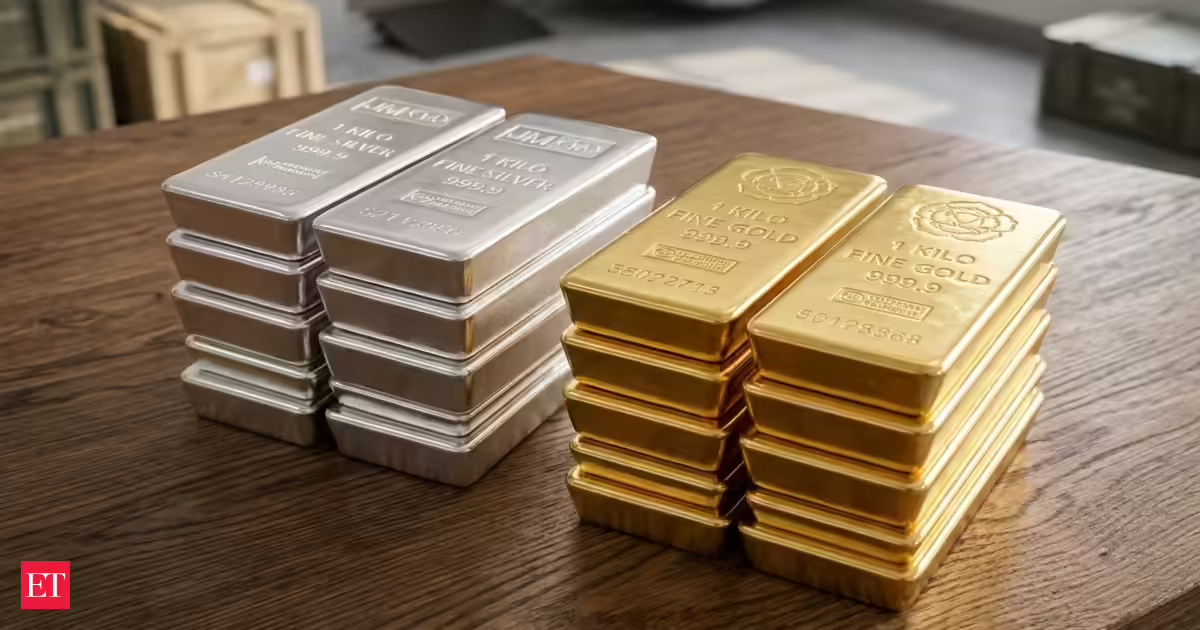
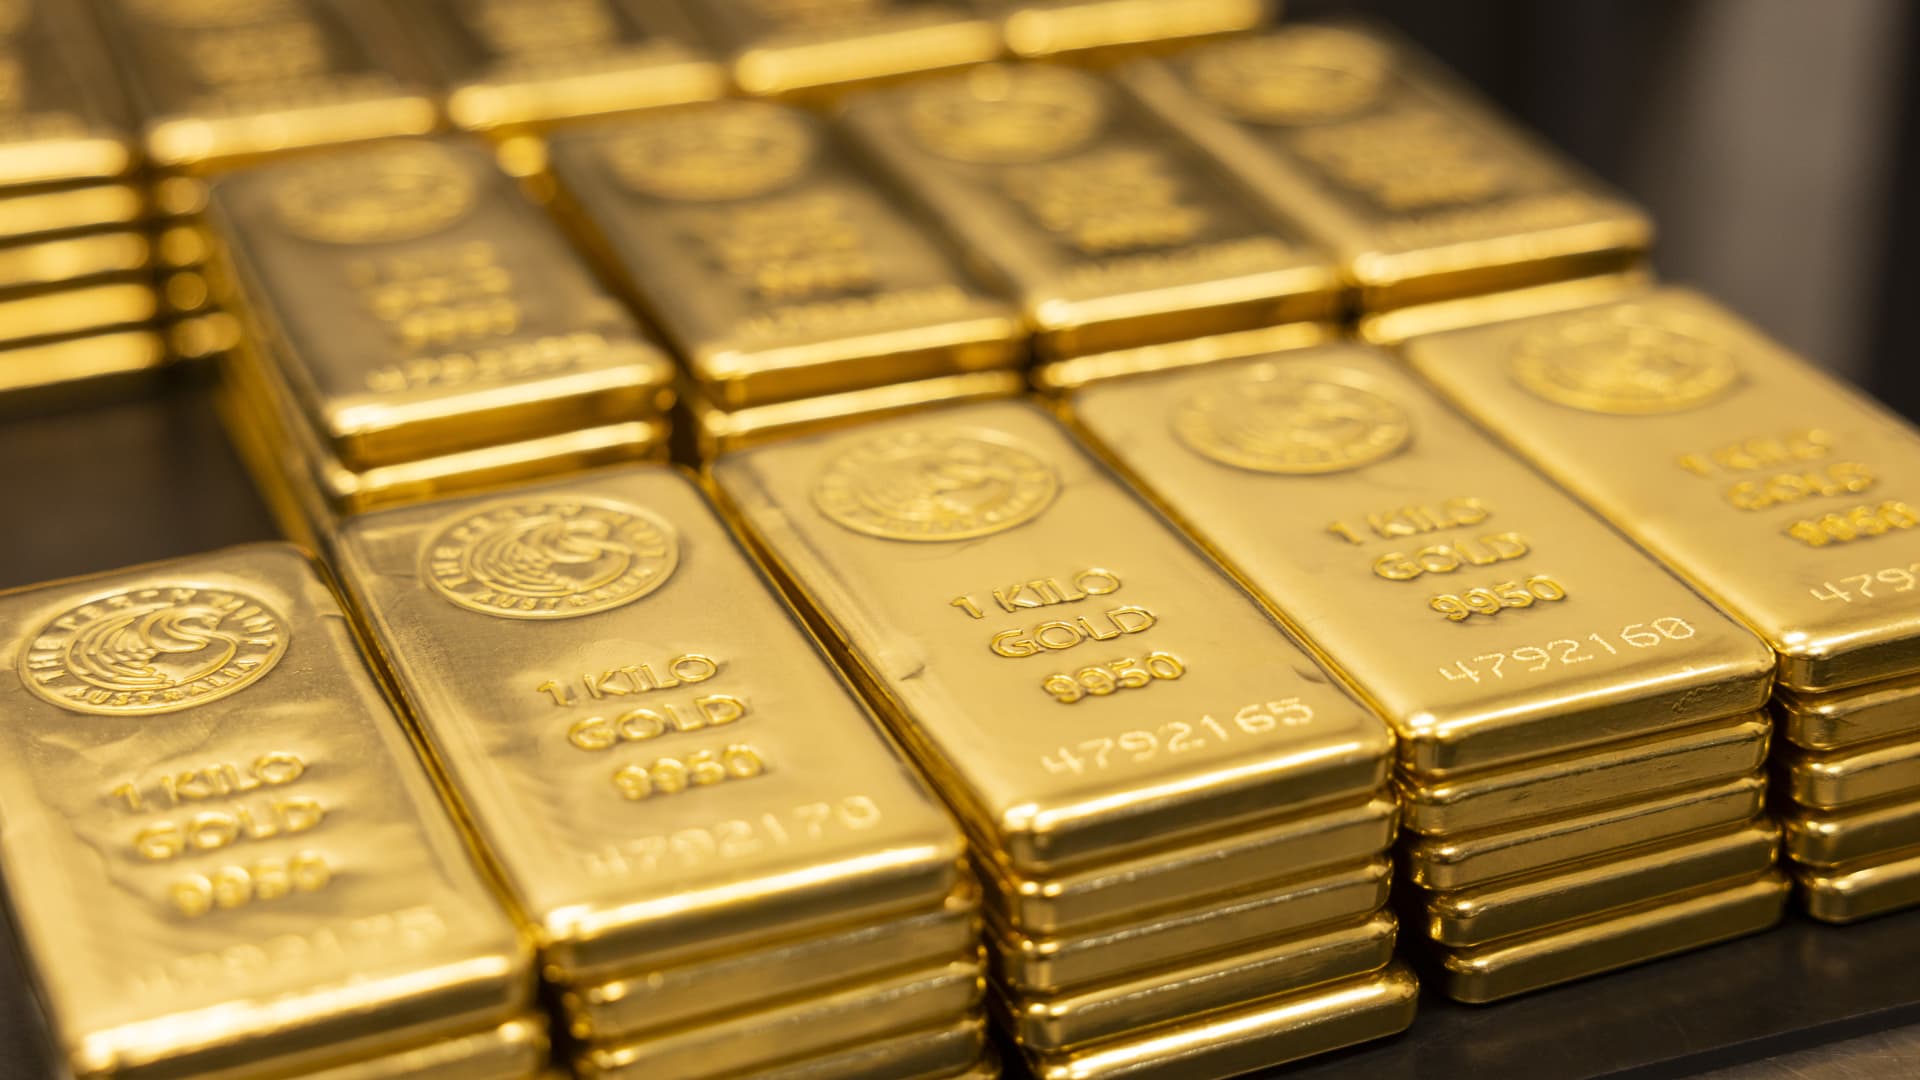
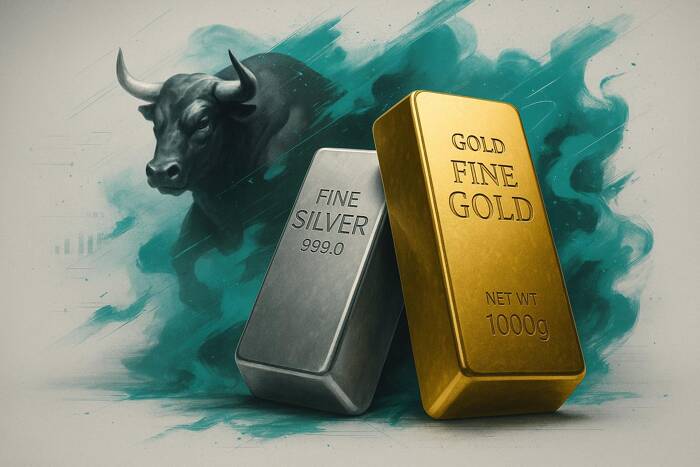
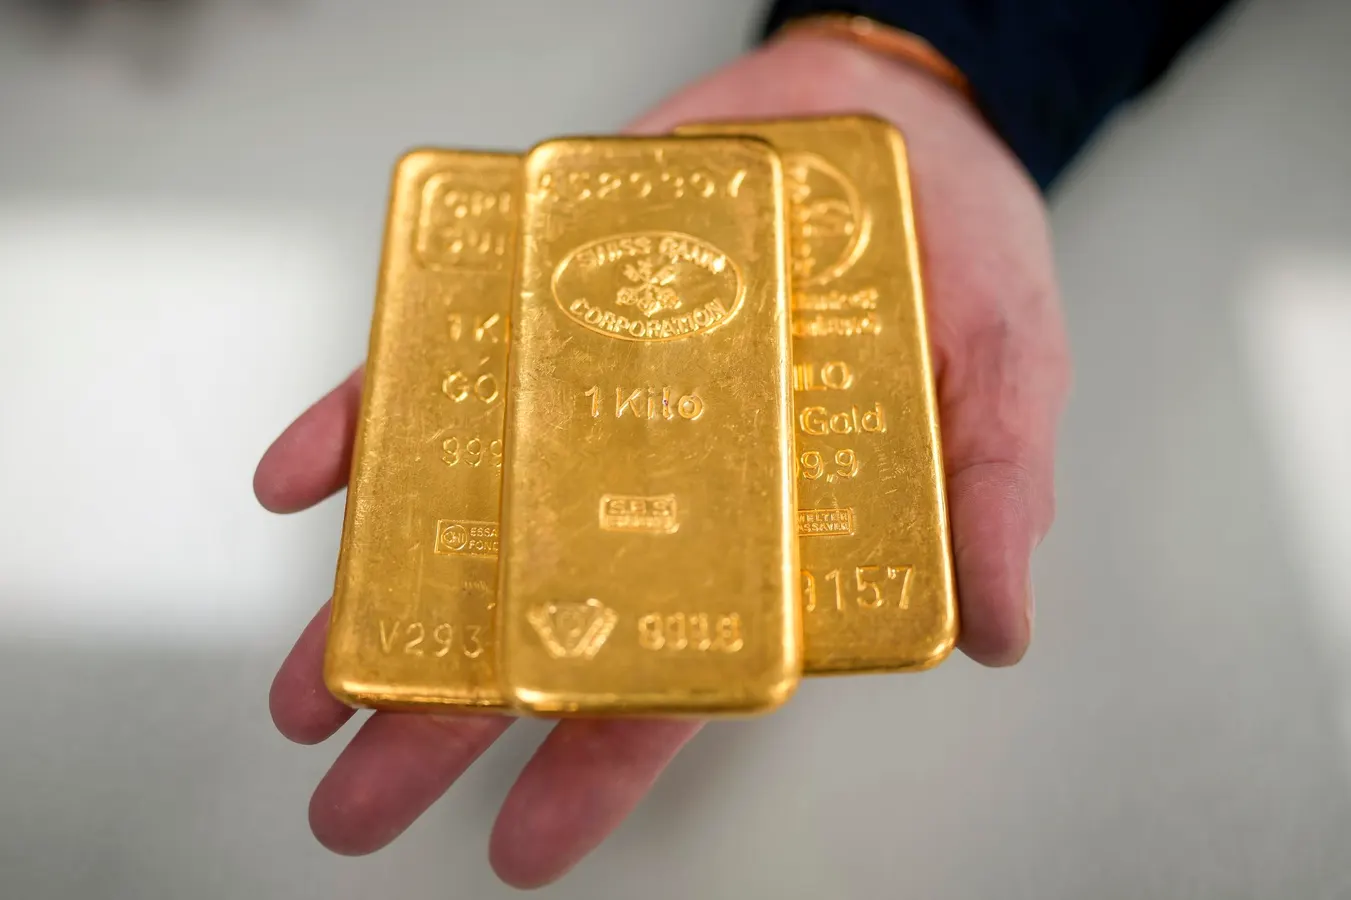
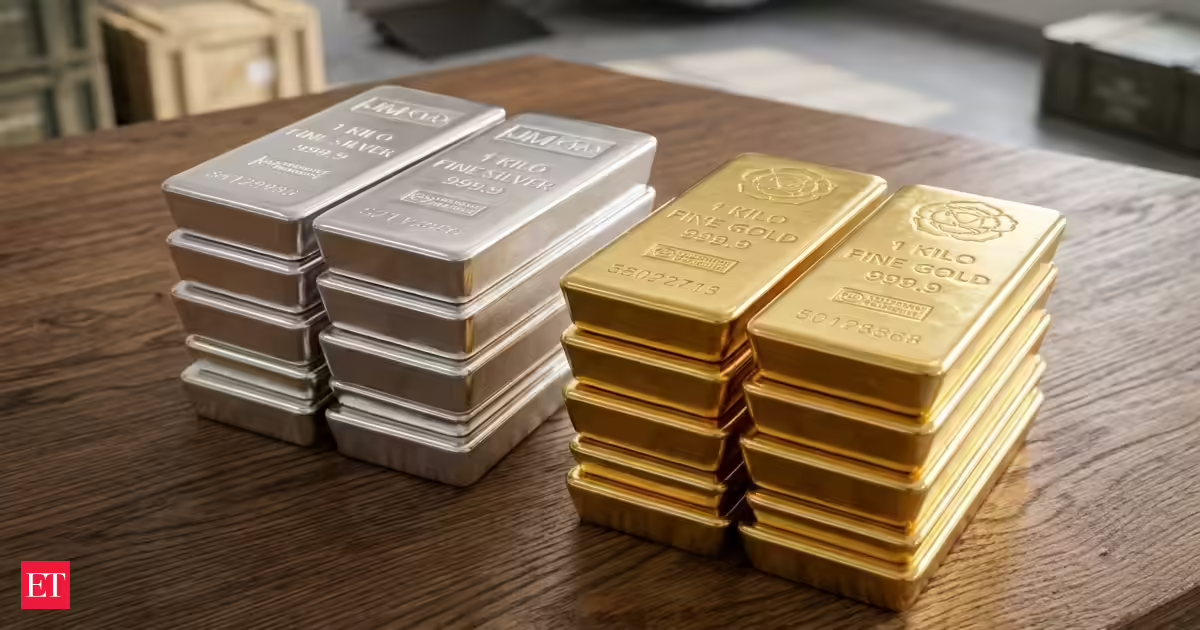
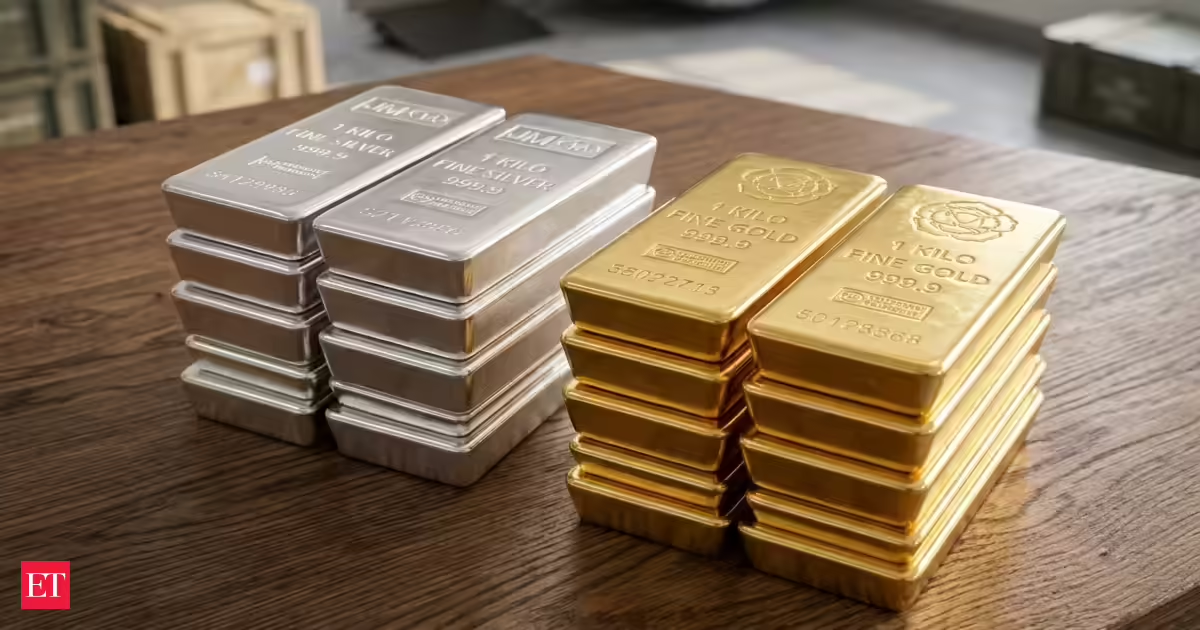
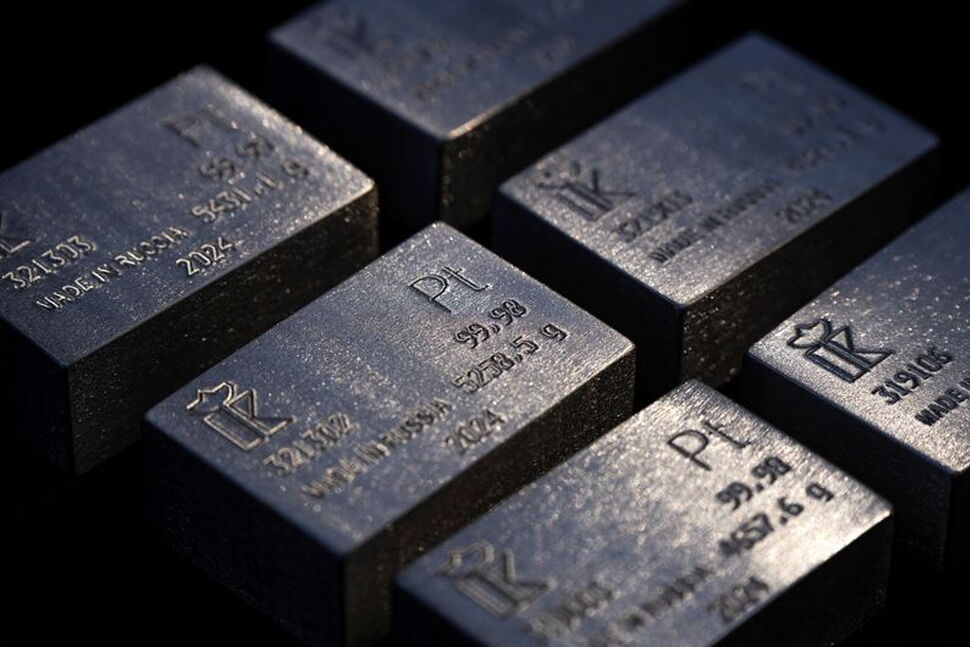
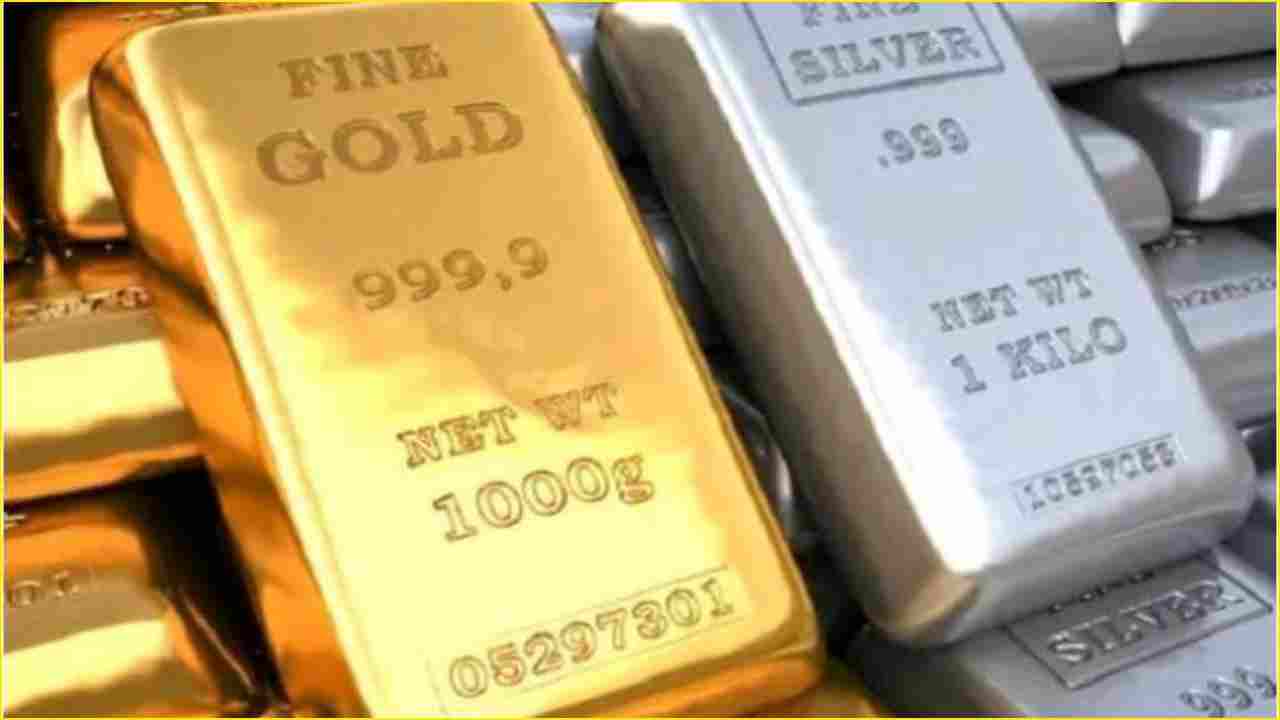
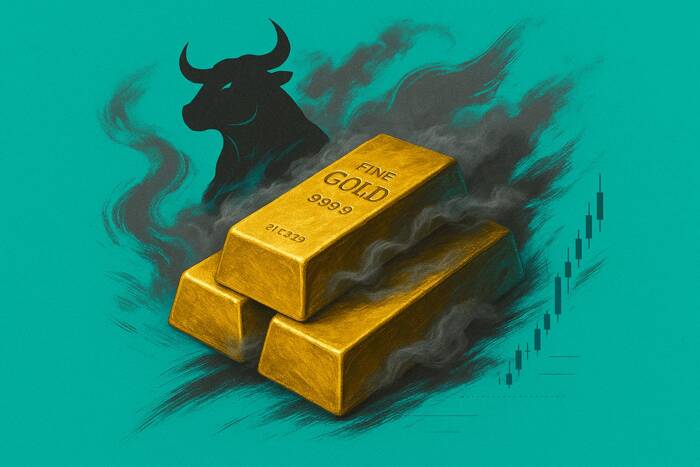
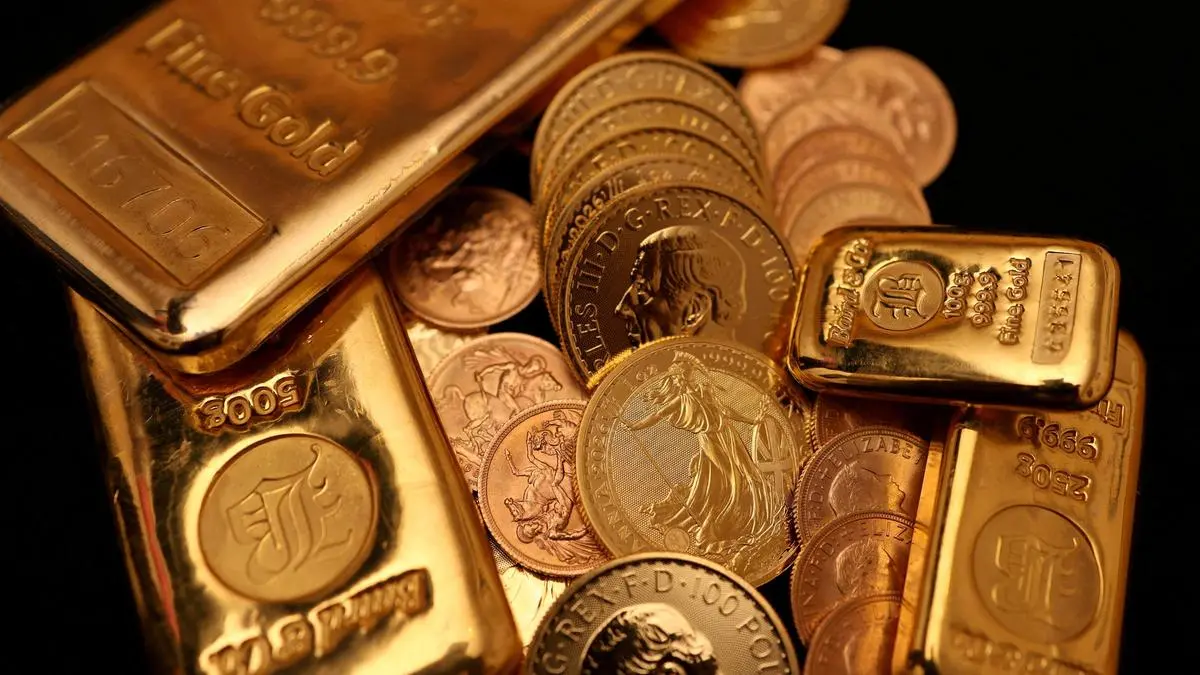
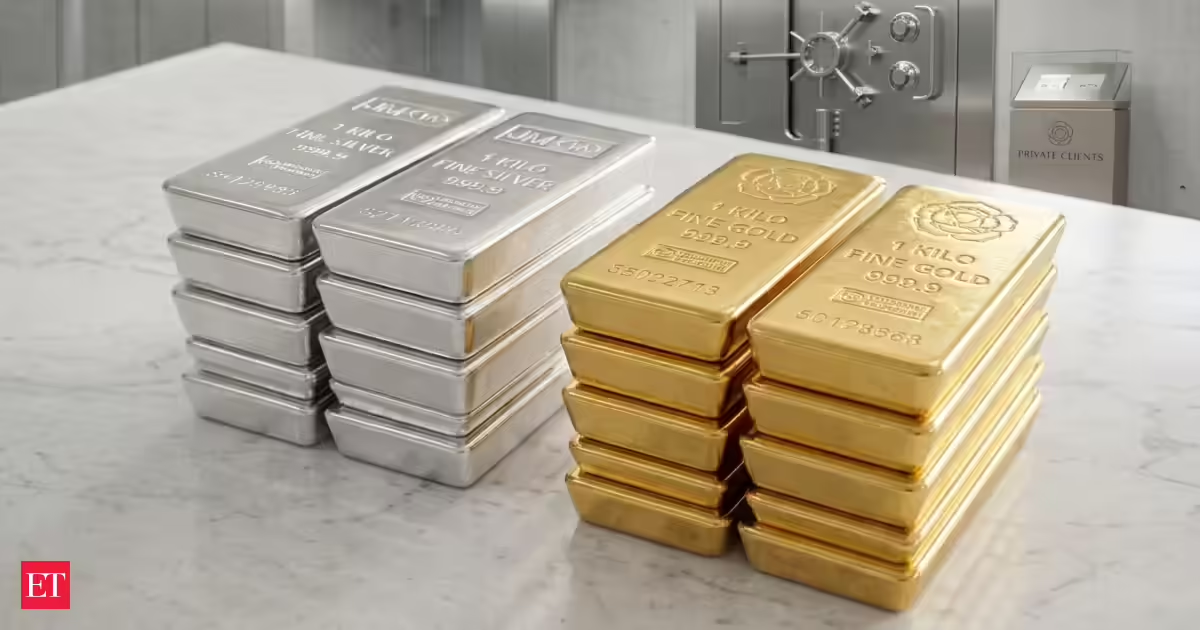
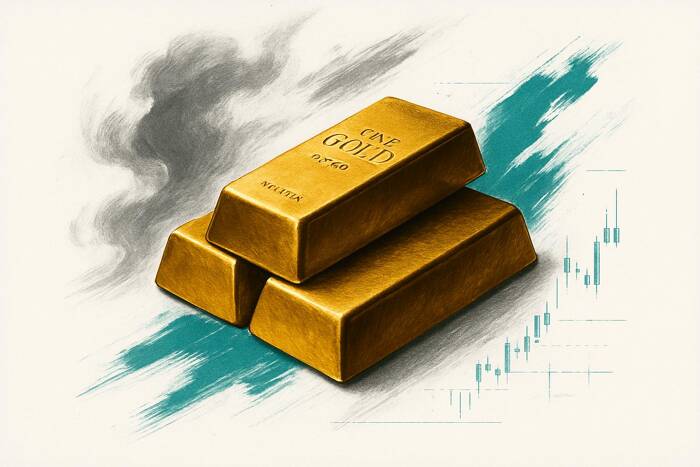
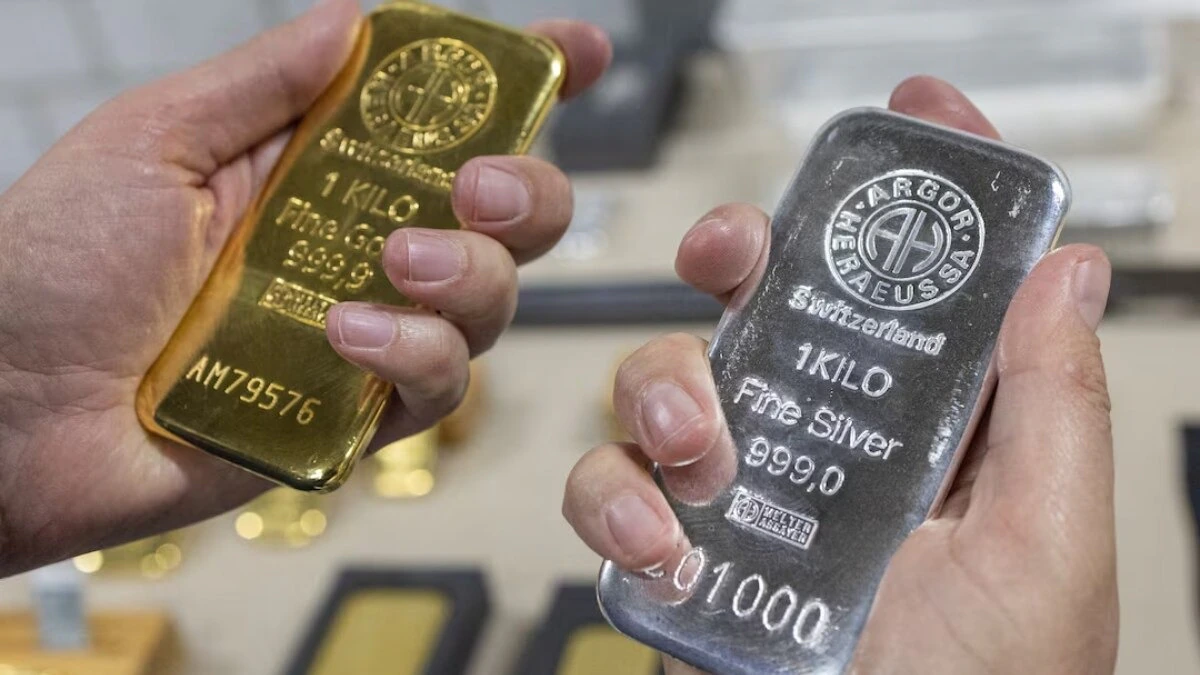
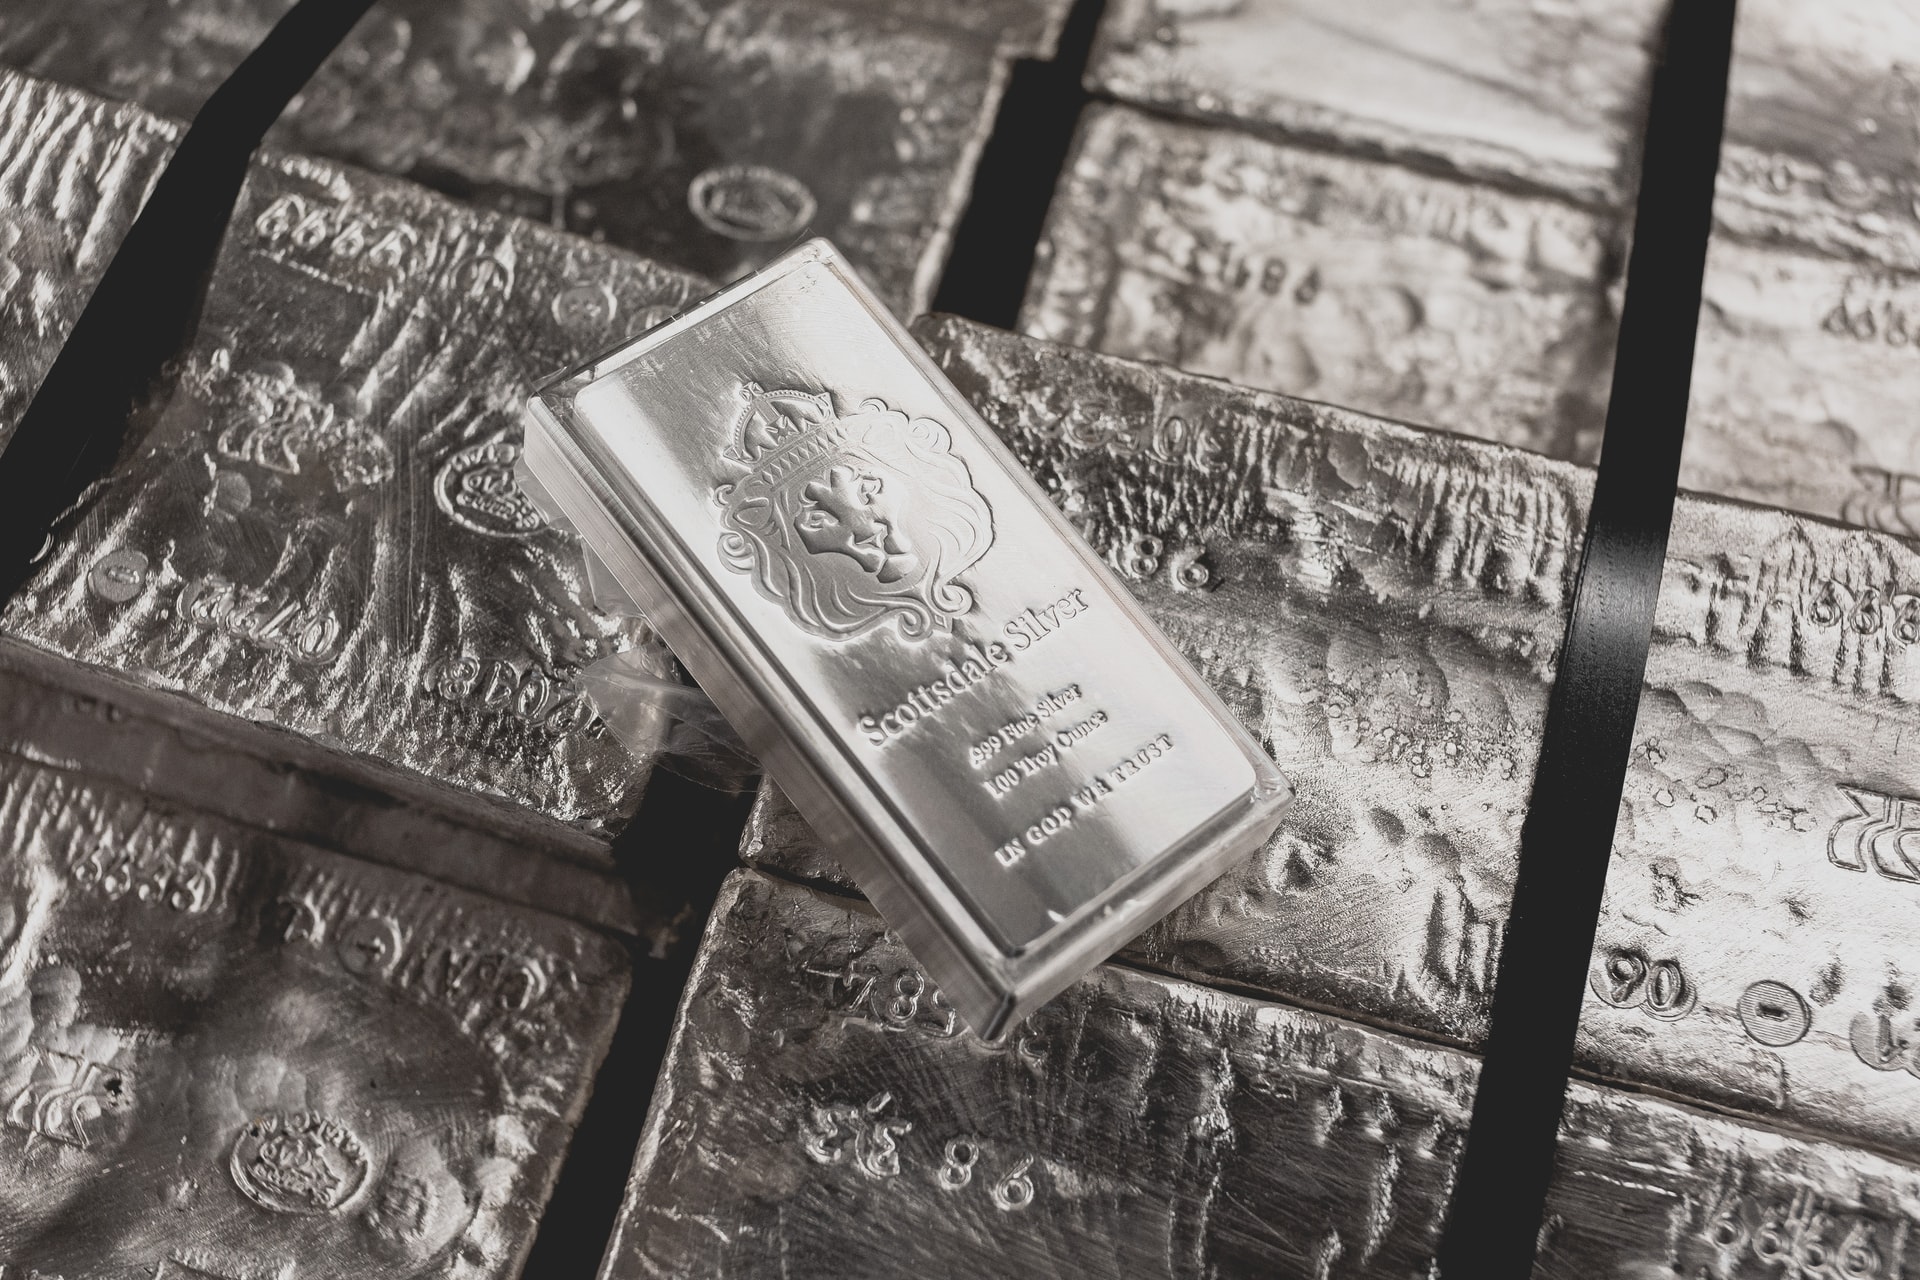
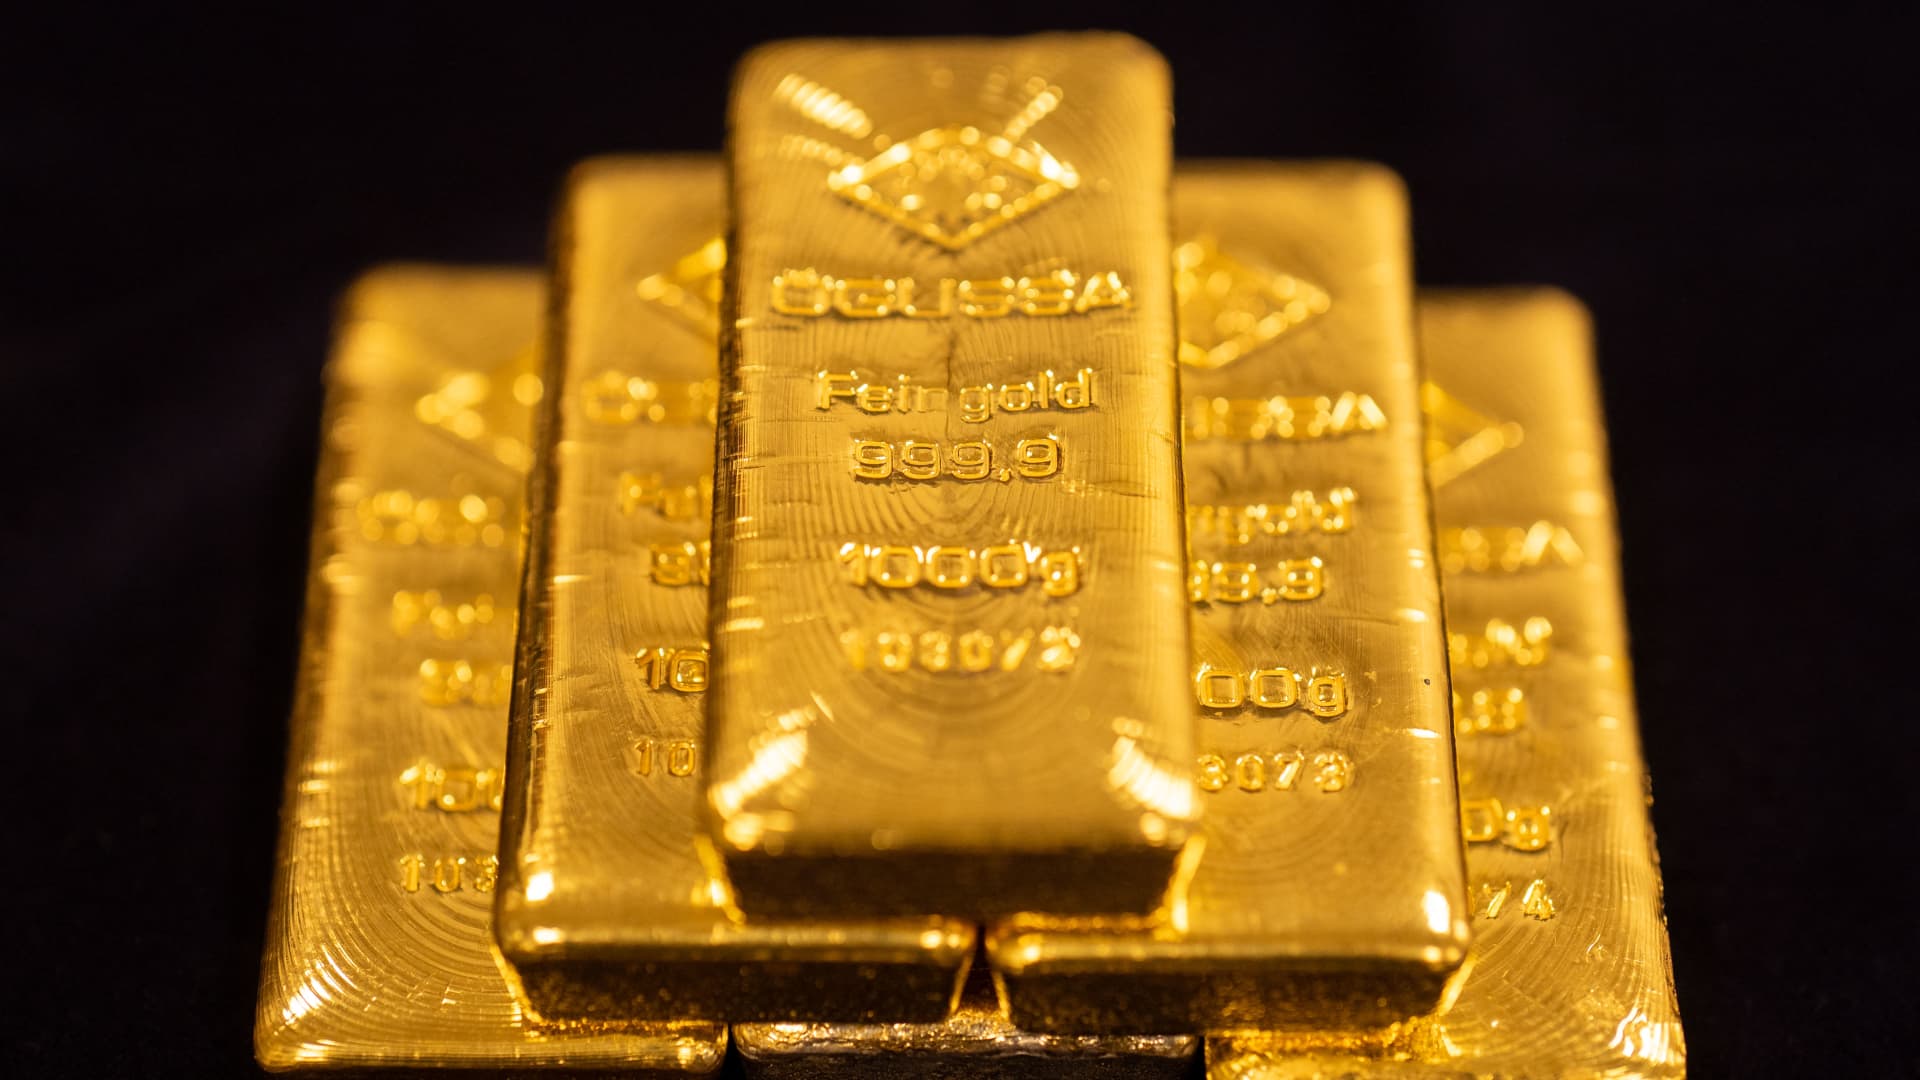
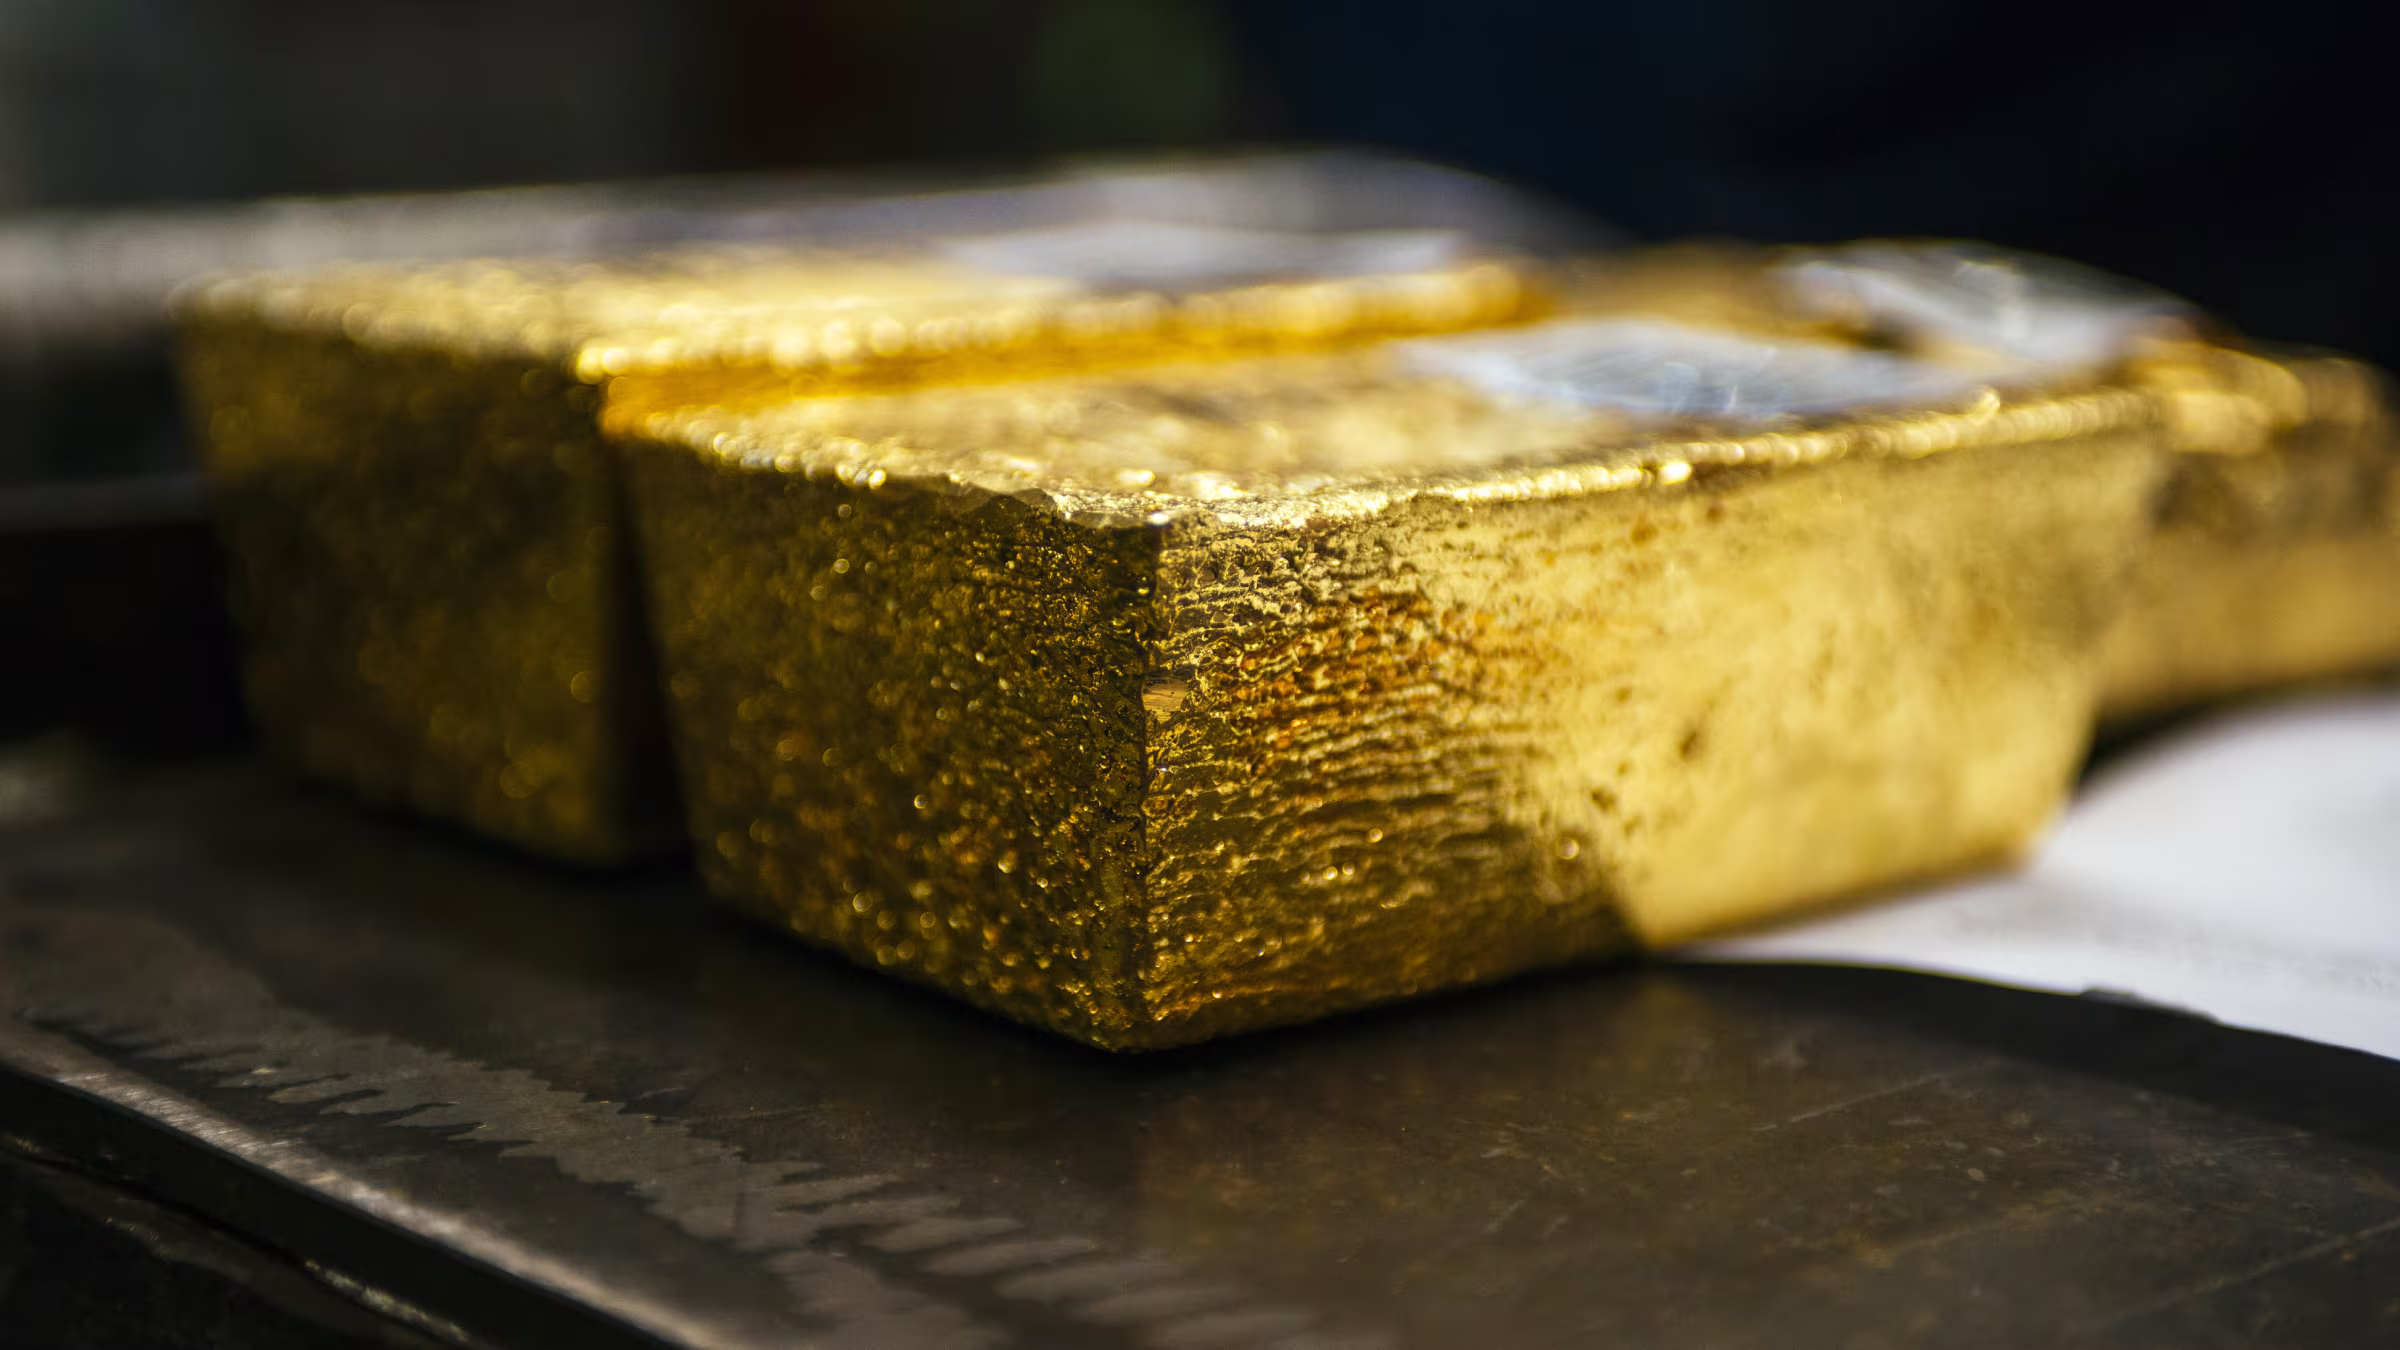
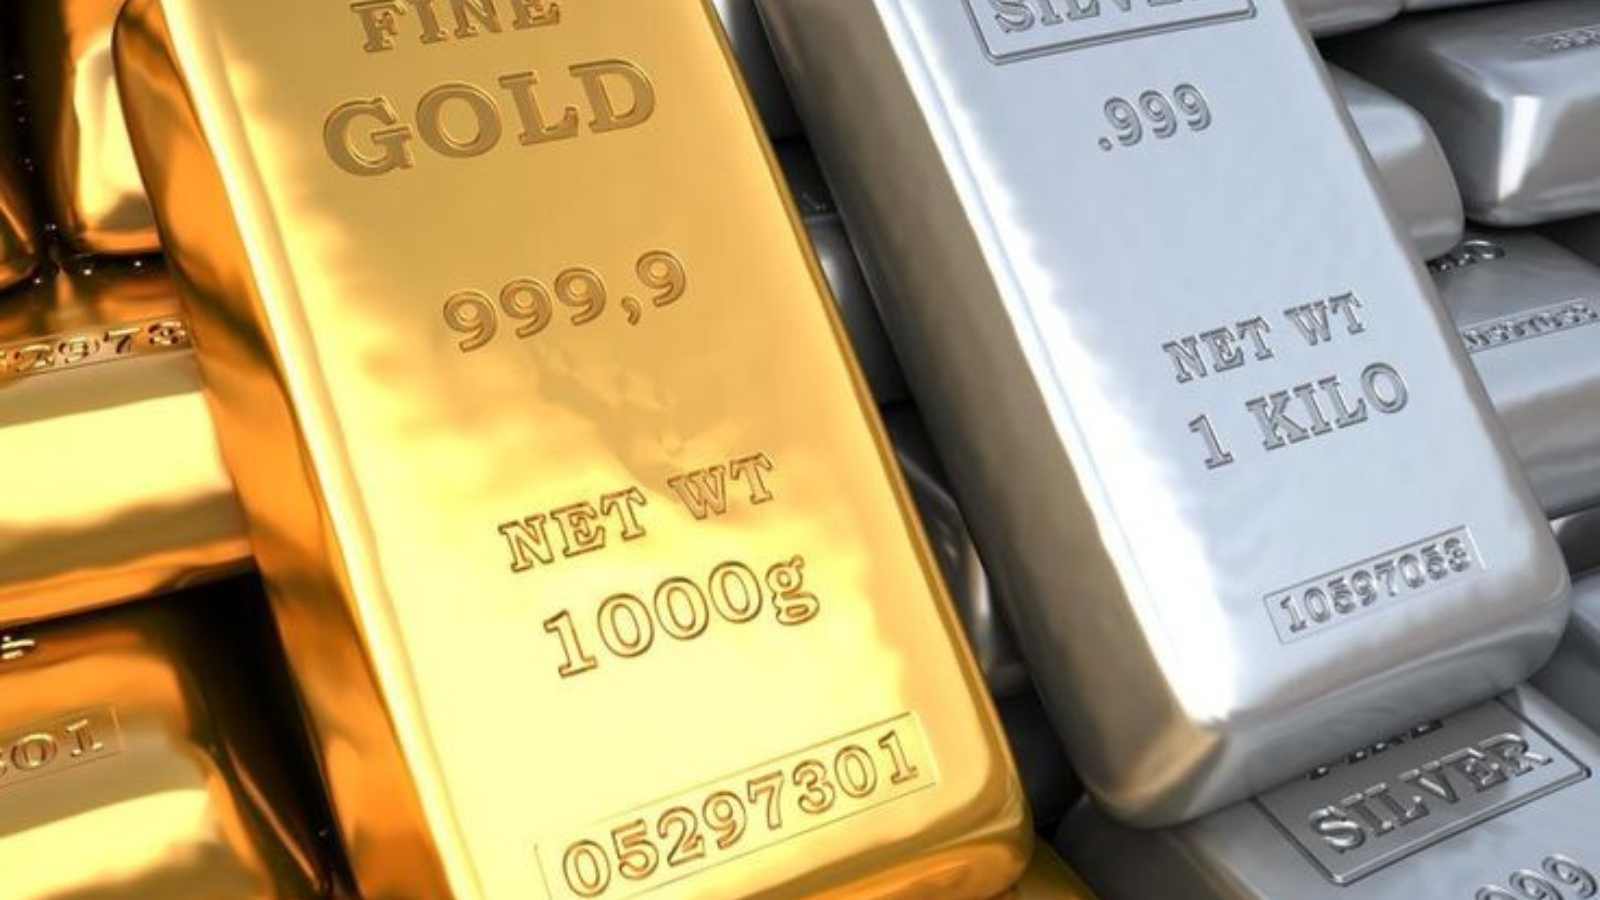
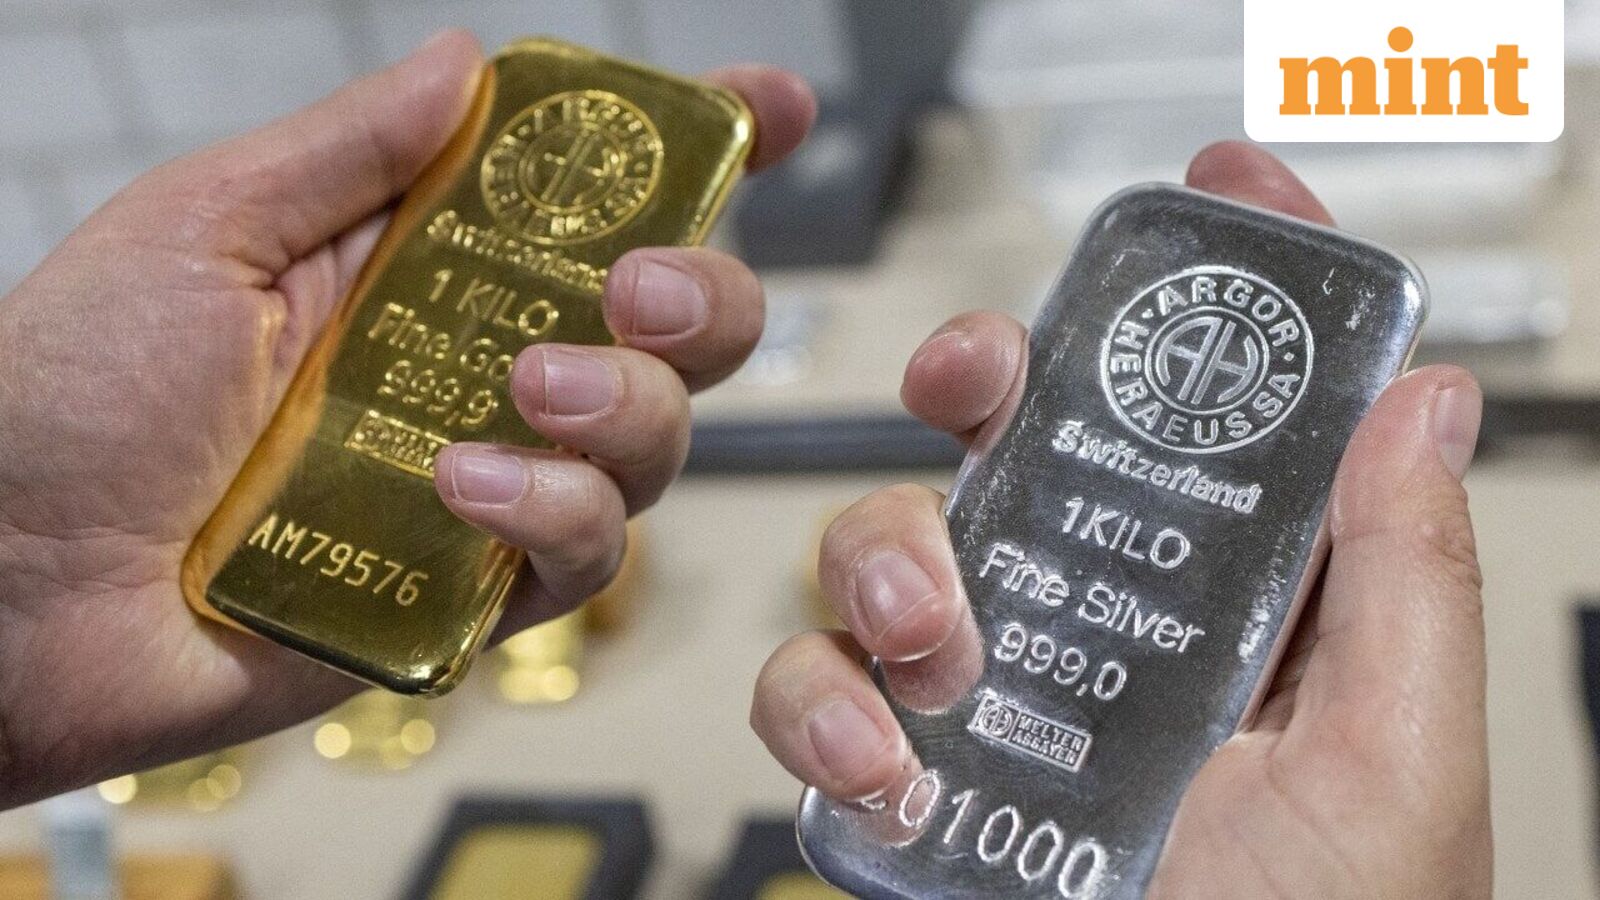
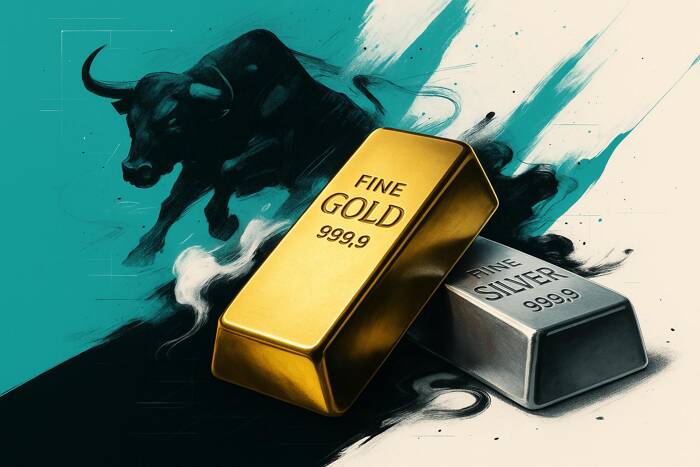
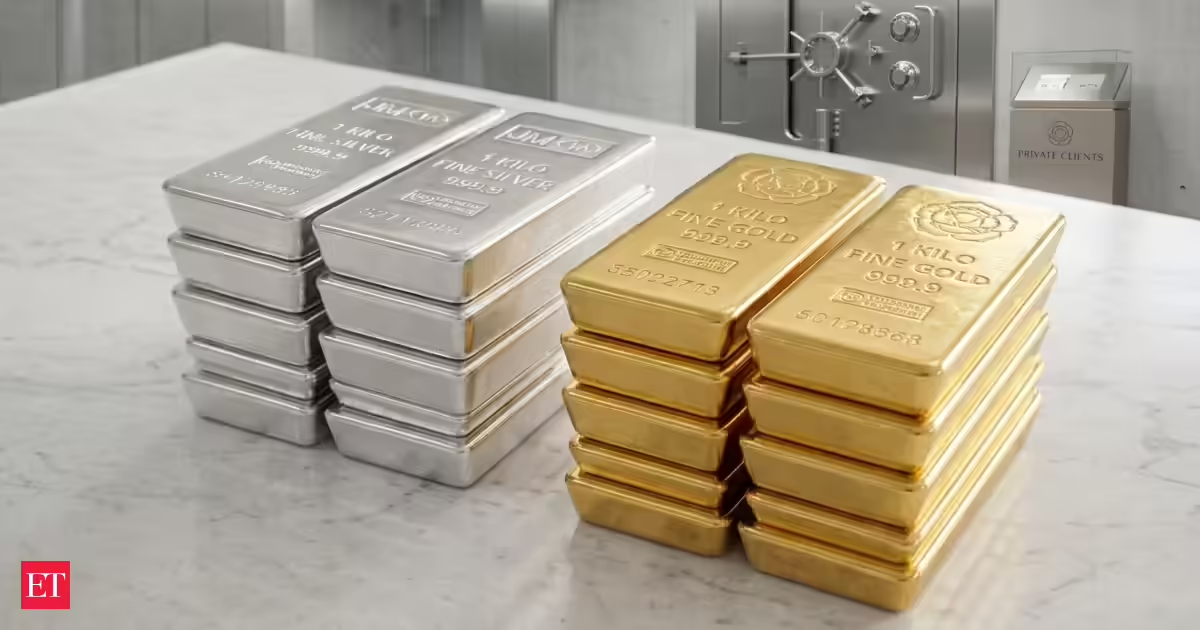
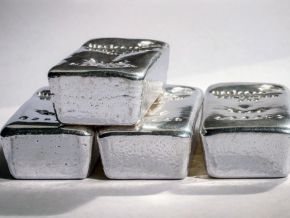
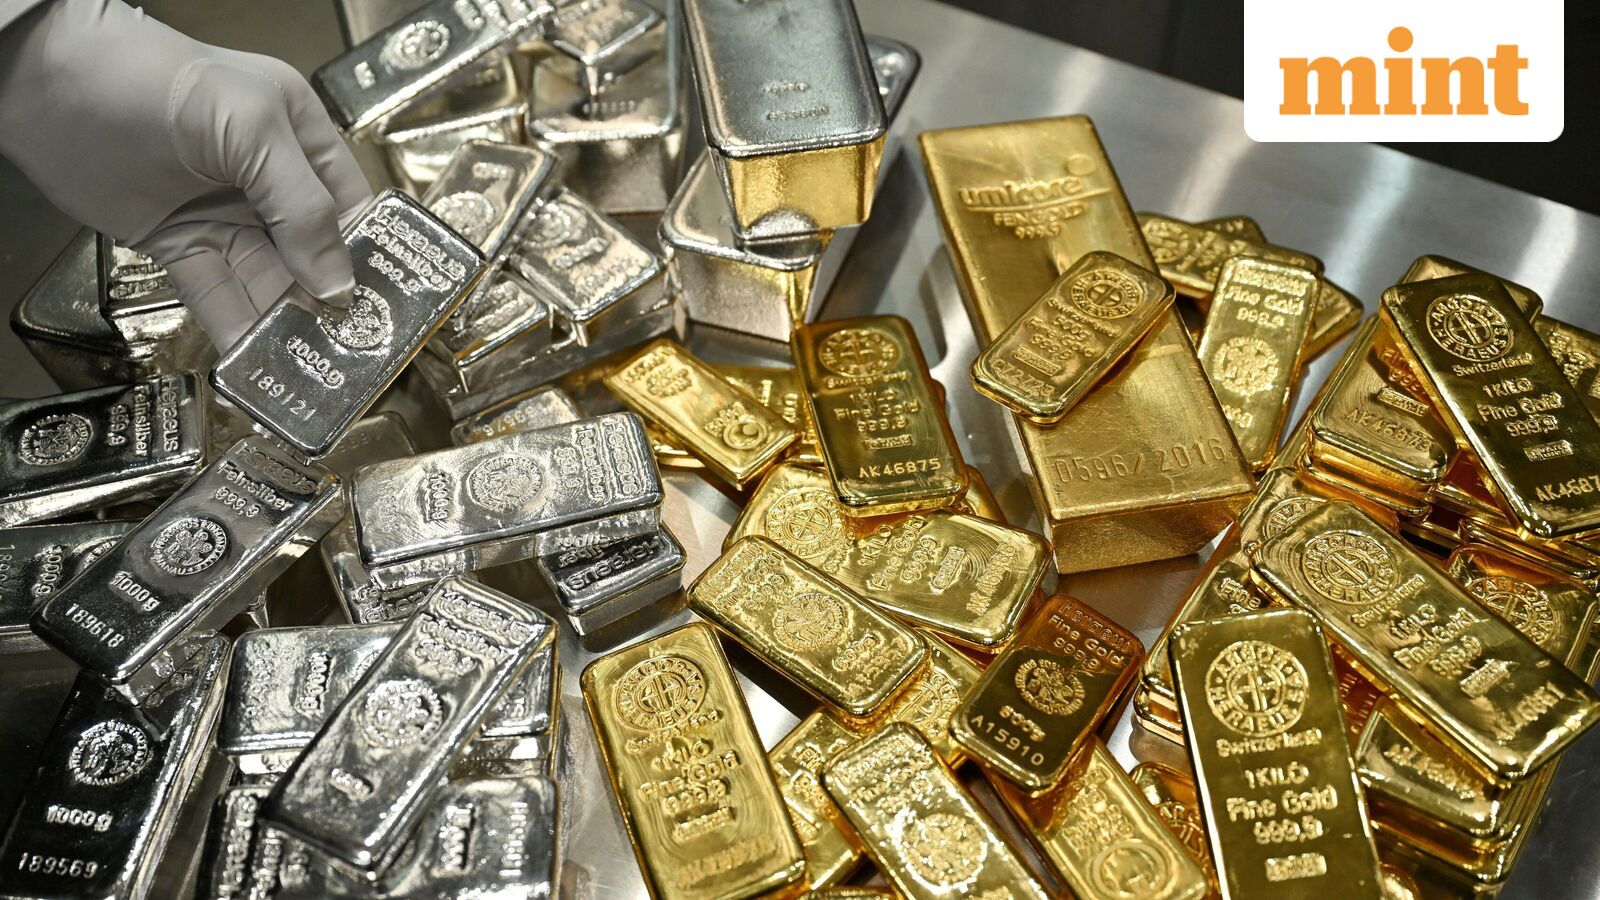
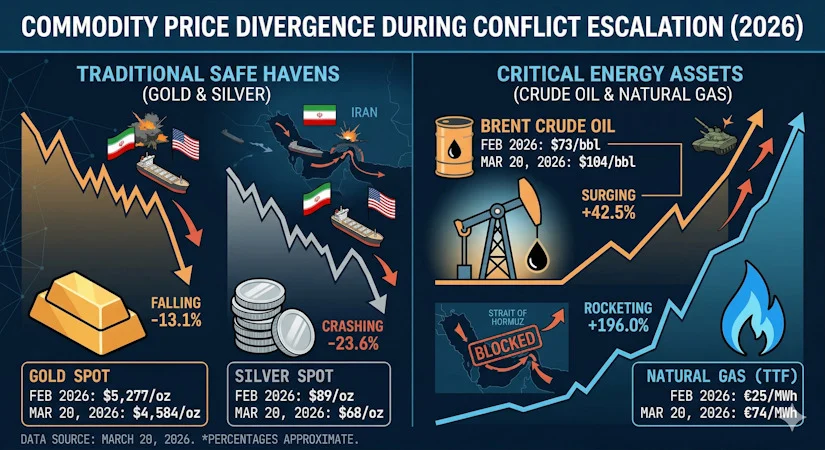
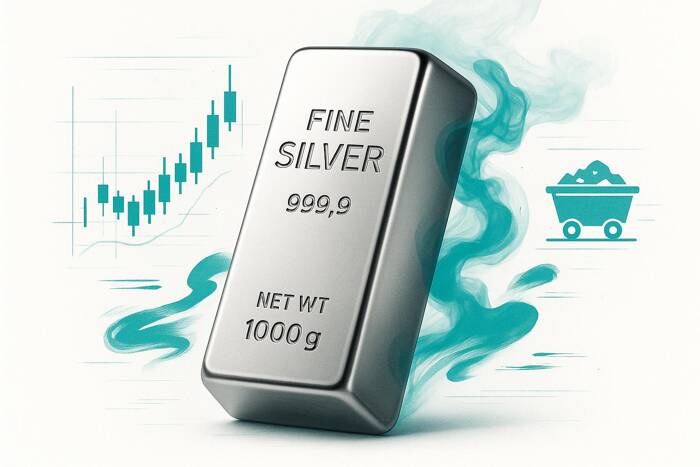
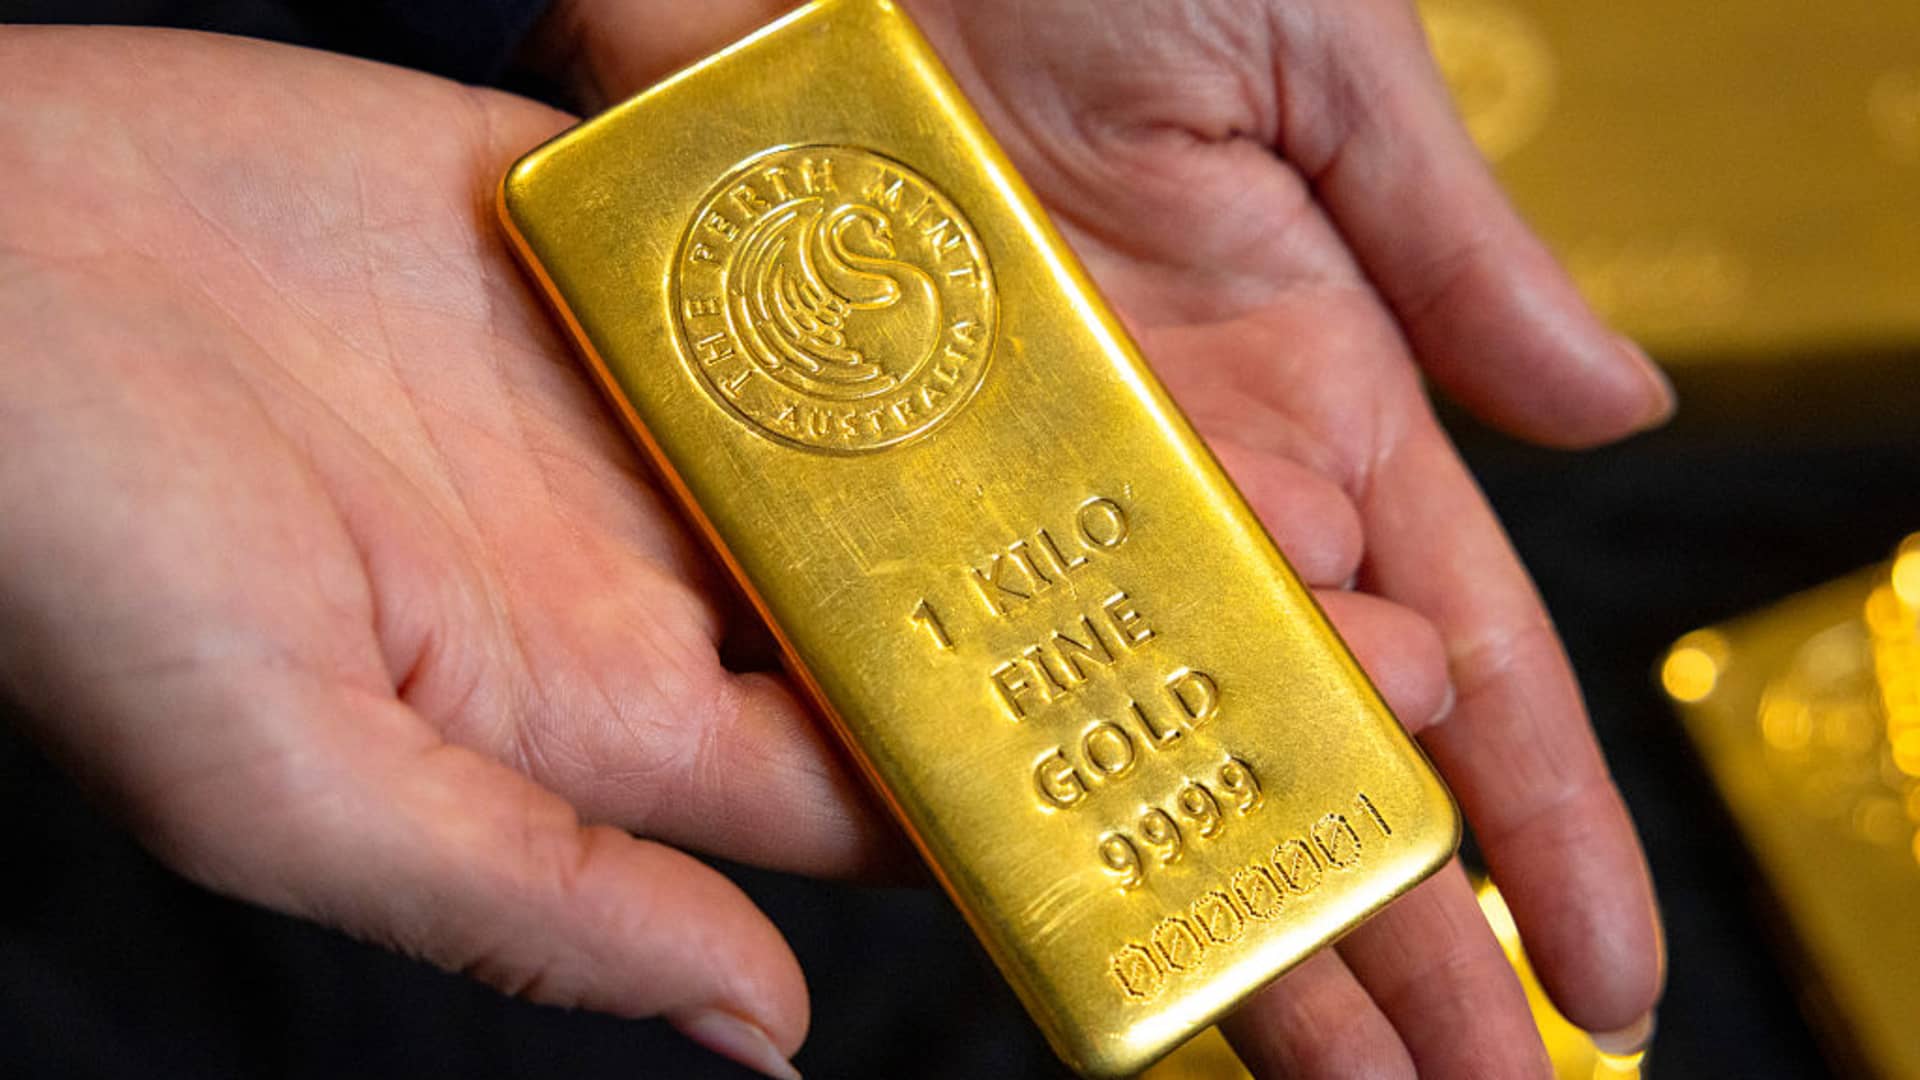
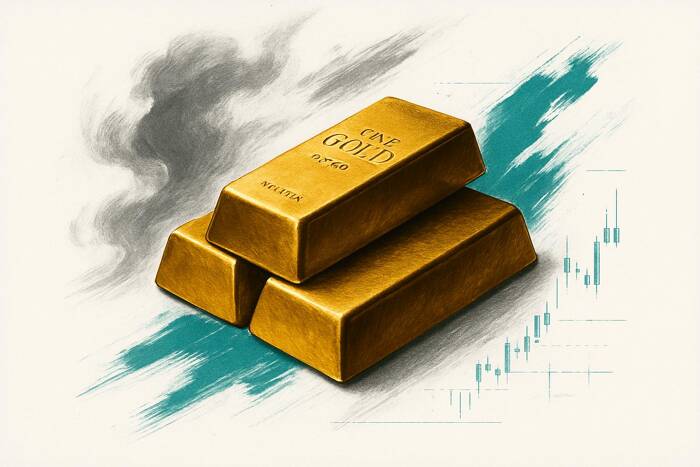
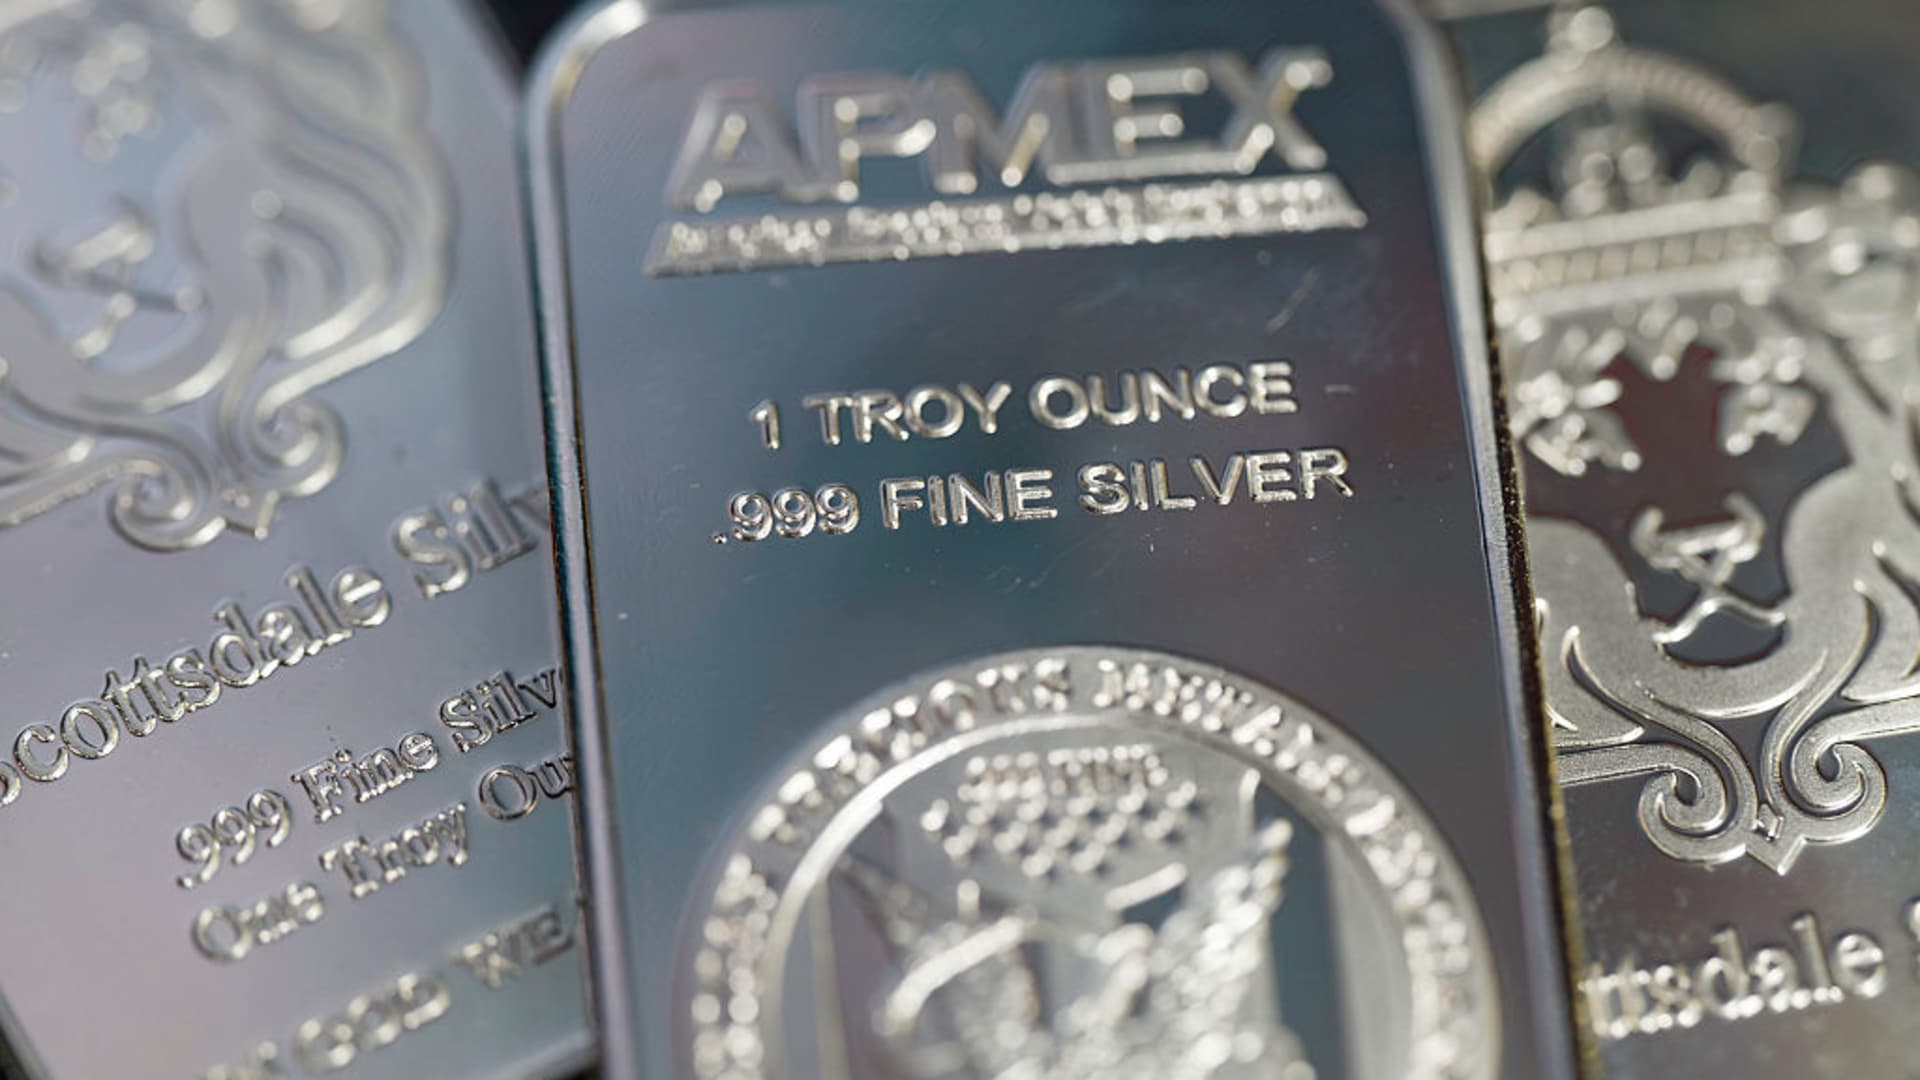
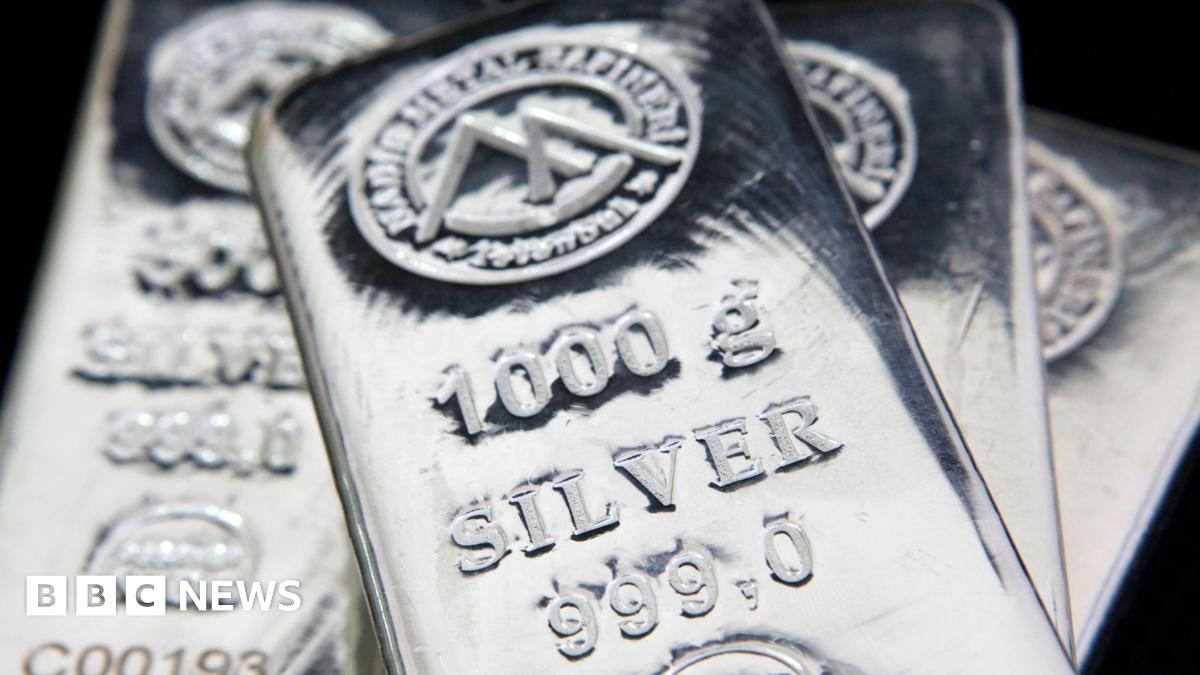
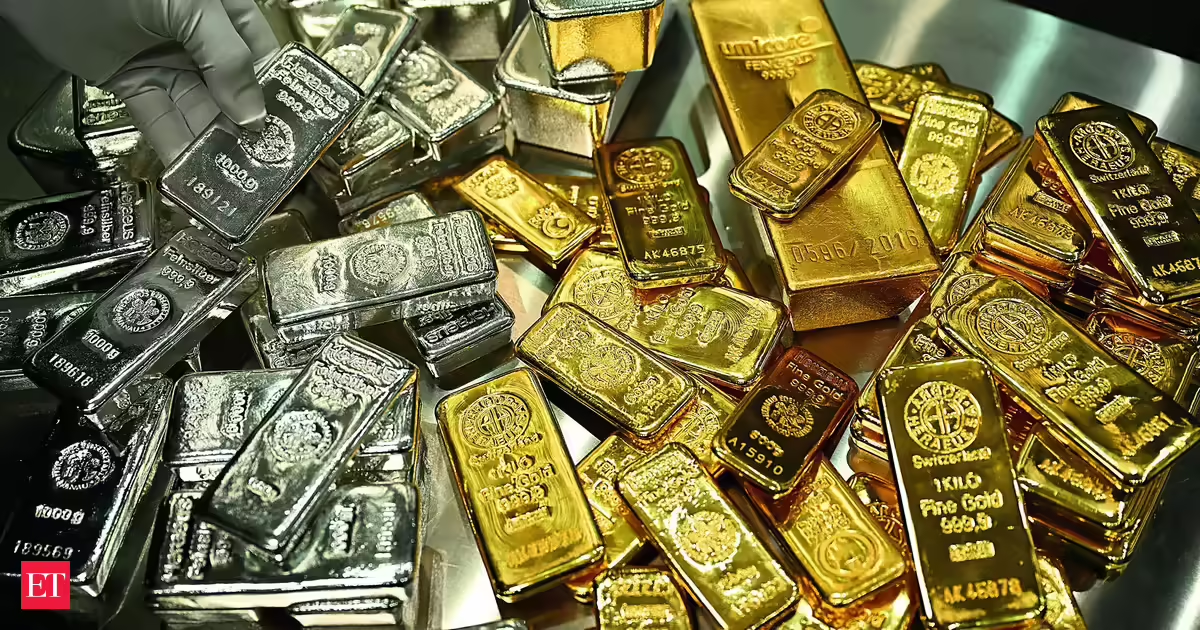
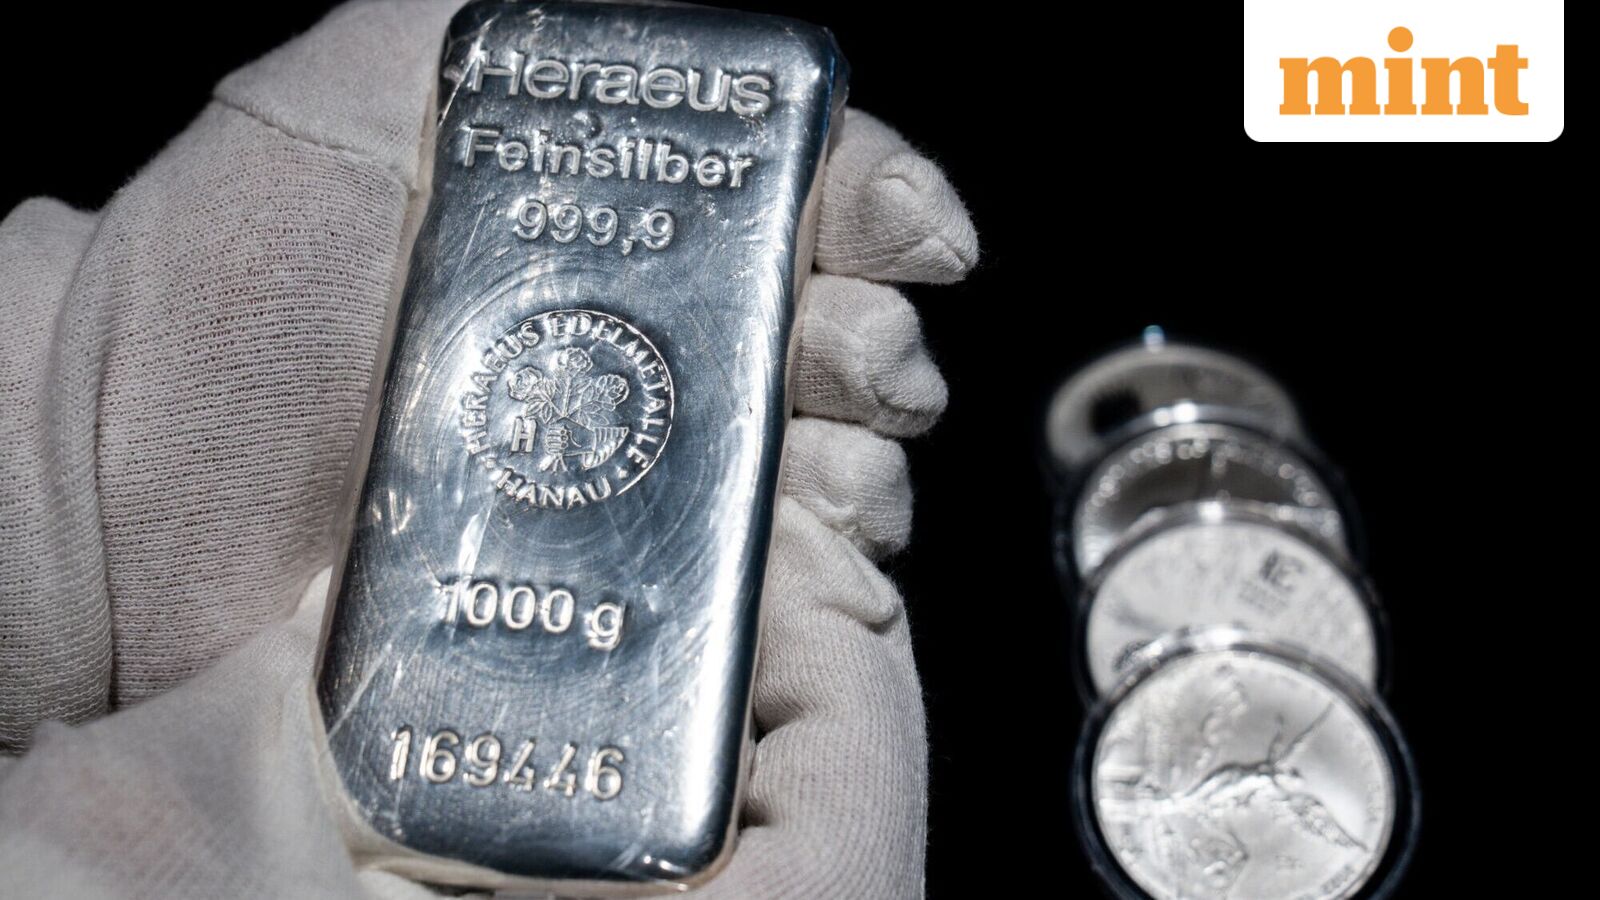
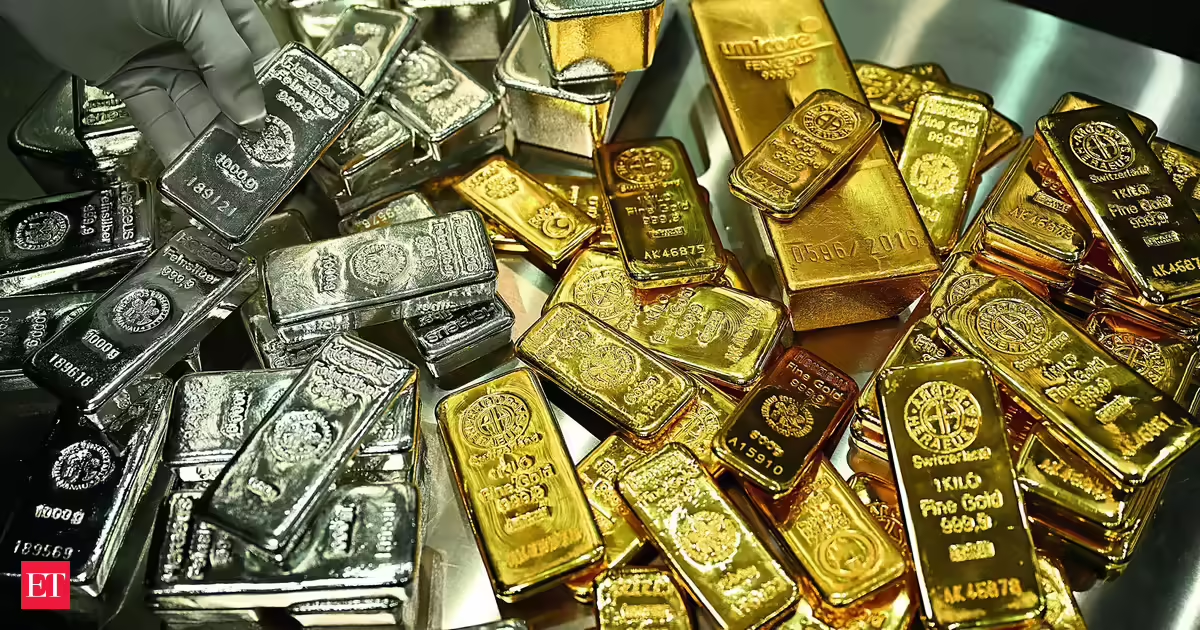
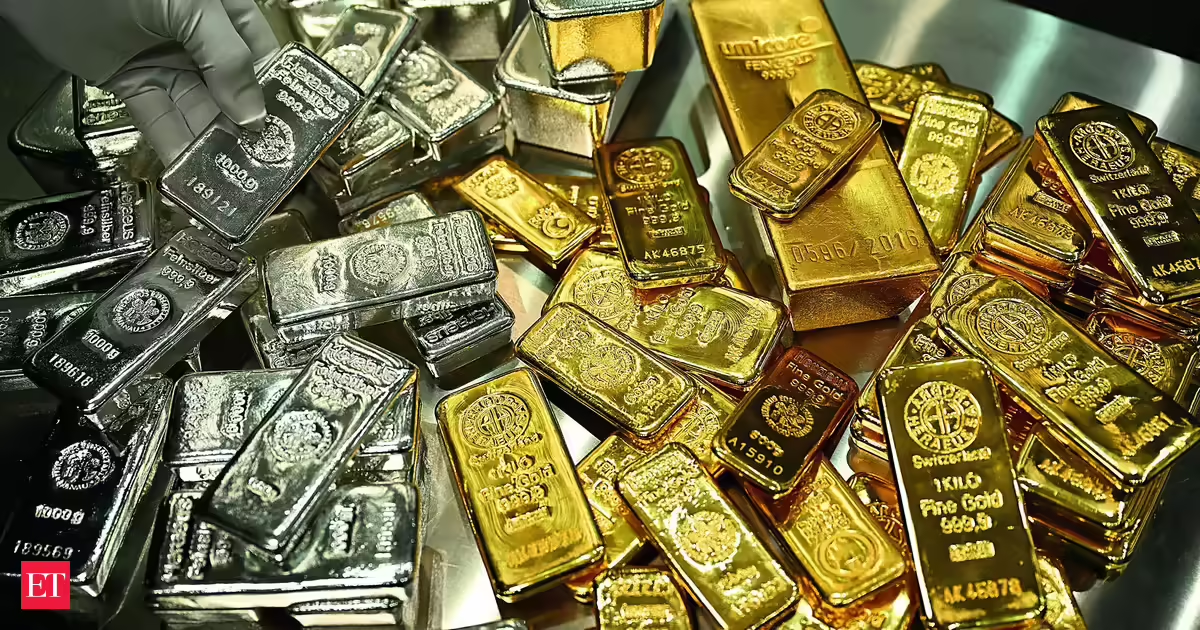
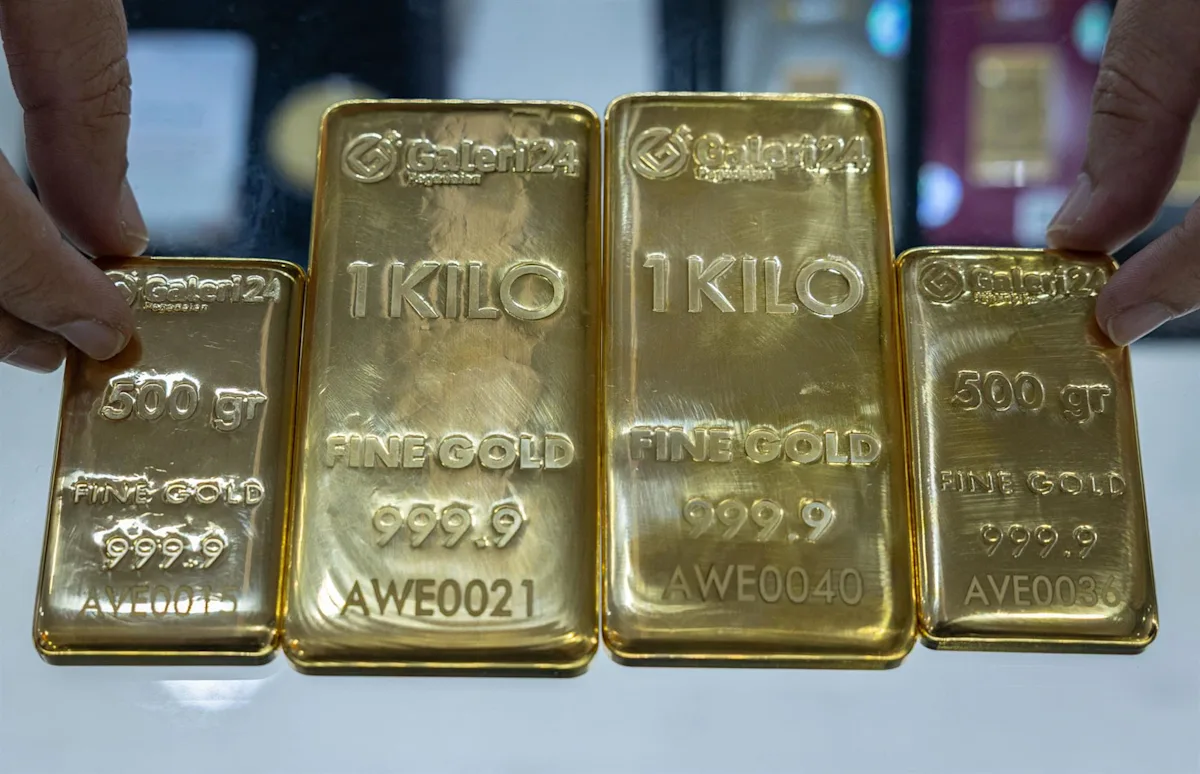
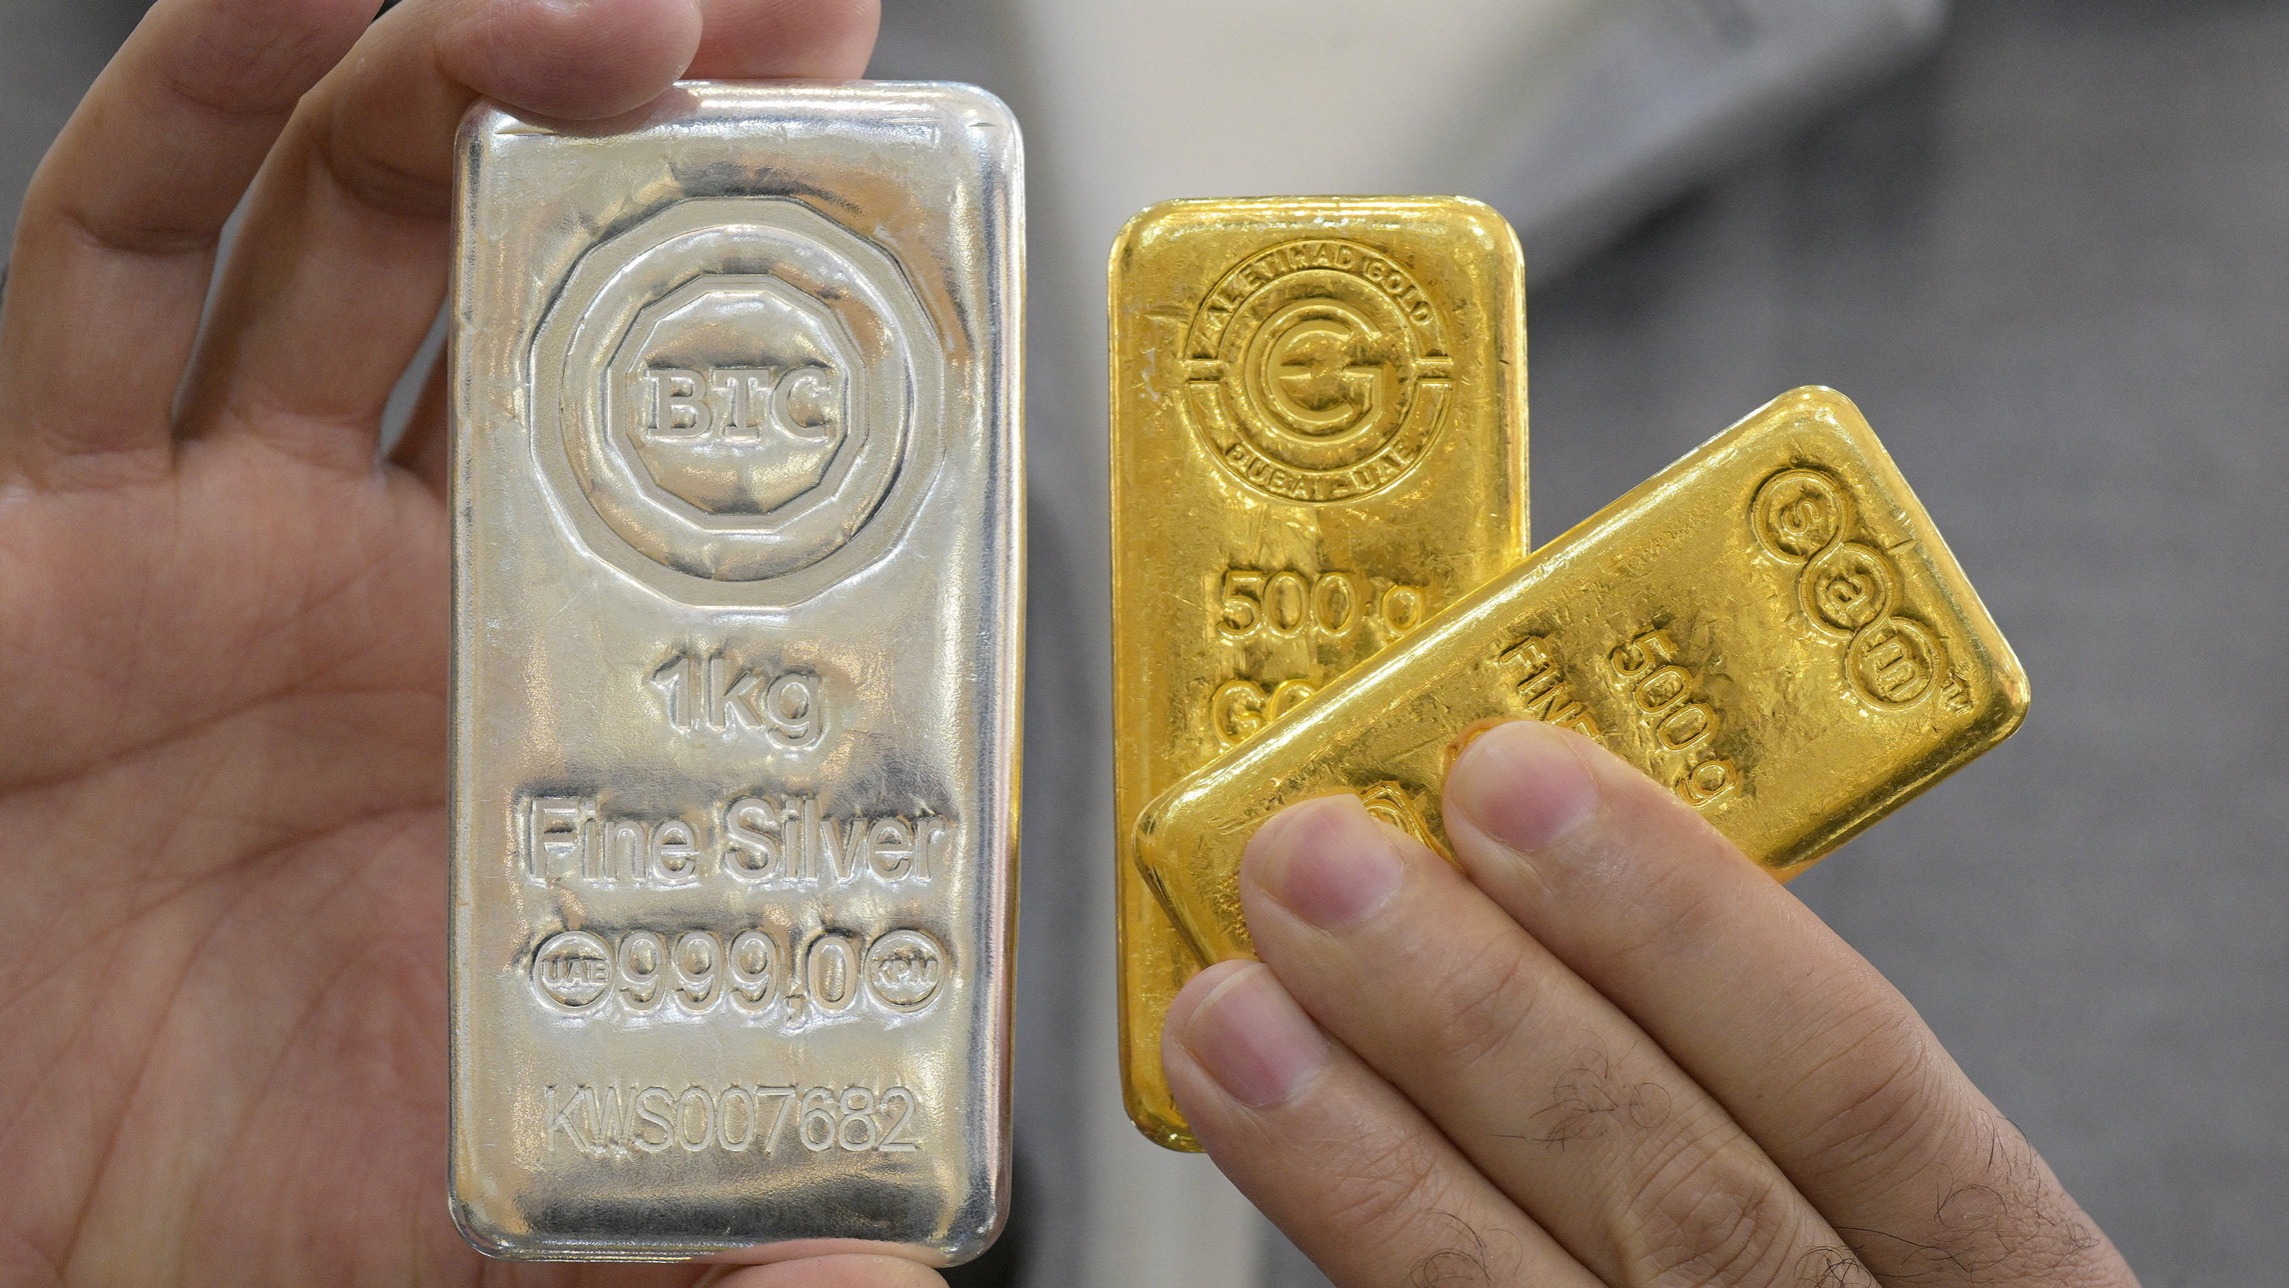
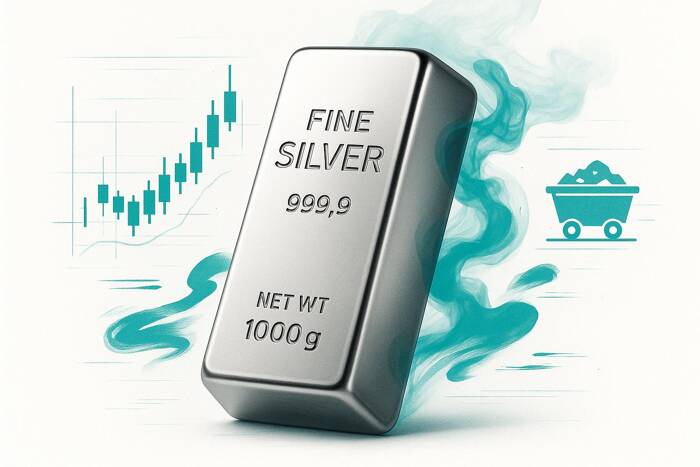
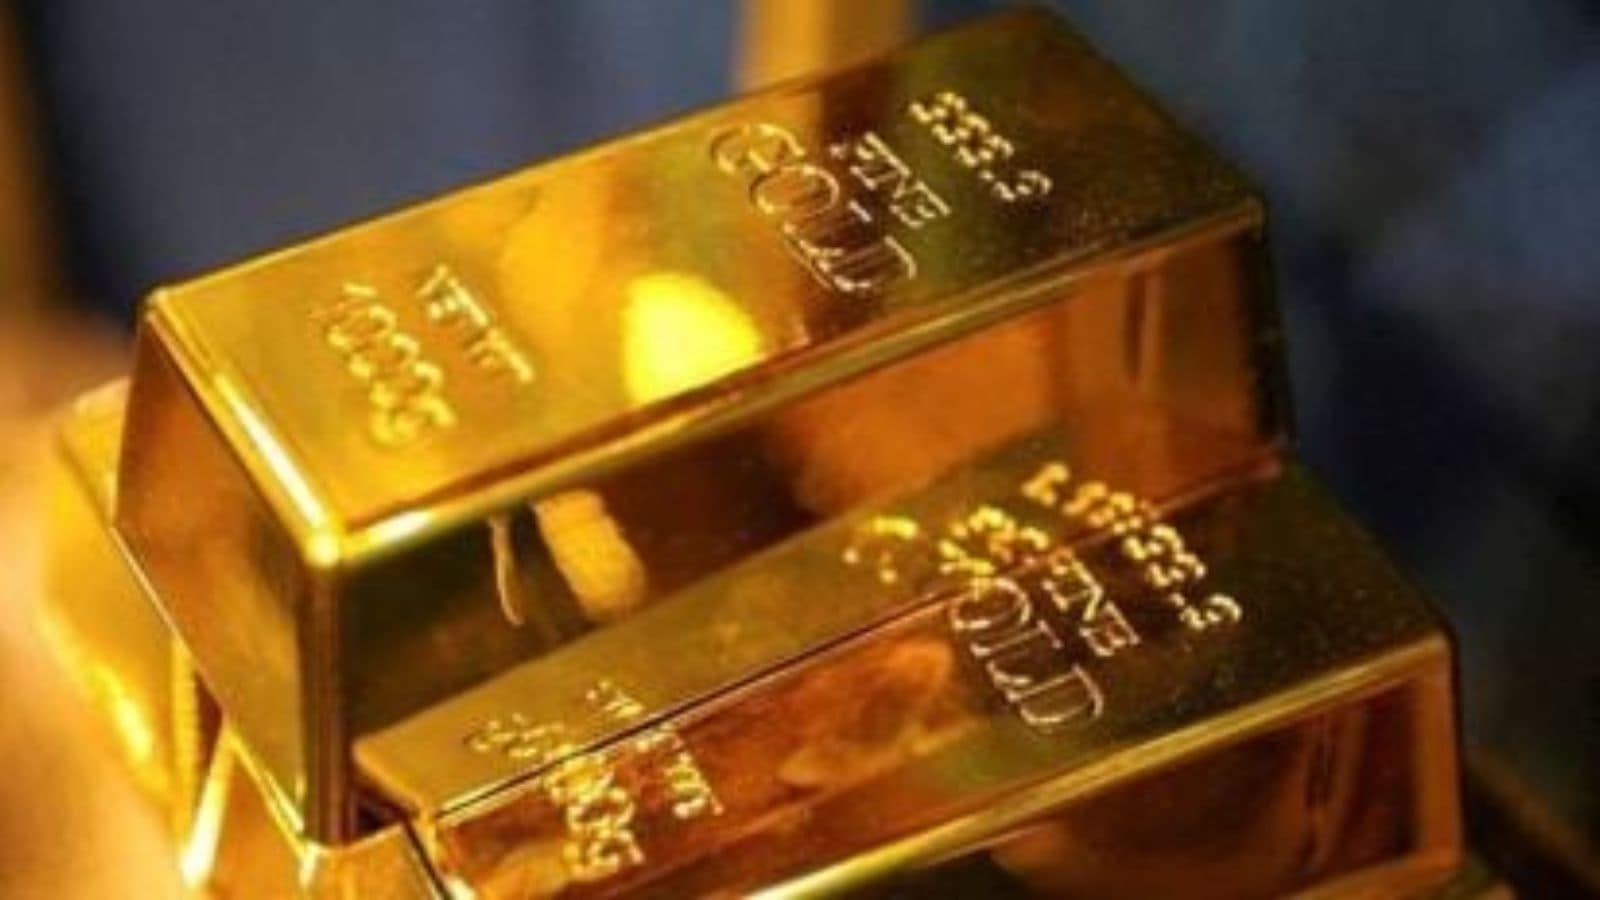
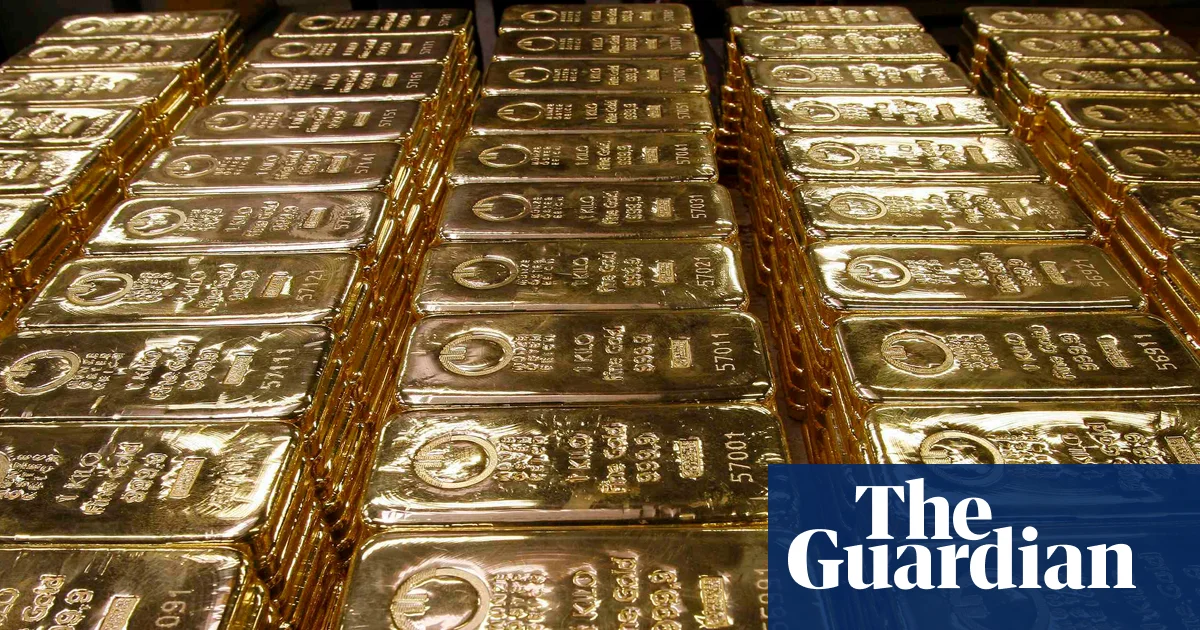
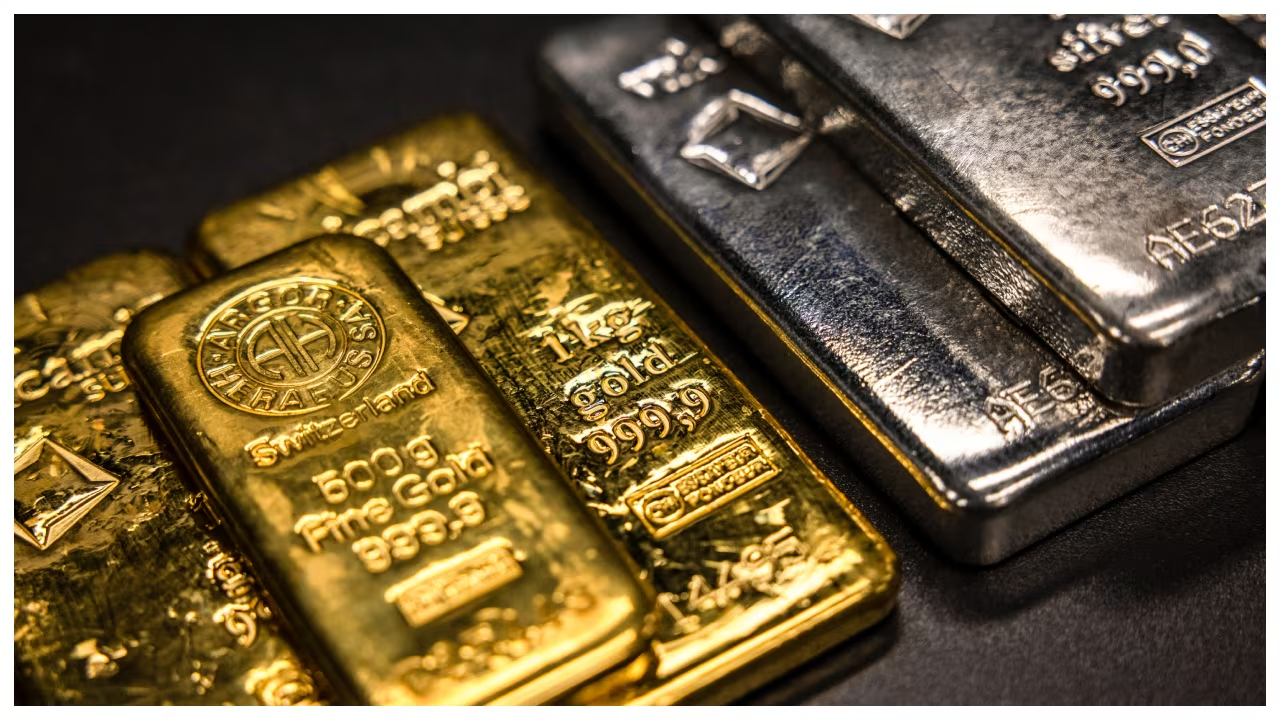
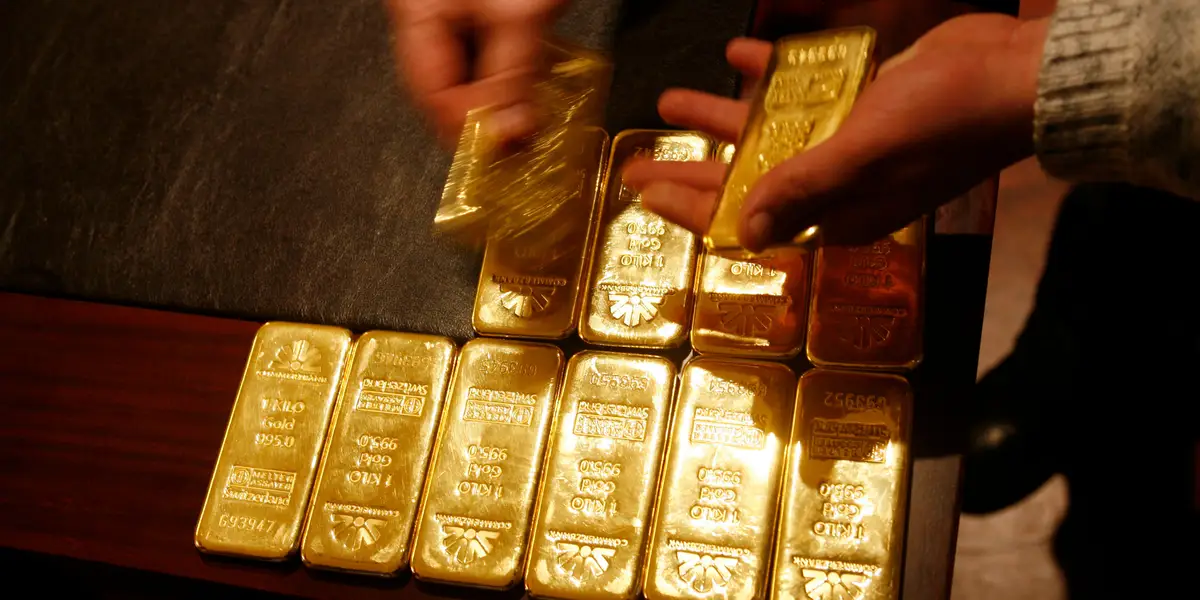
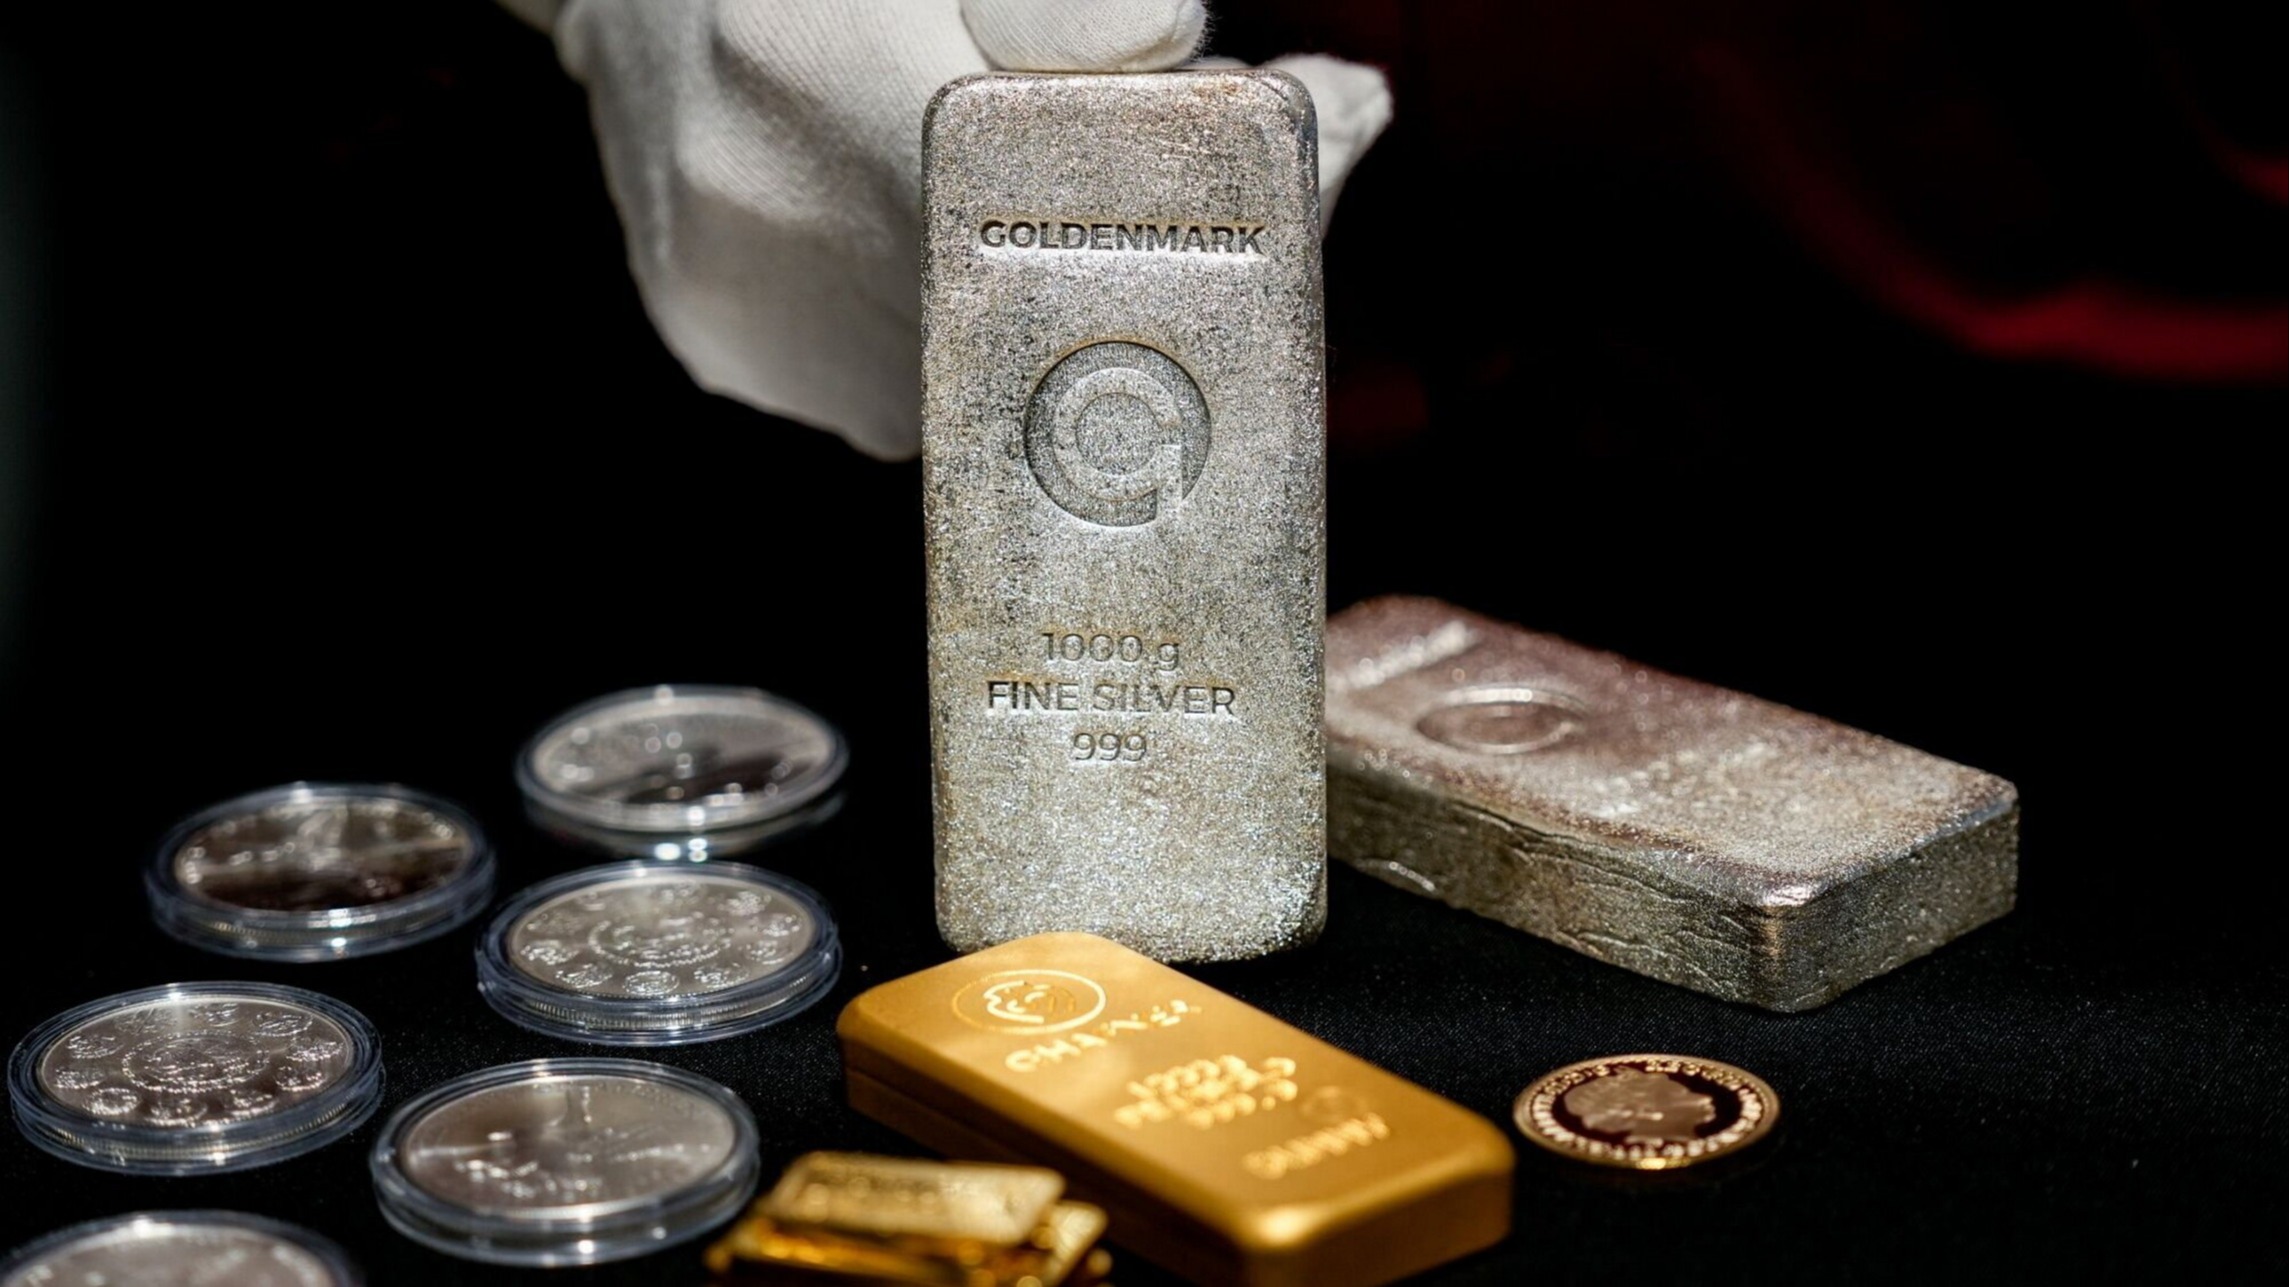
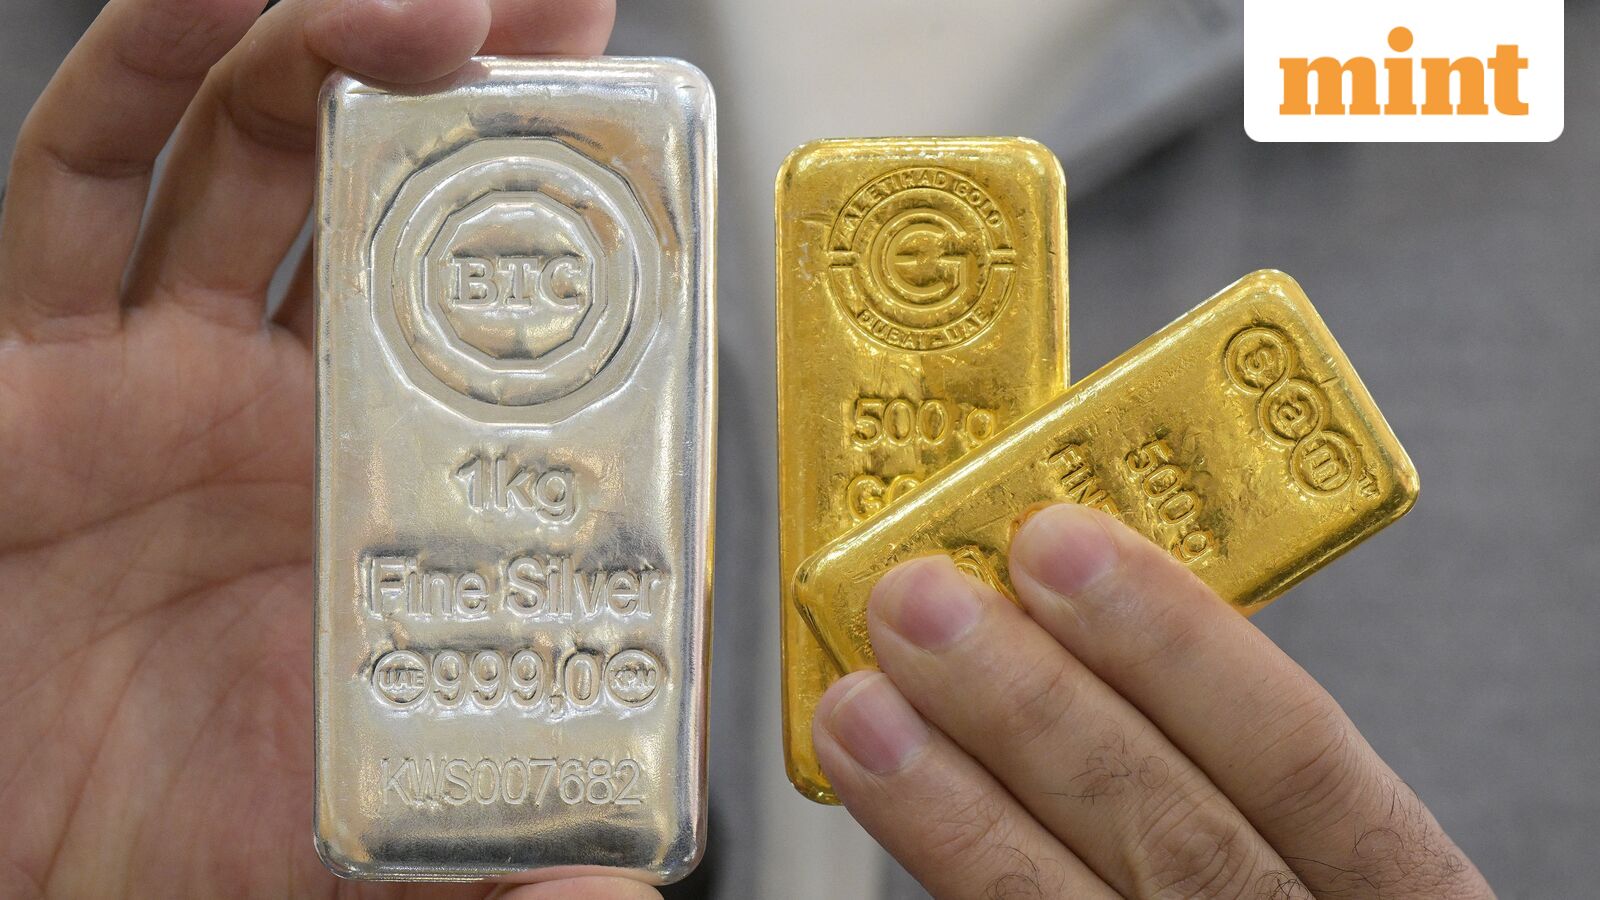
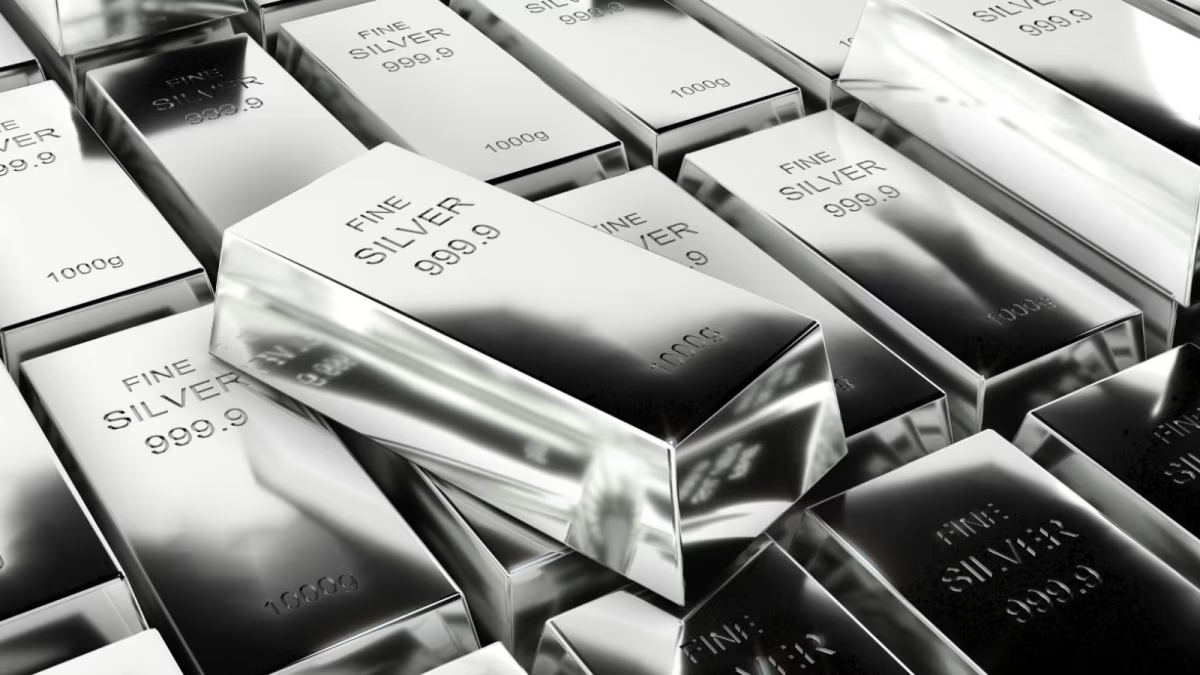
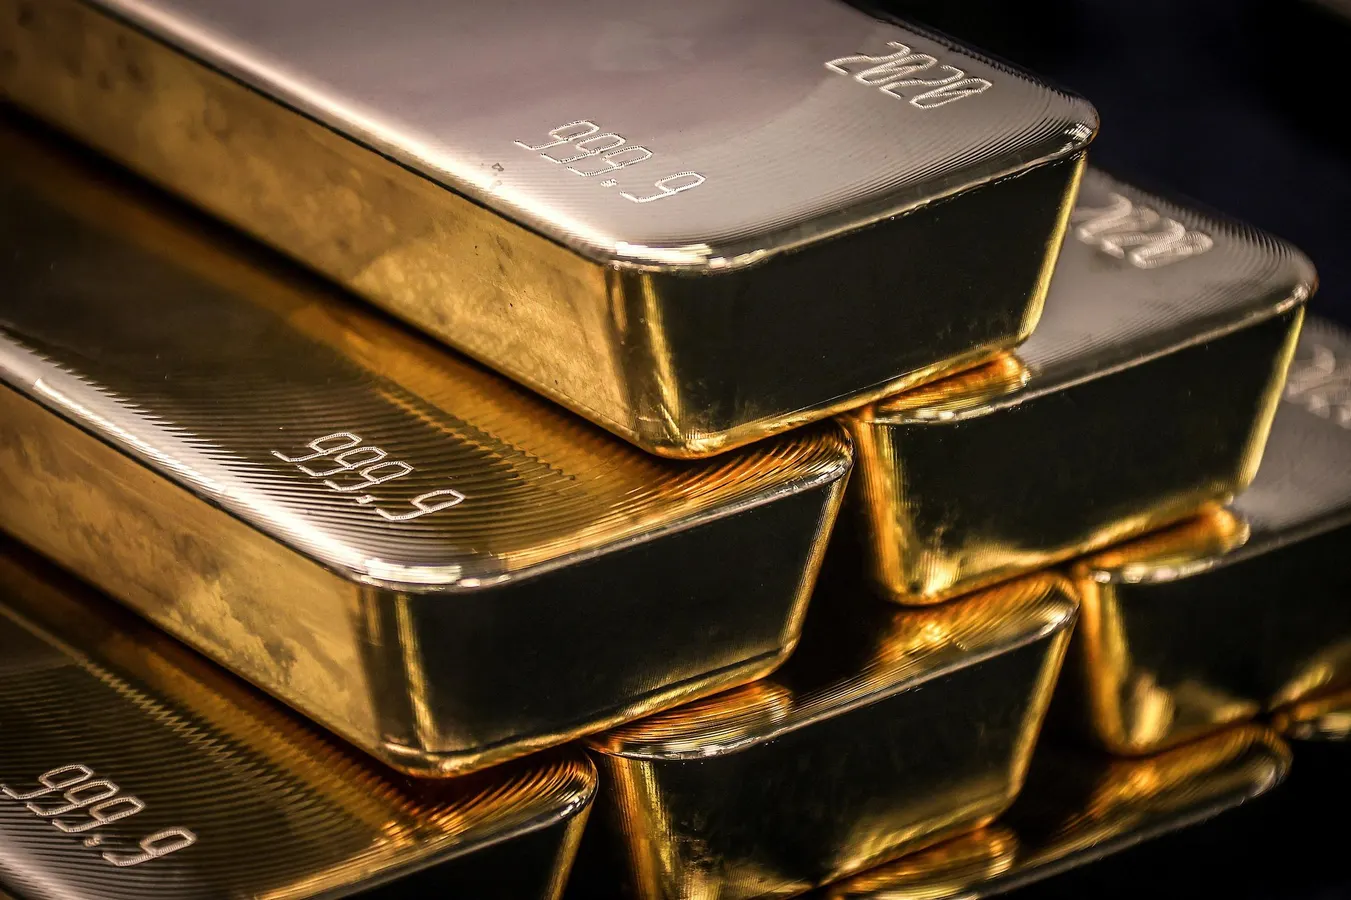
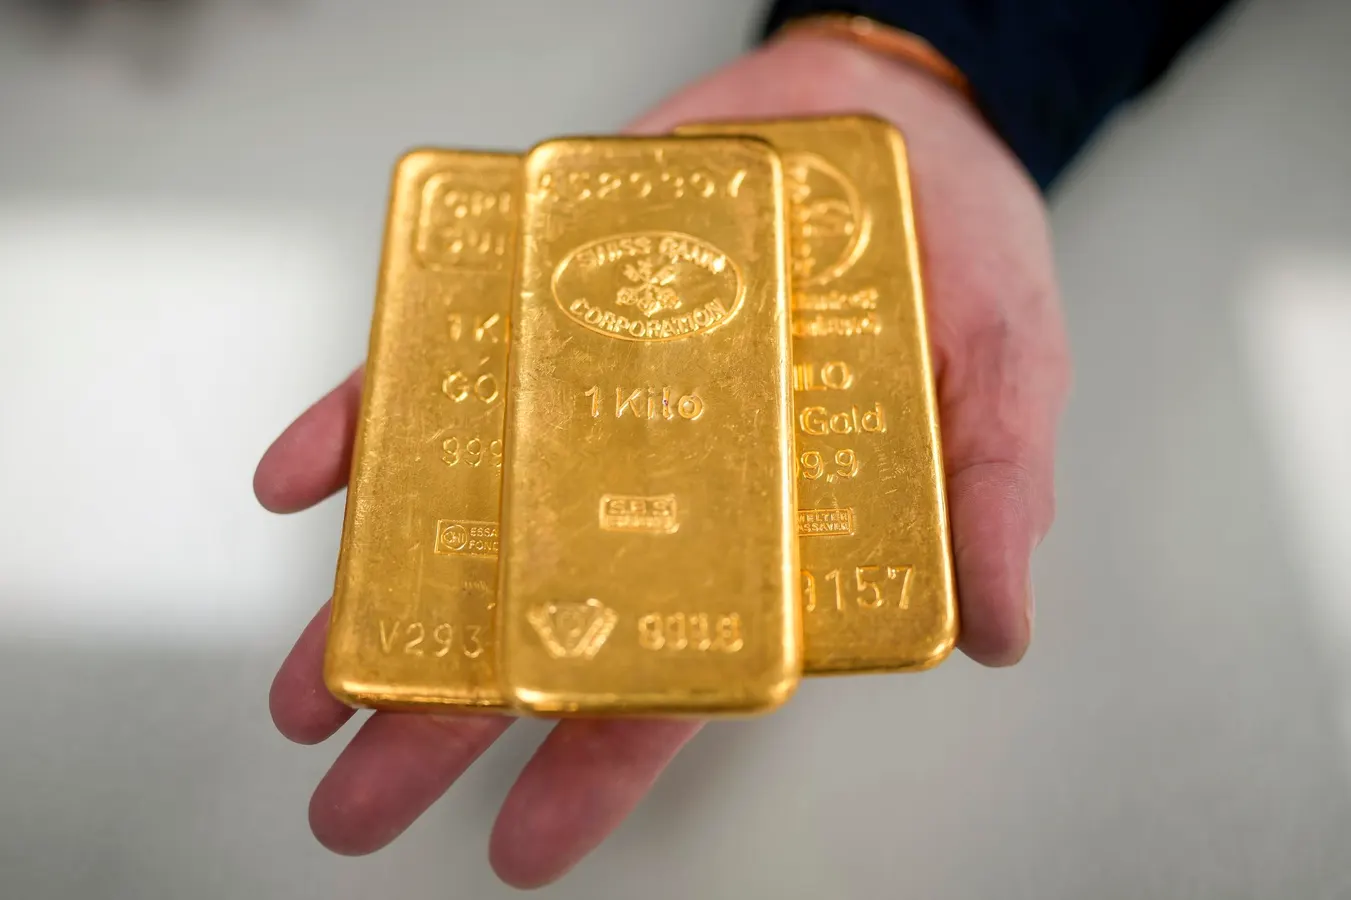
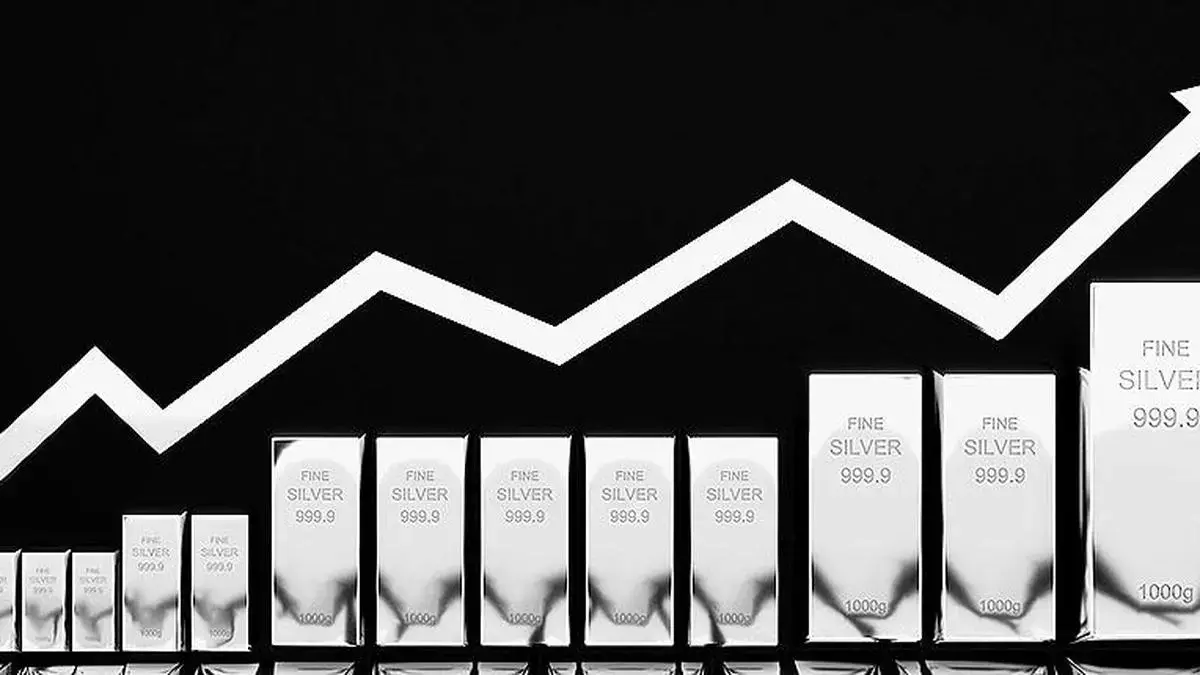
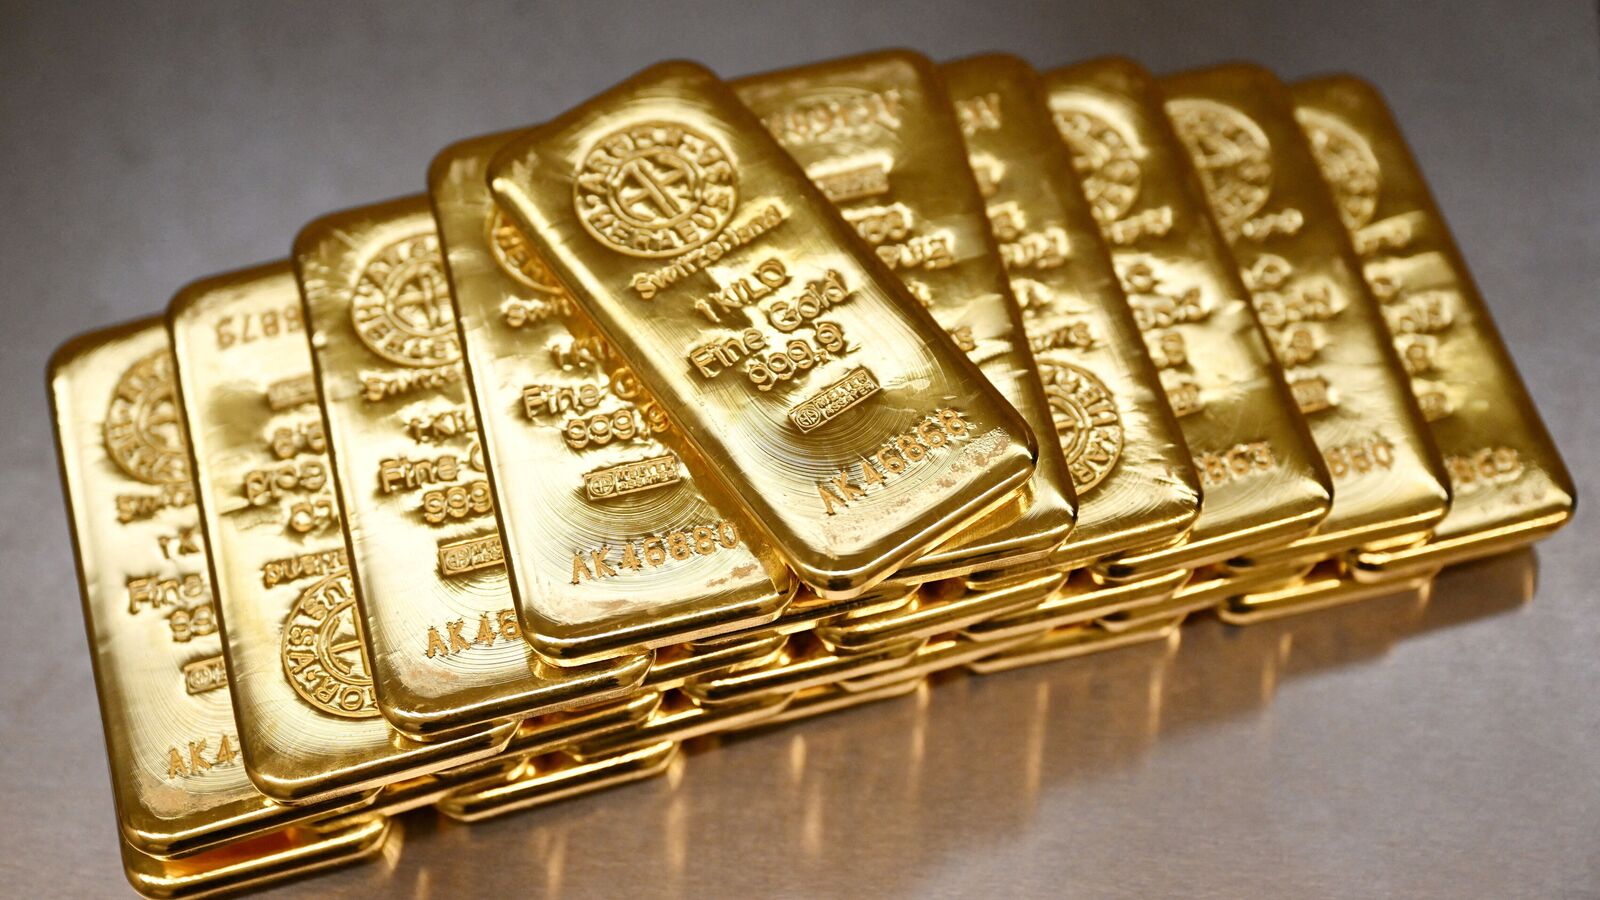
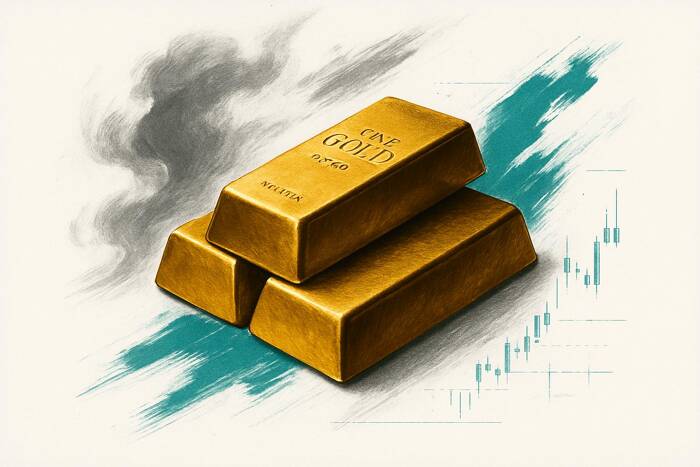
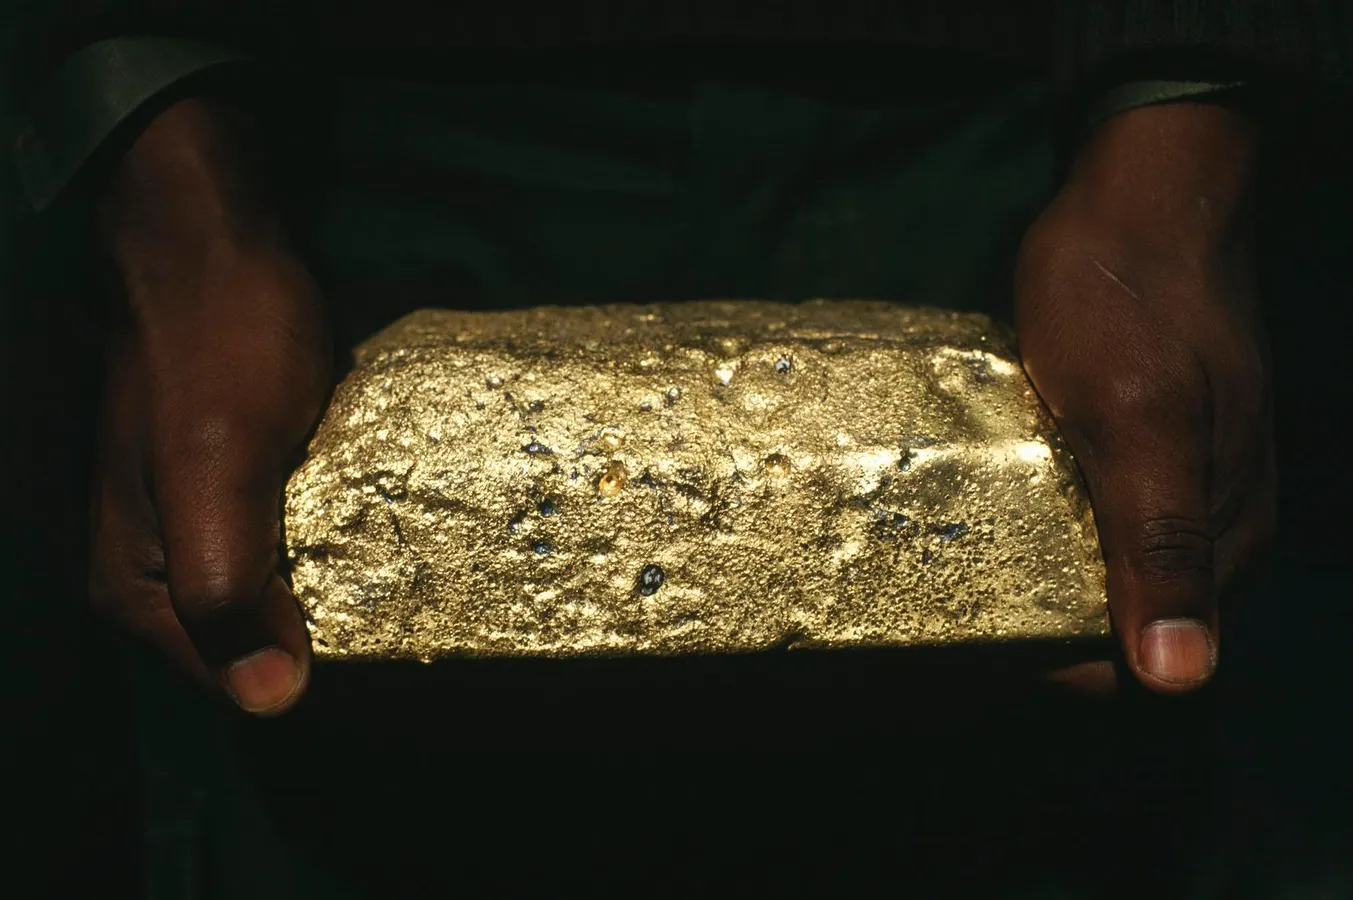
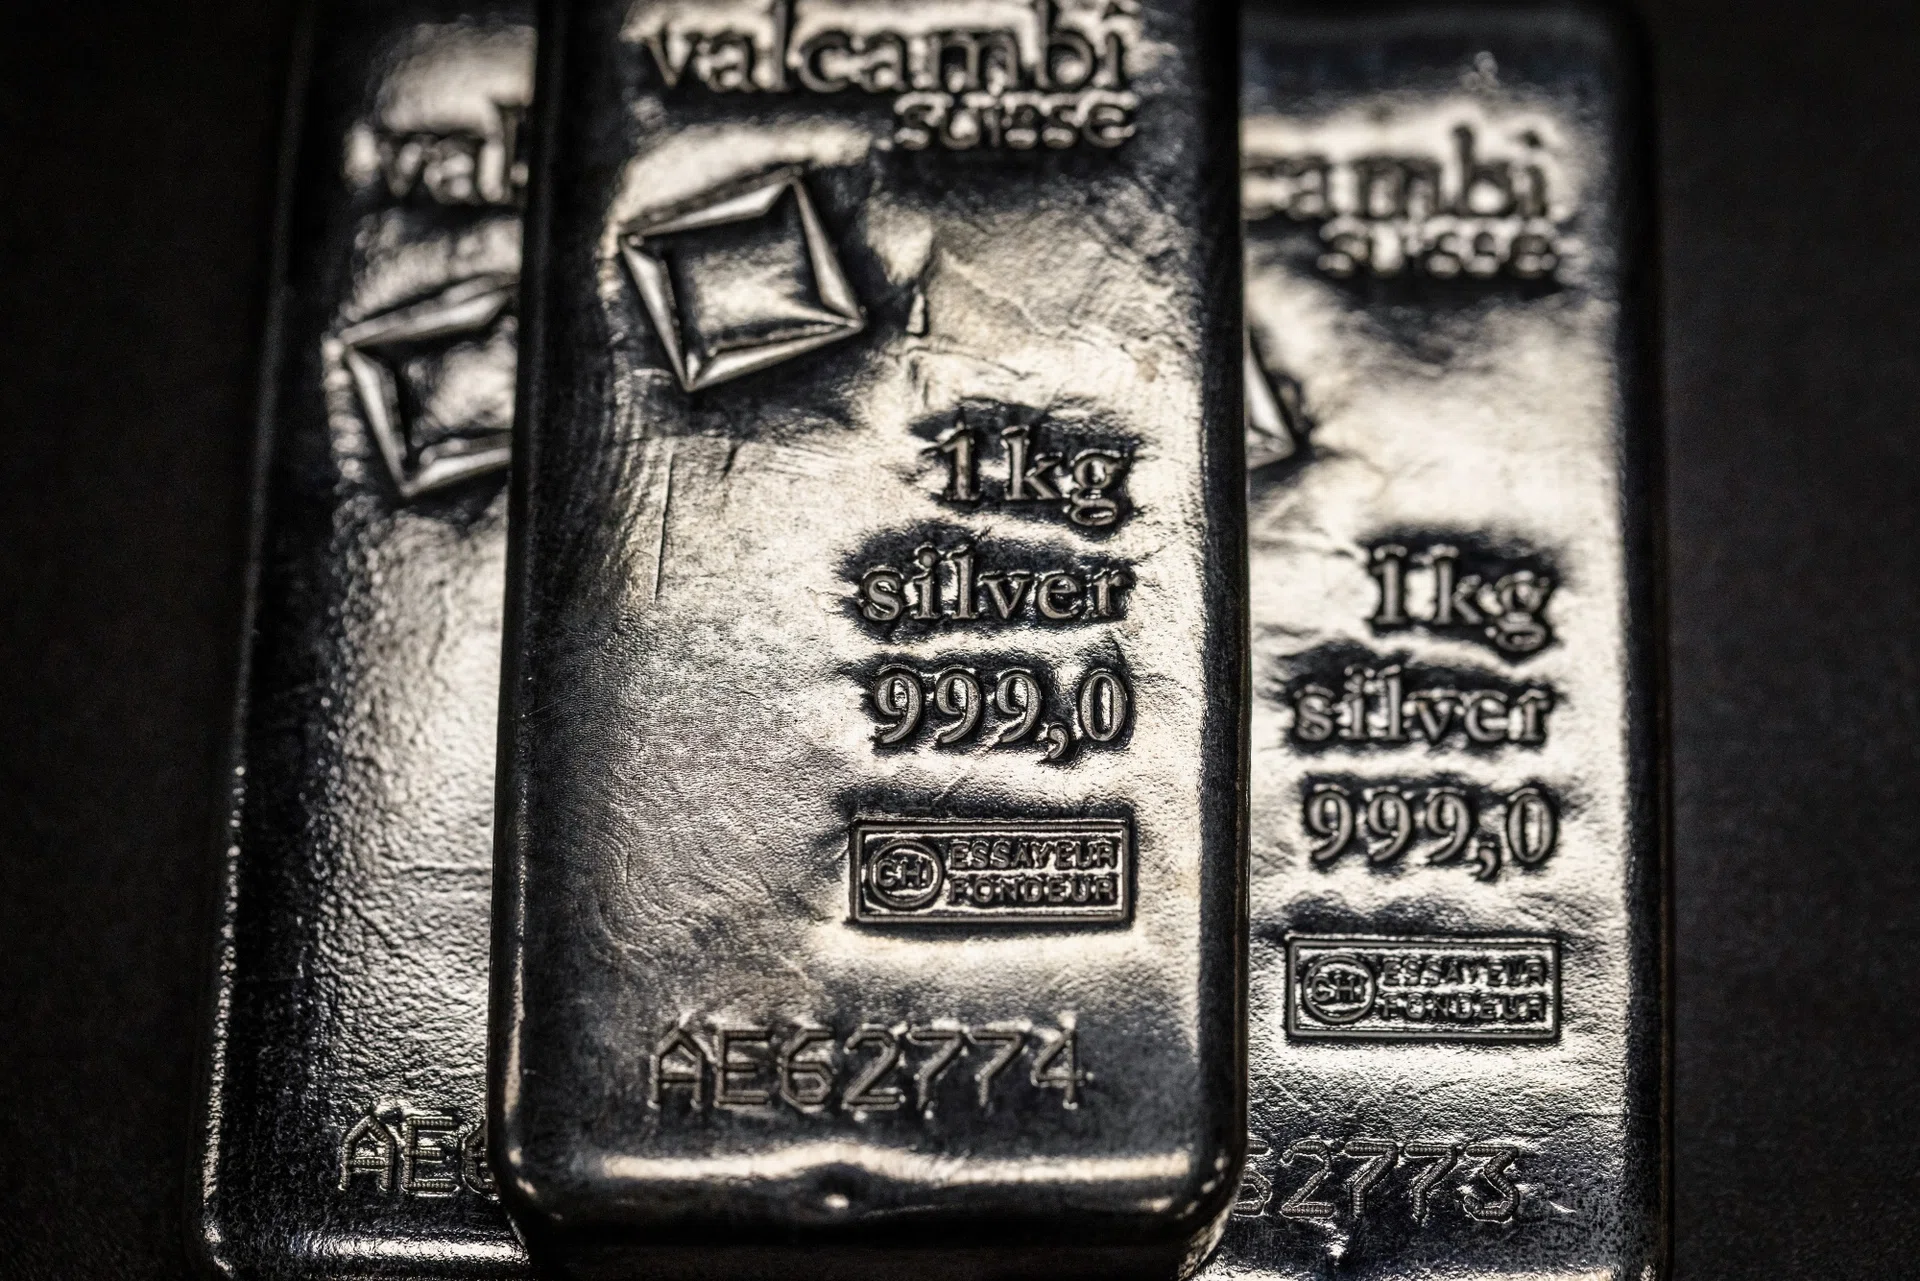
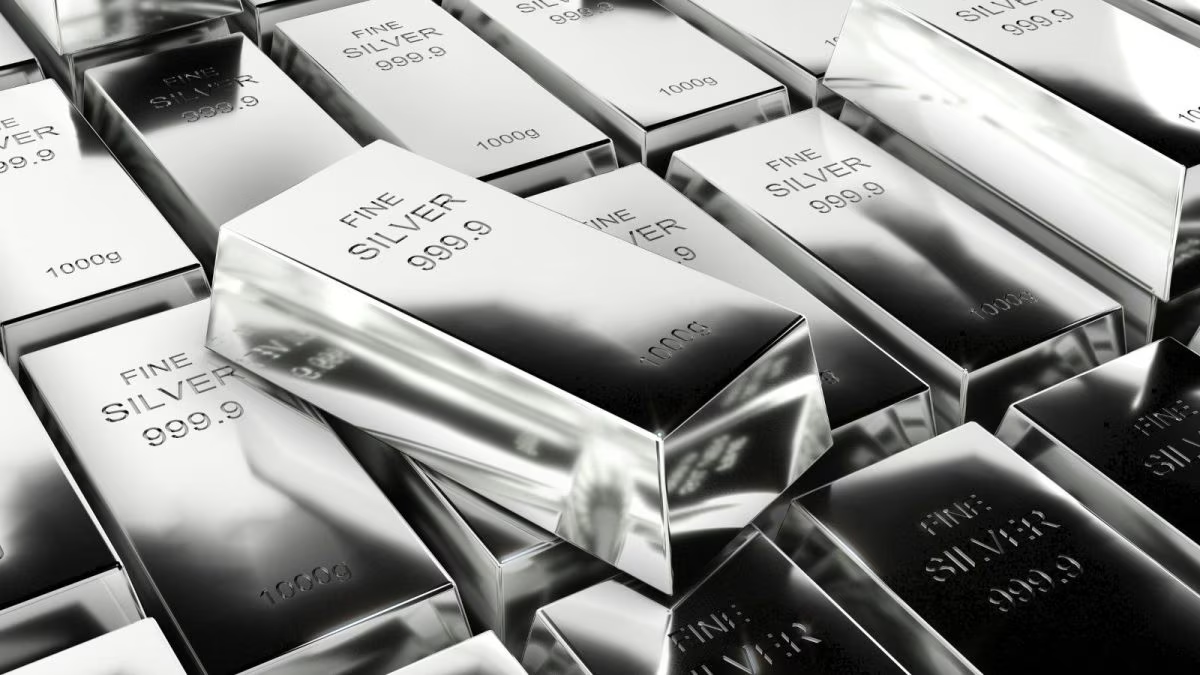
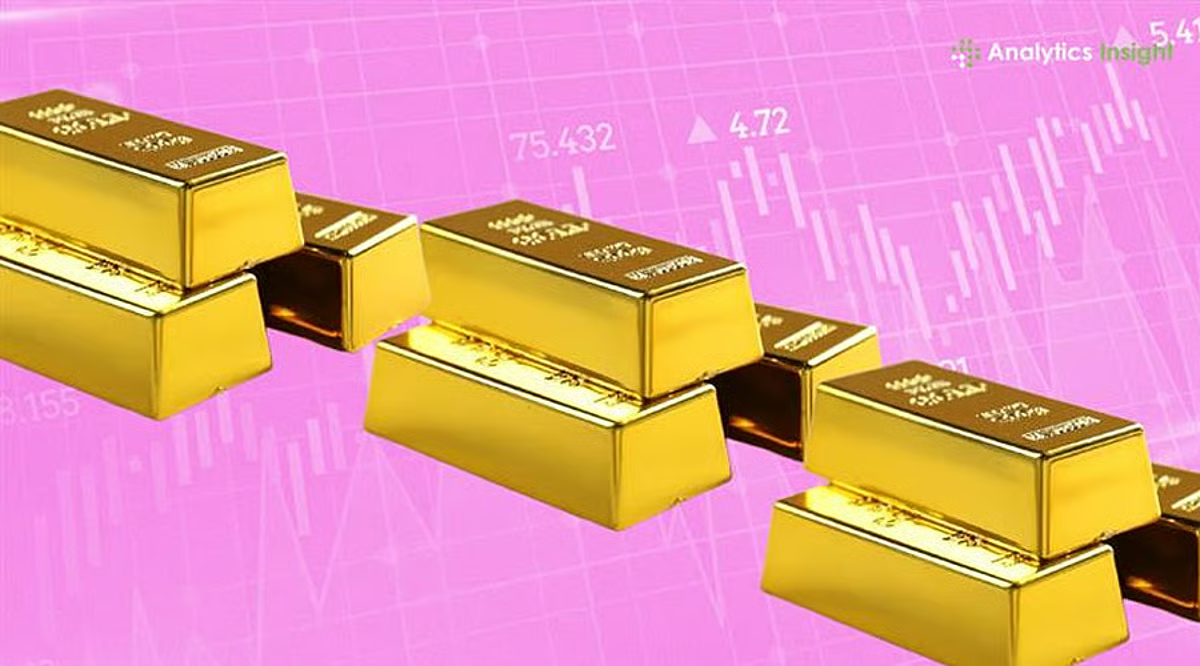
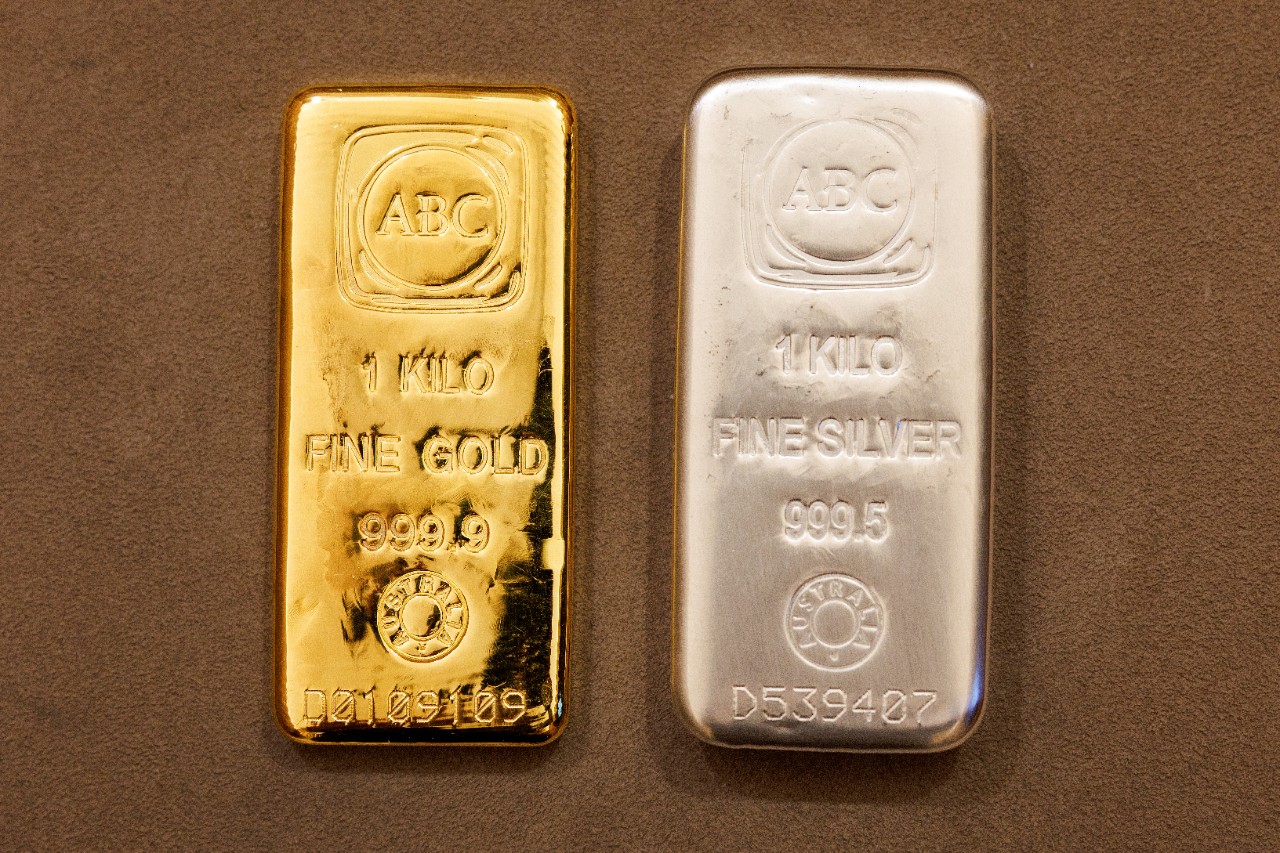
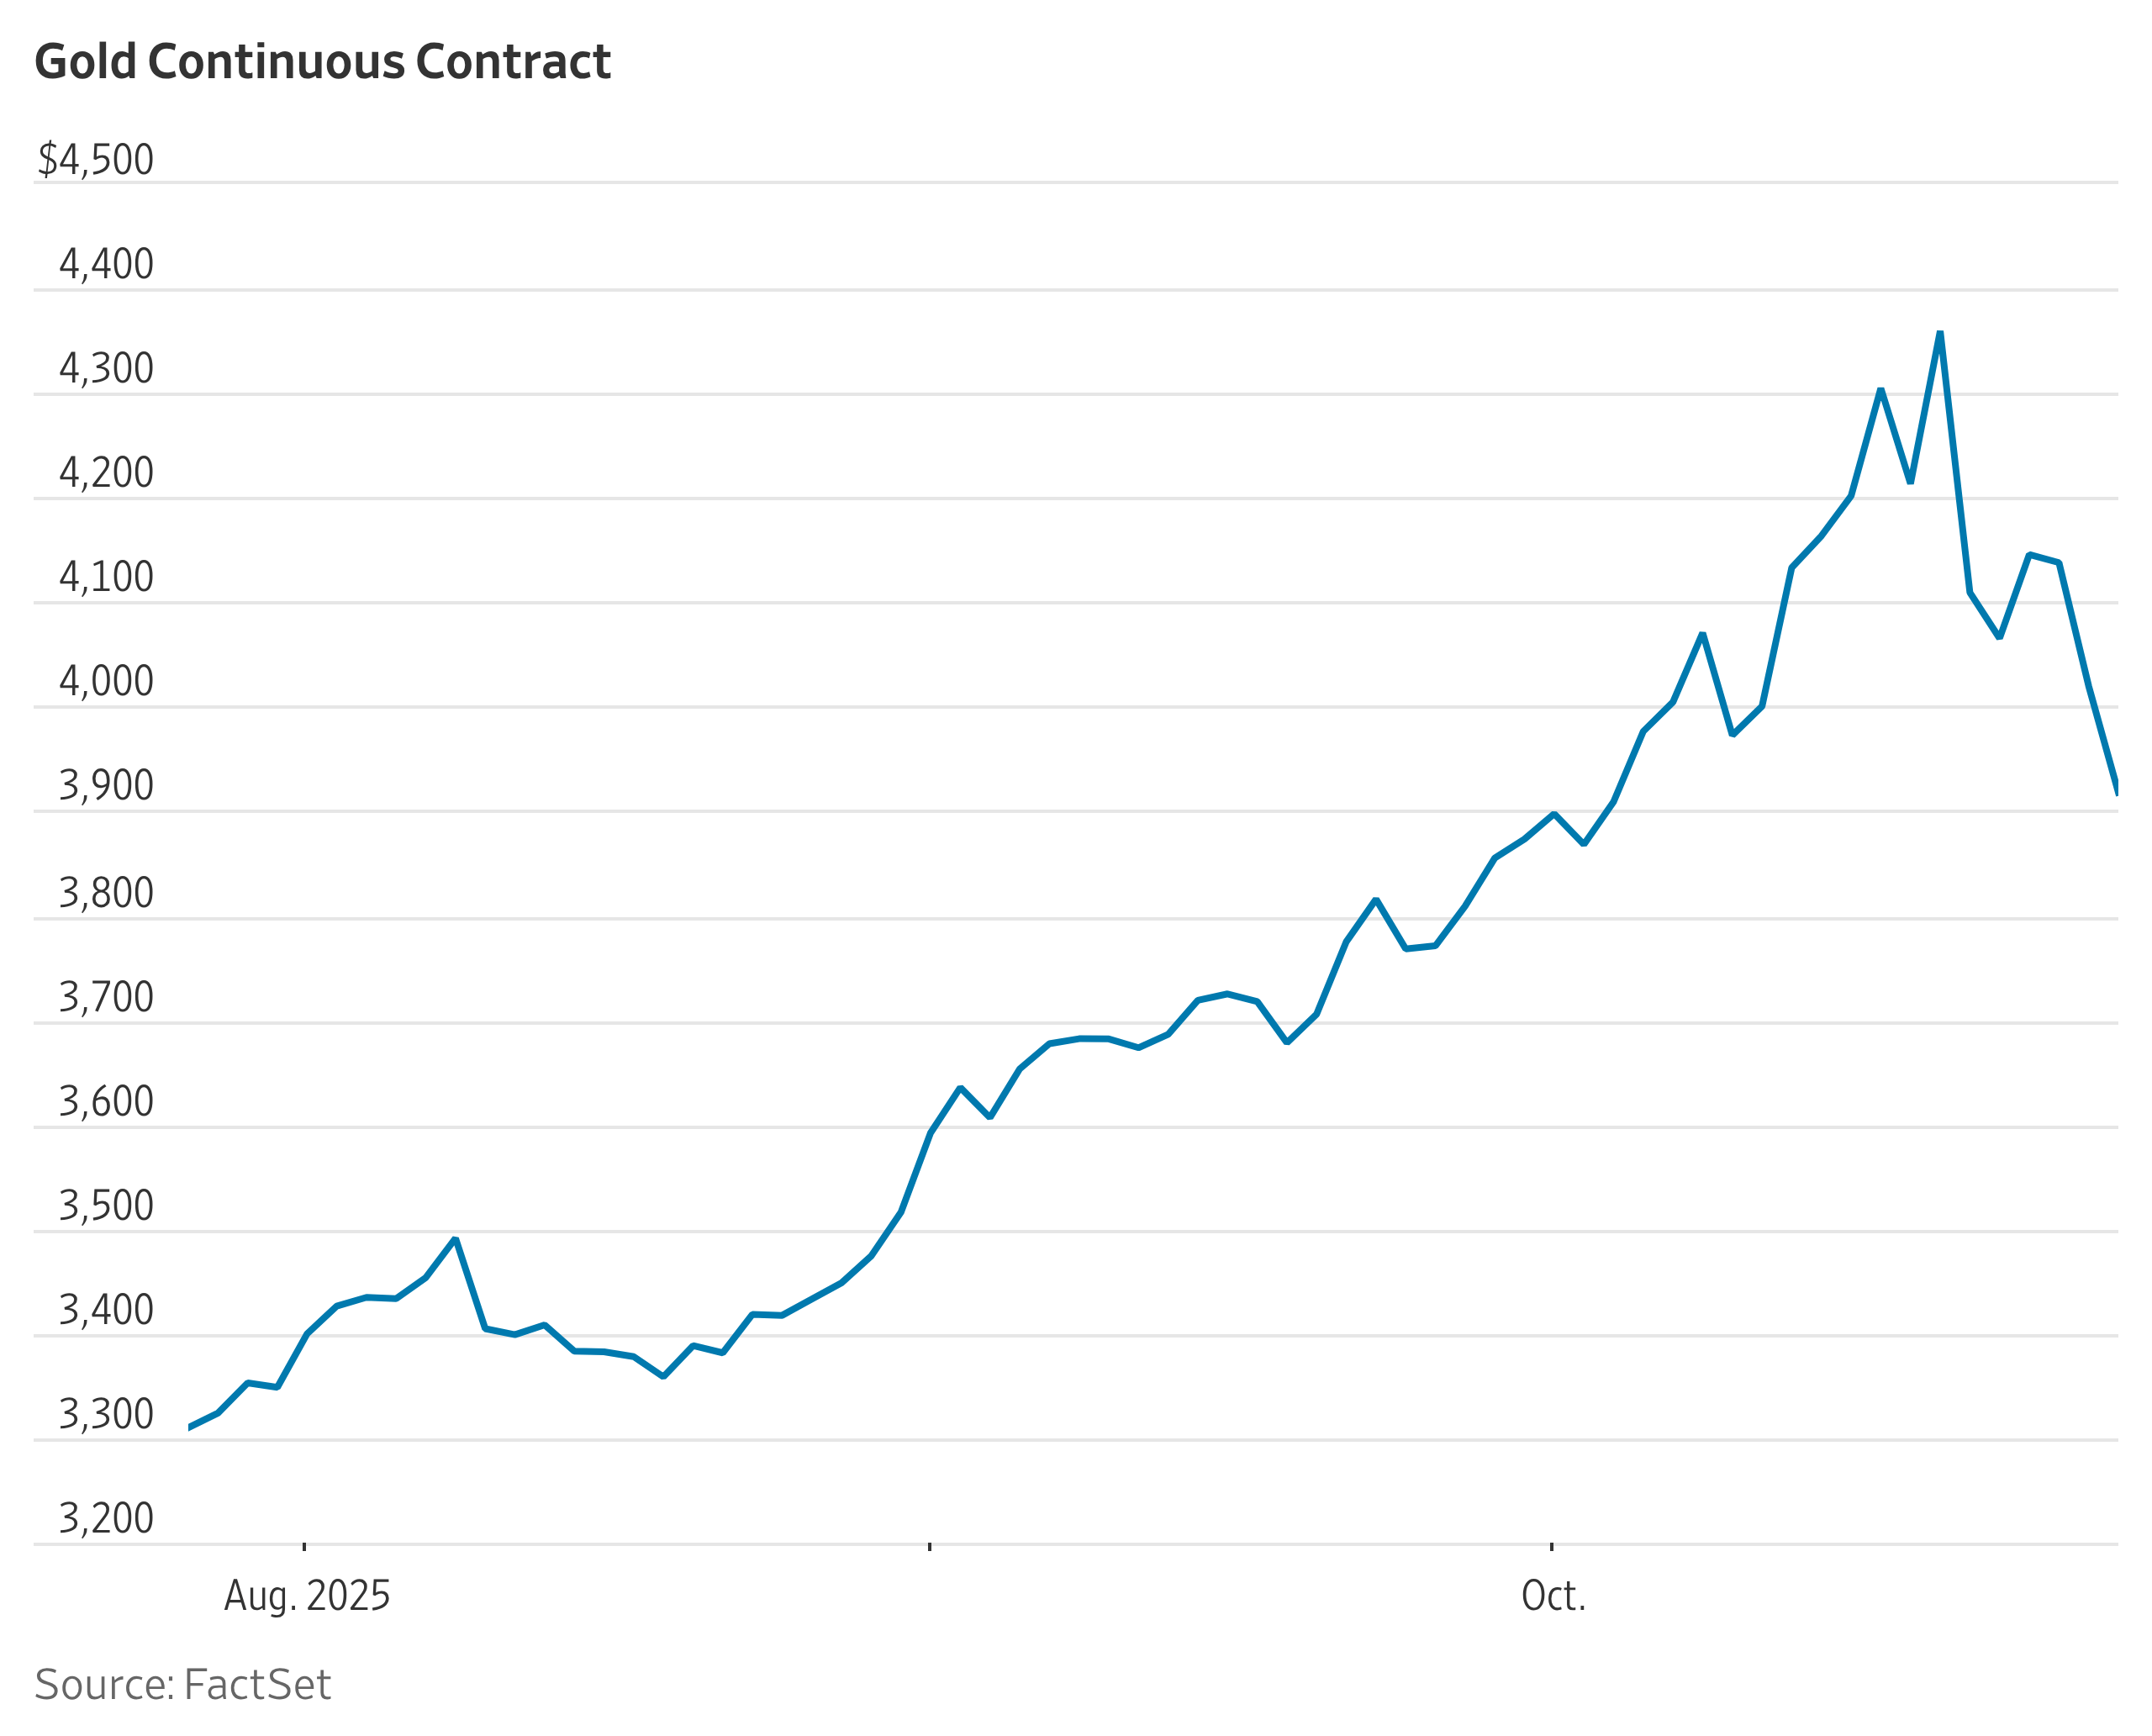
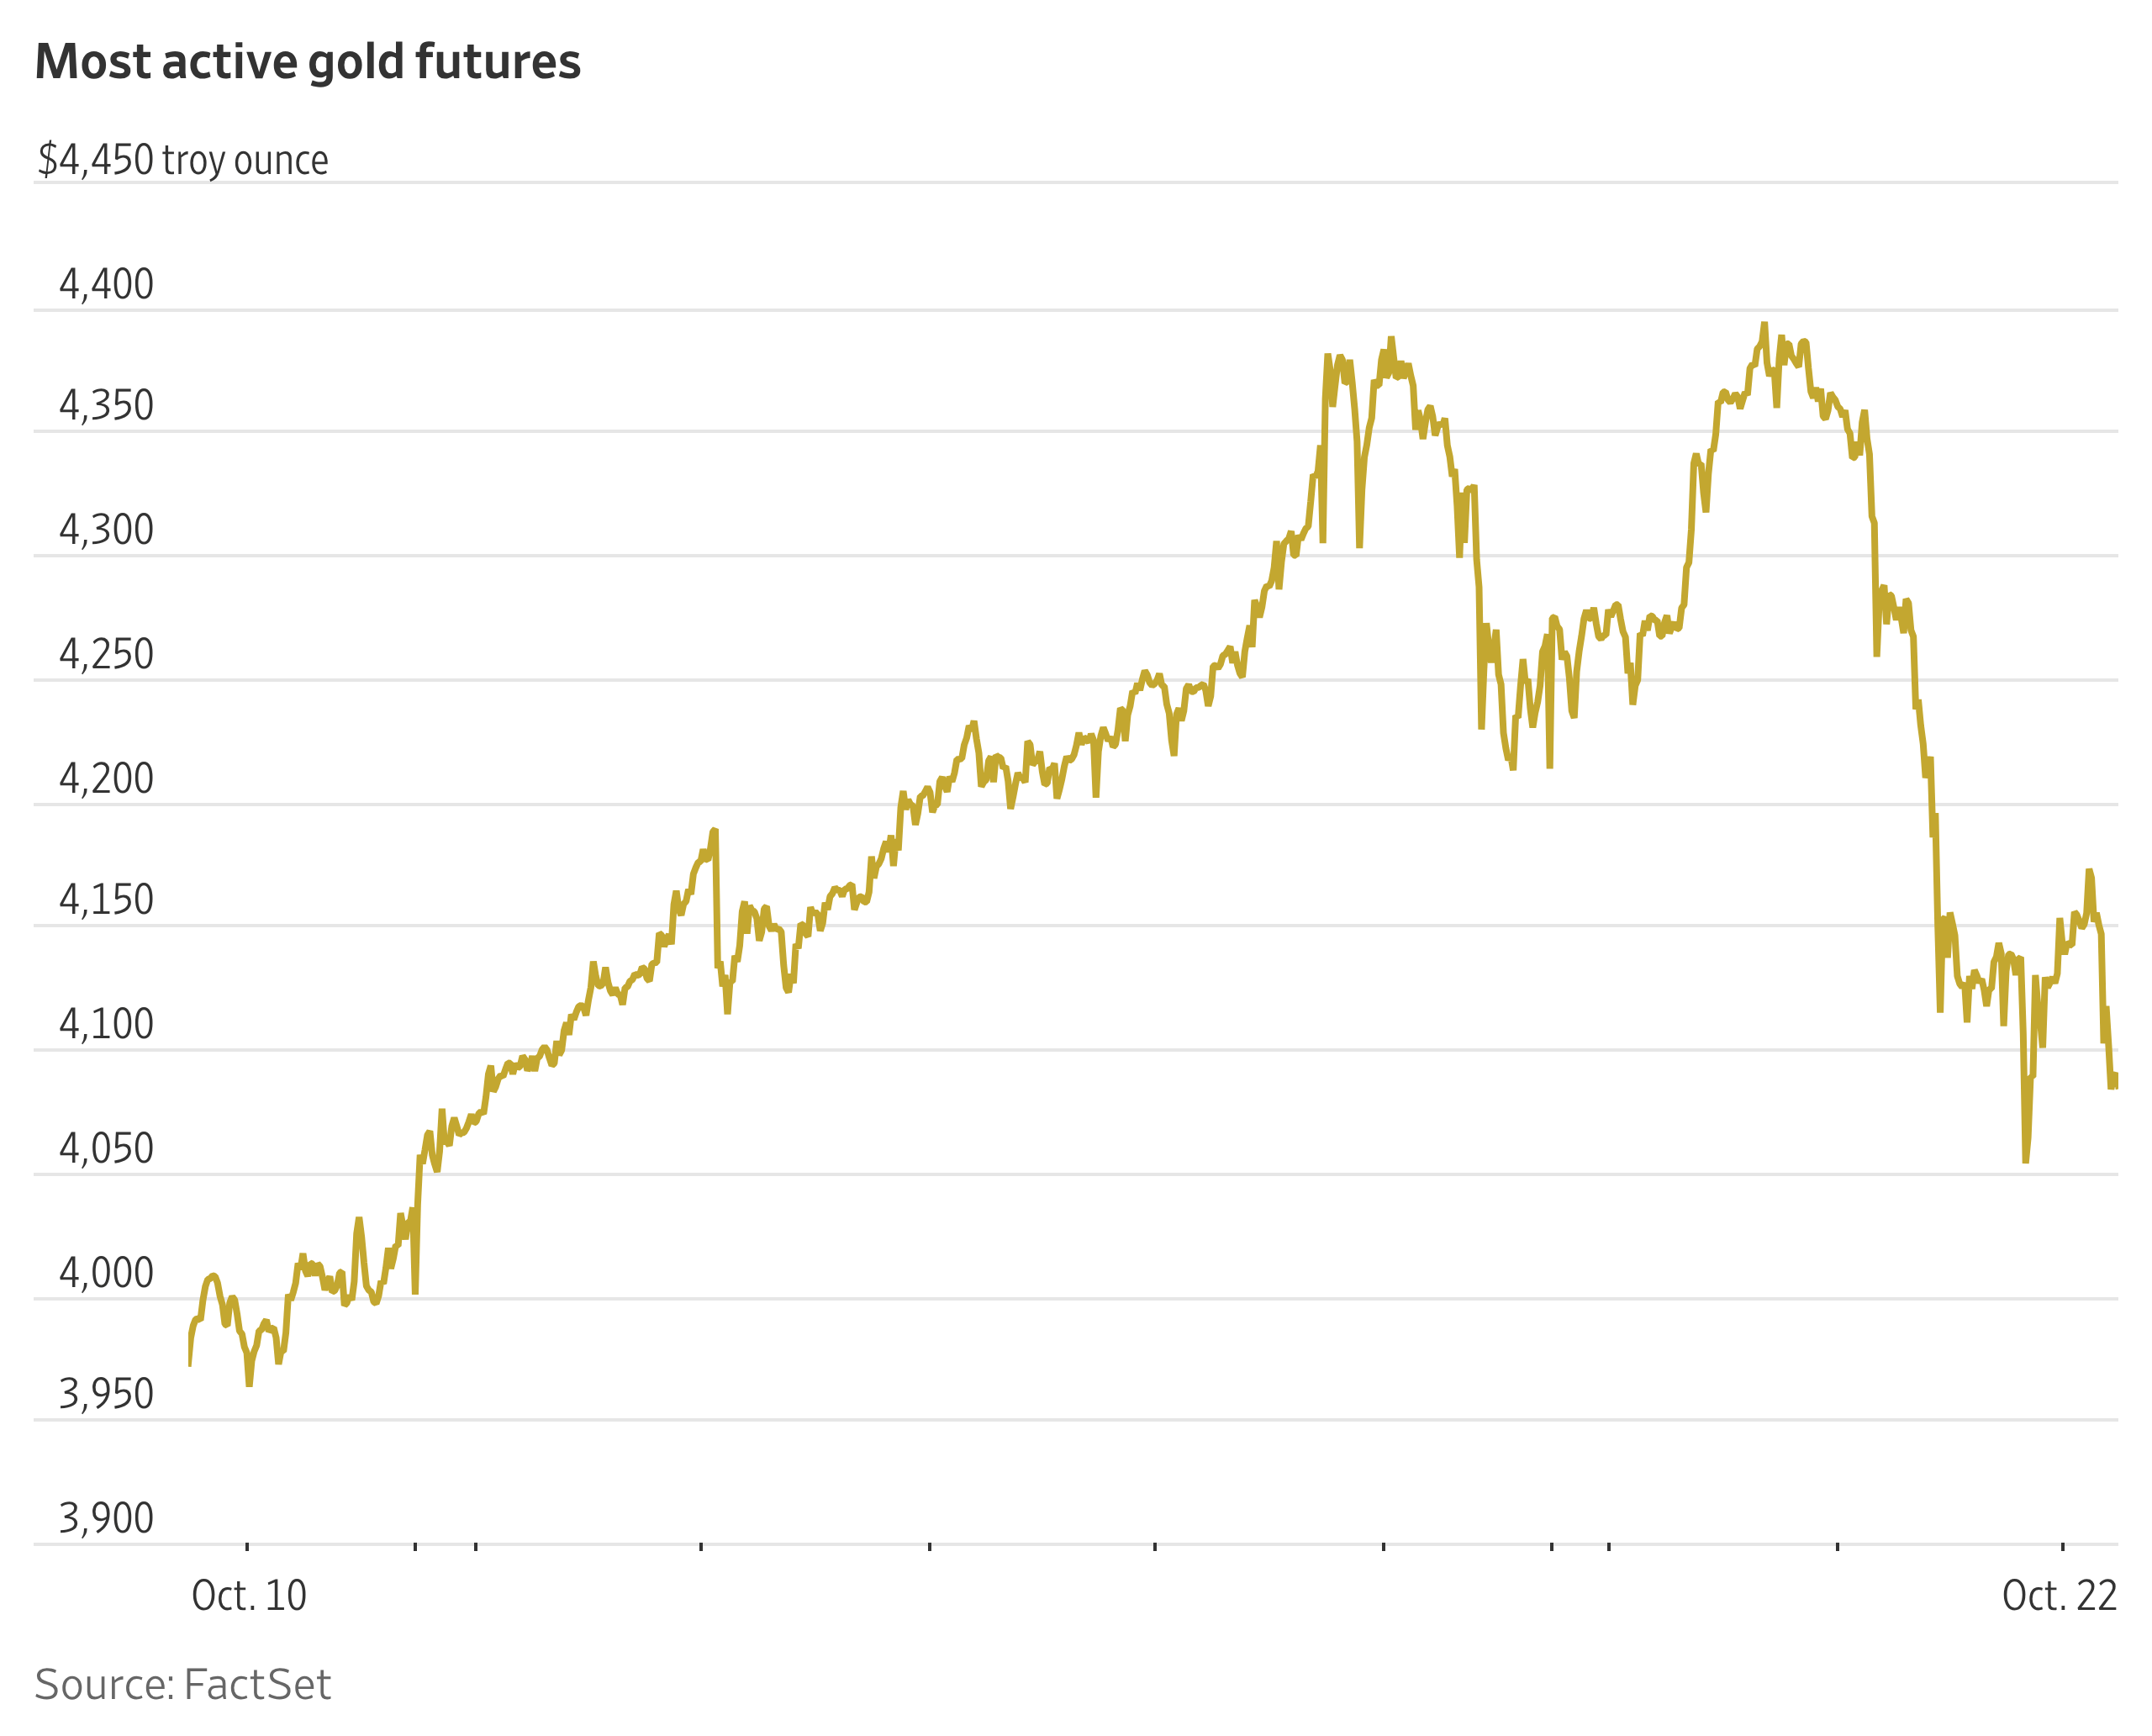
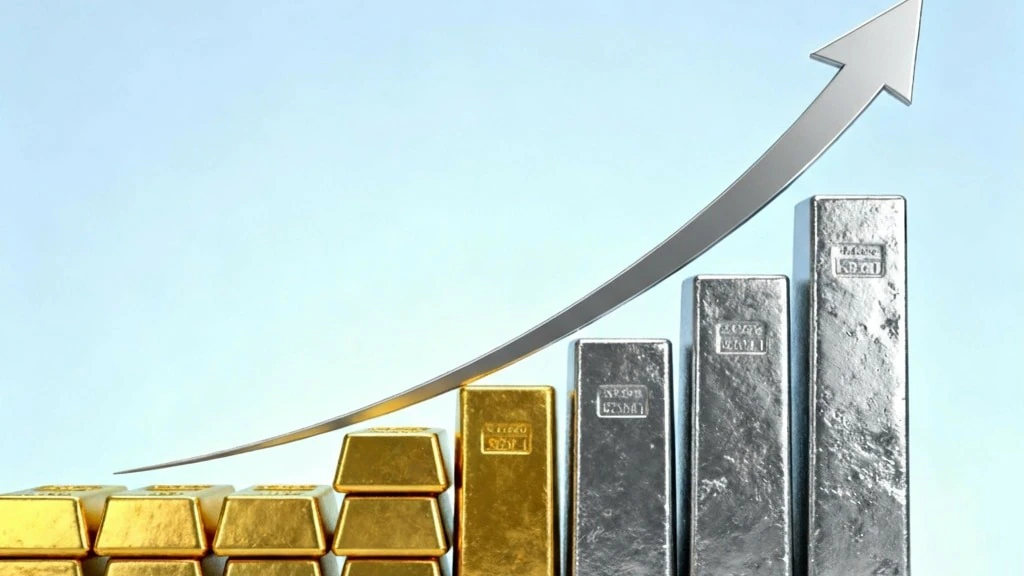
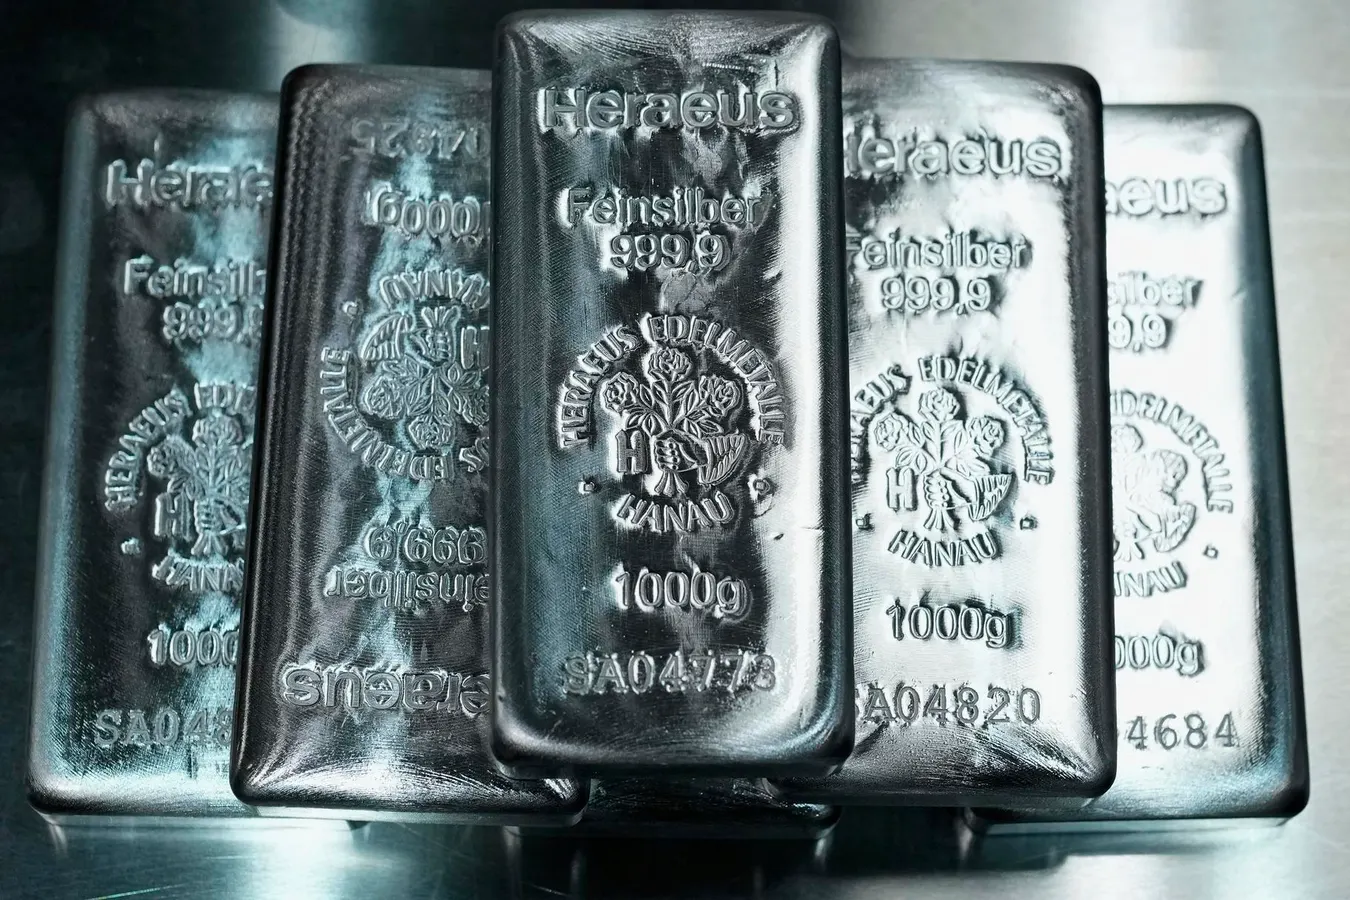
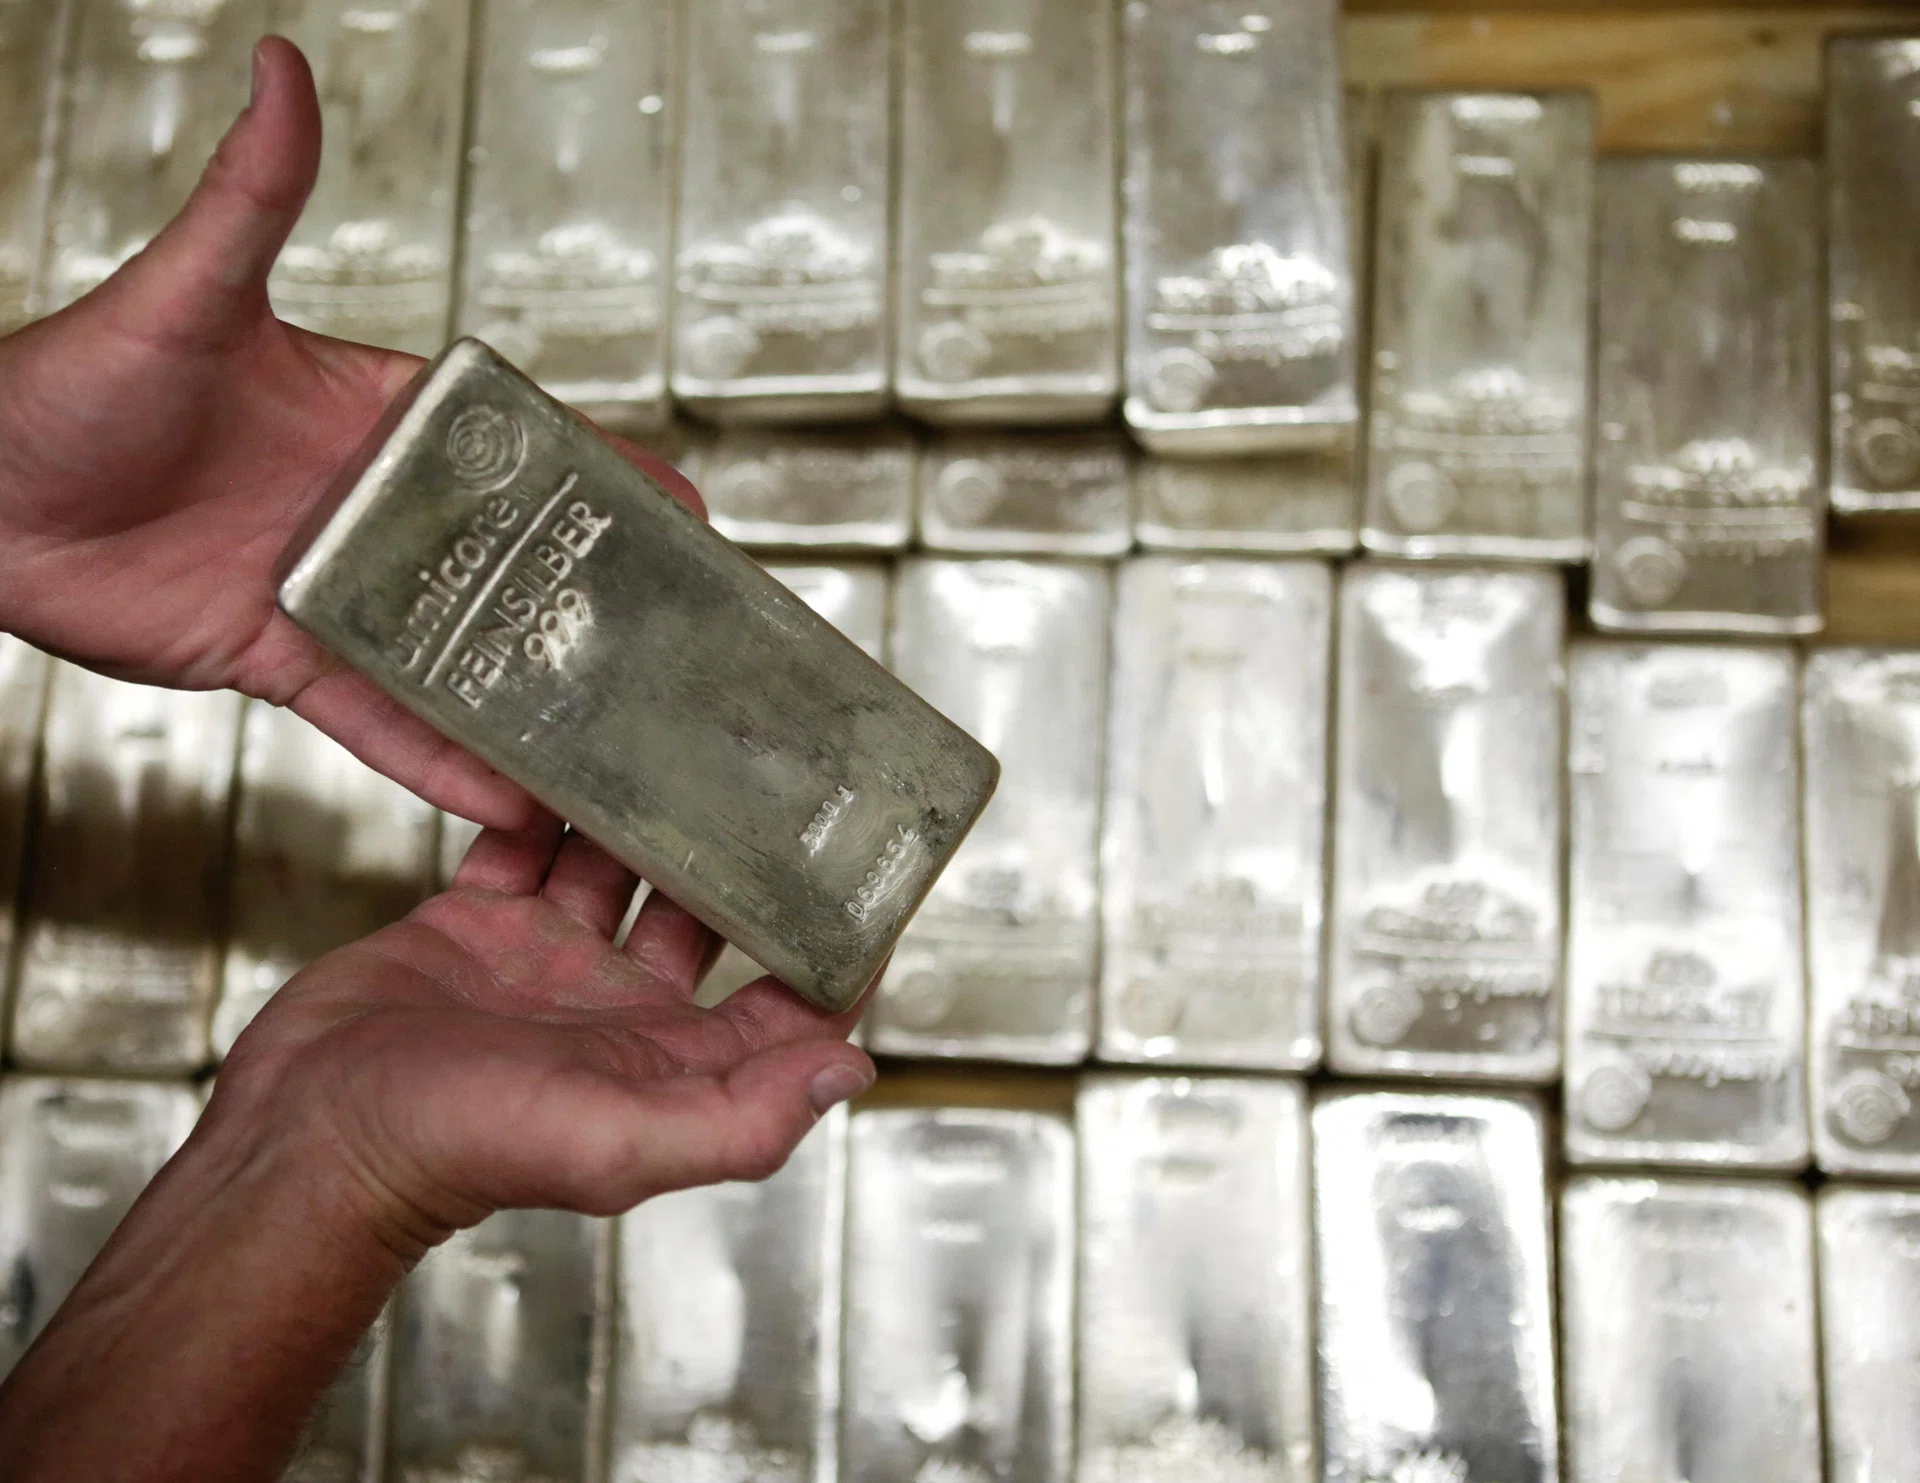
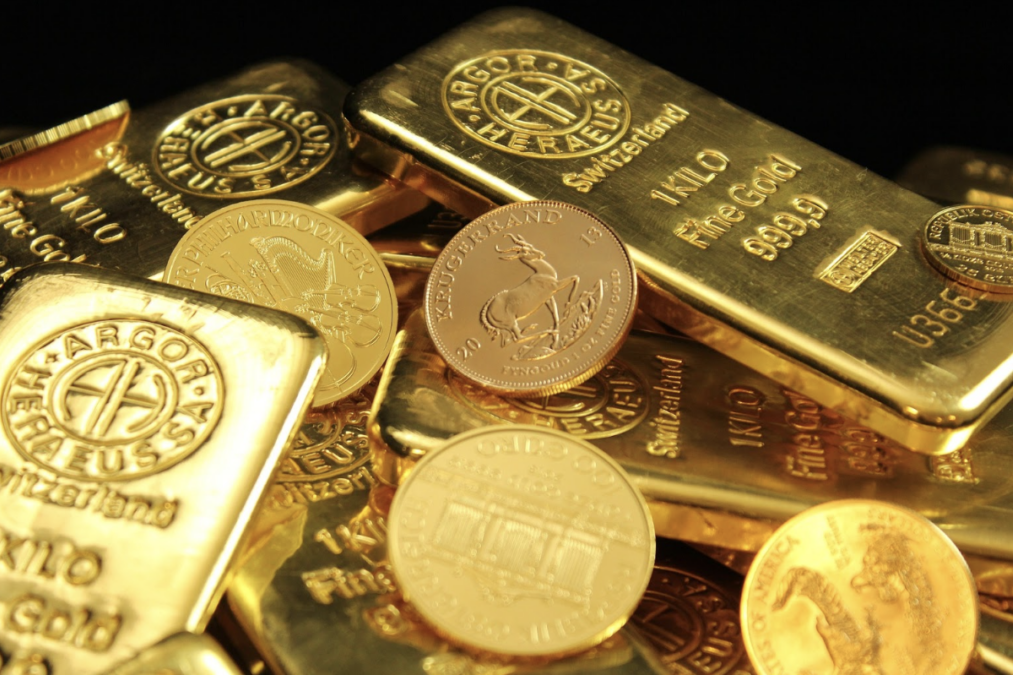
Gold has emerged as the standout performer in 2026 so far, while equities have delivered mixed returns. Persistent demand for safe-haven assets amid global uncertainty, currency concerns, and shifting in interest-rate expectations have continued to support gold prices. However, the precious metals space has not moved in tandem, with silver emerging as the second-worst performer this year.
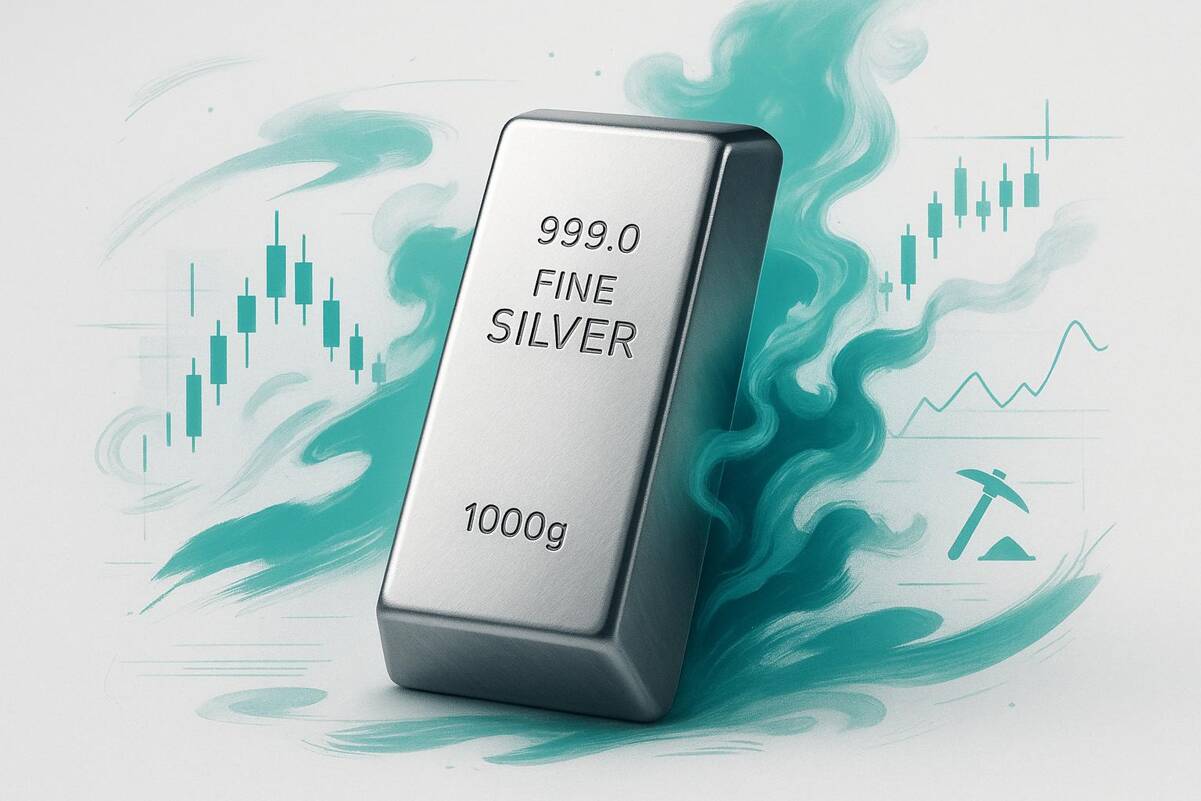
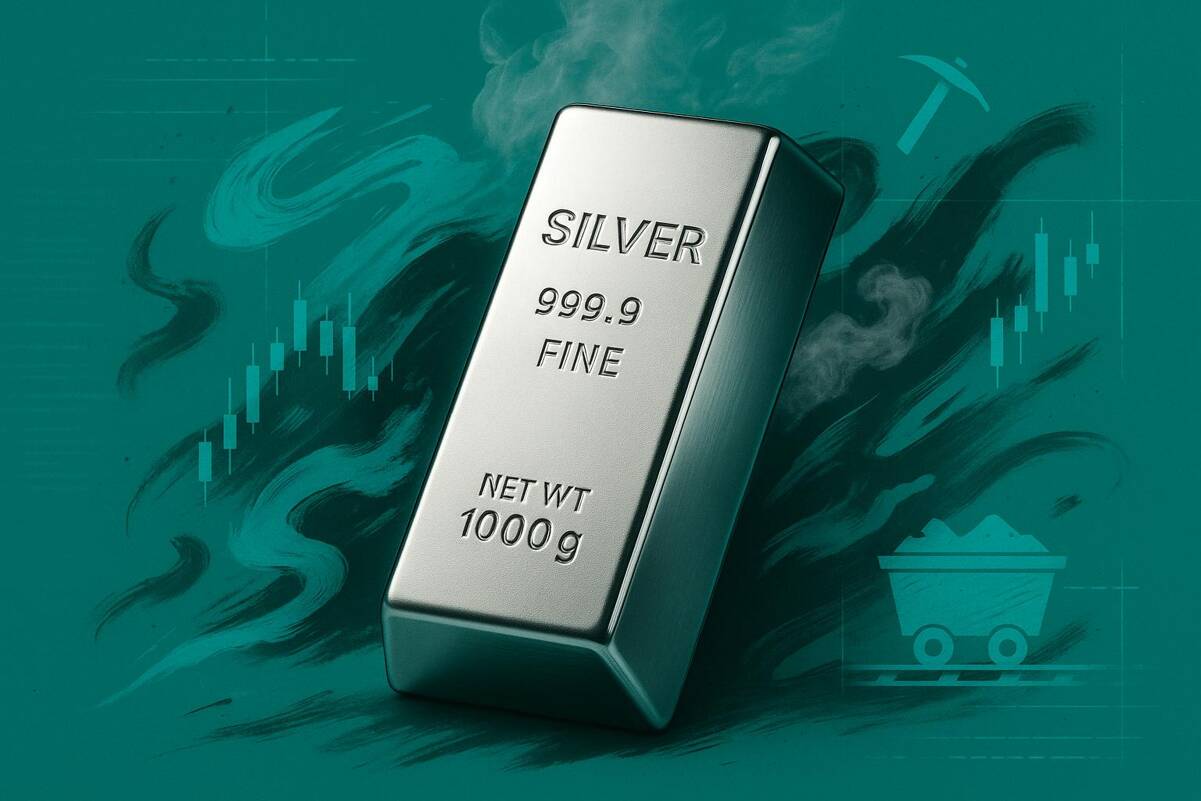
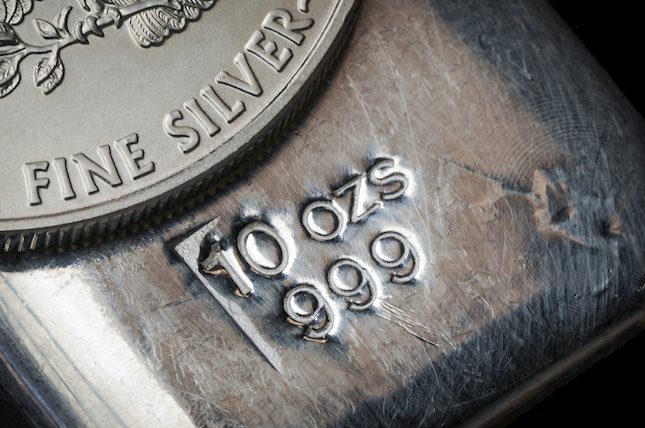
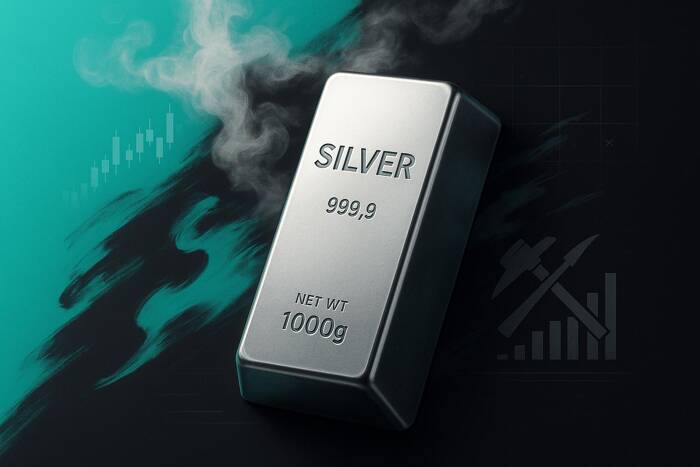
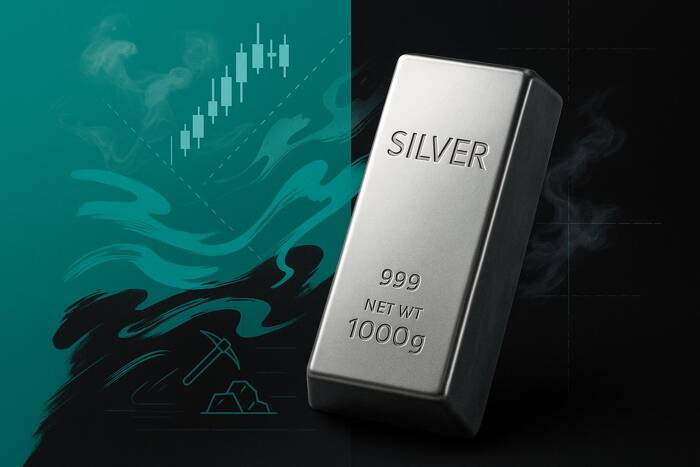
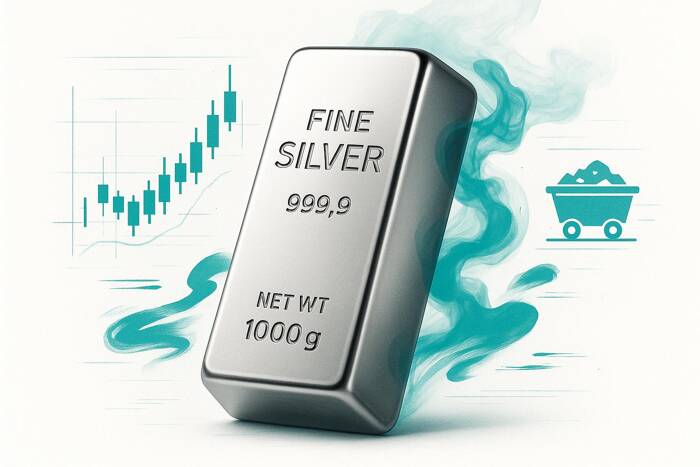
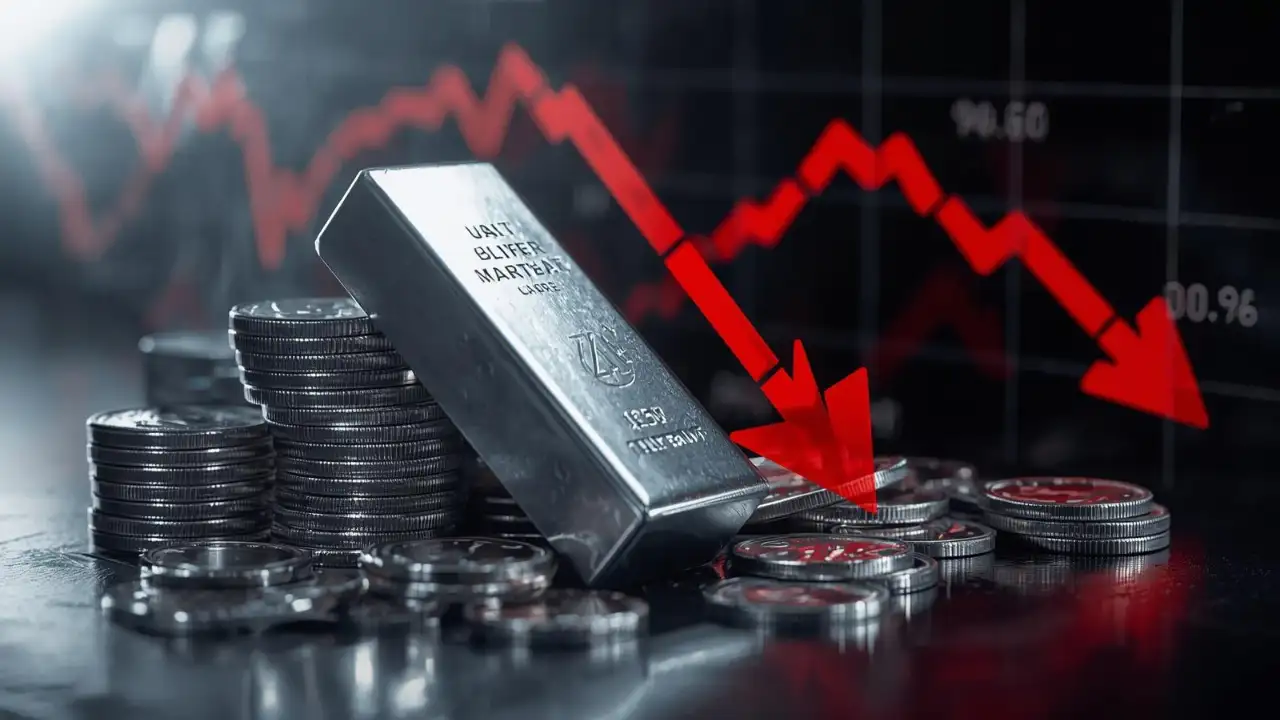
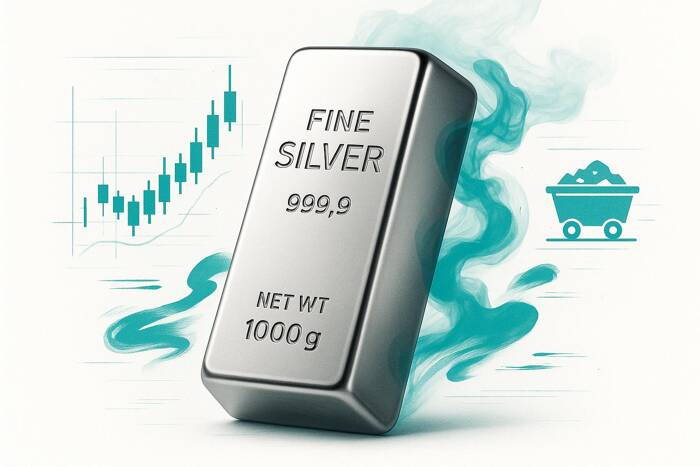
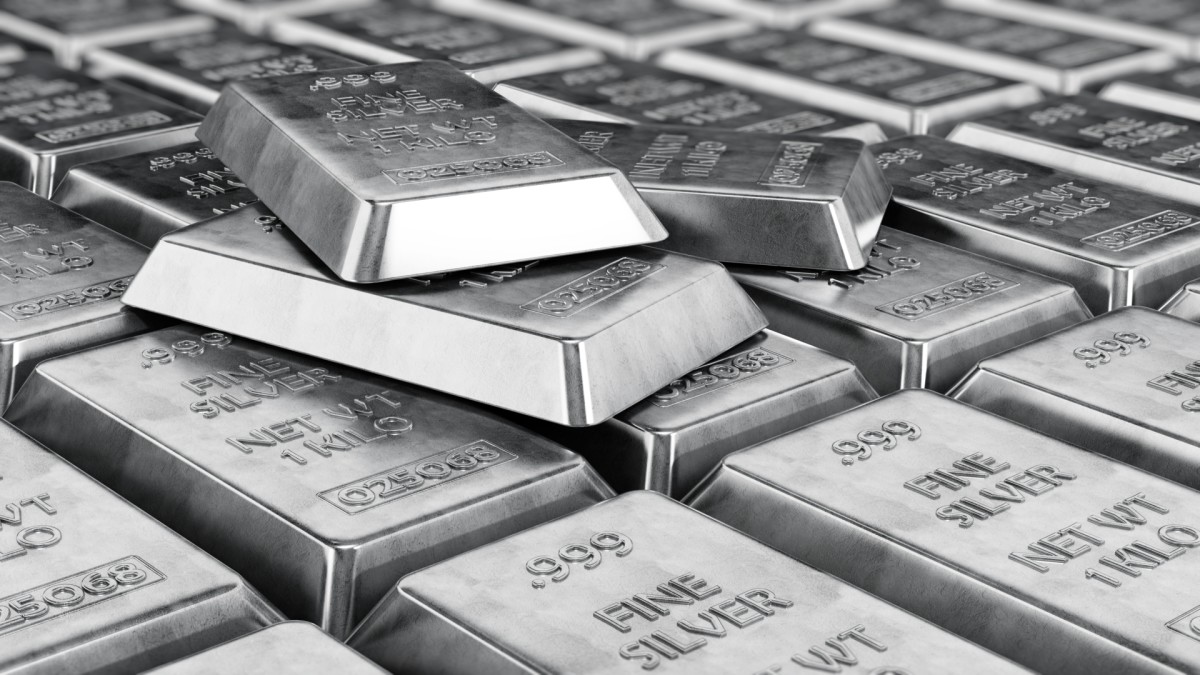
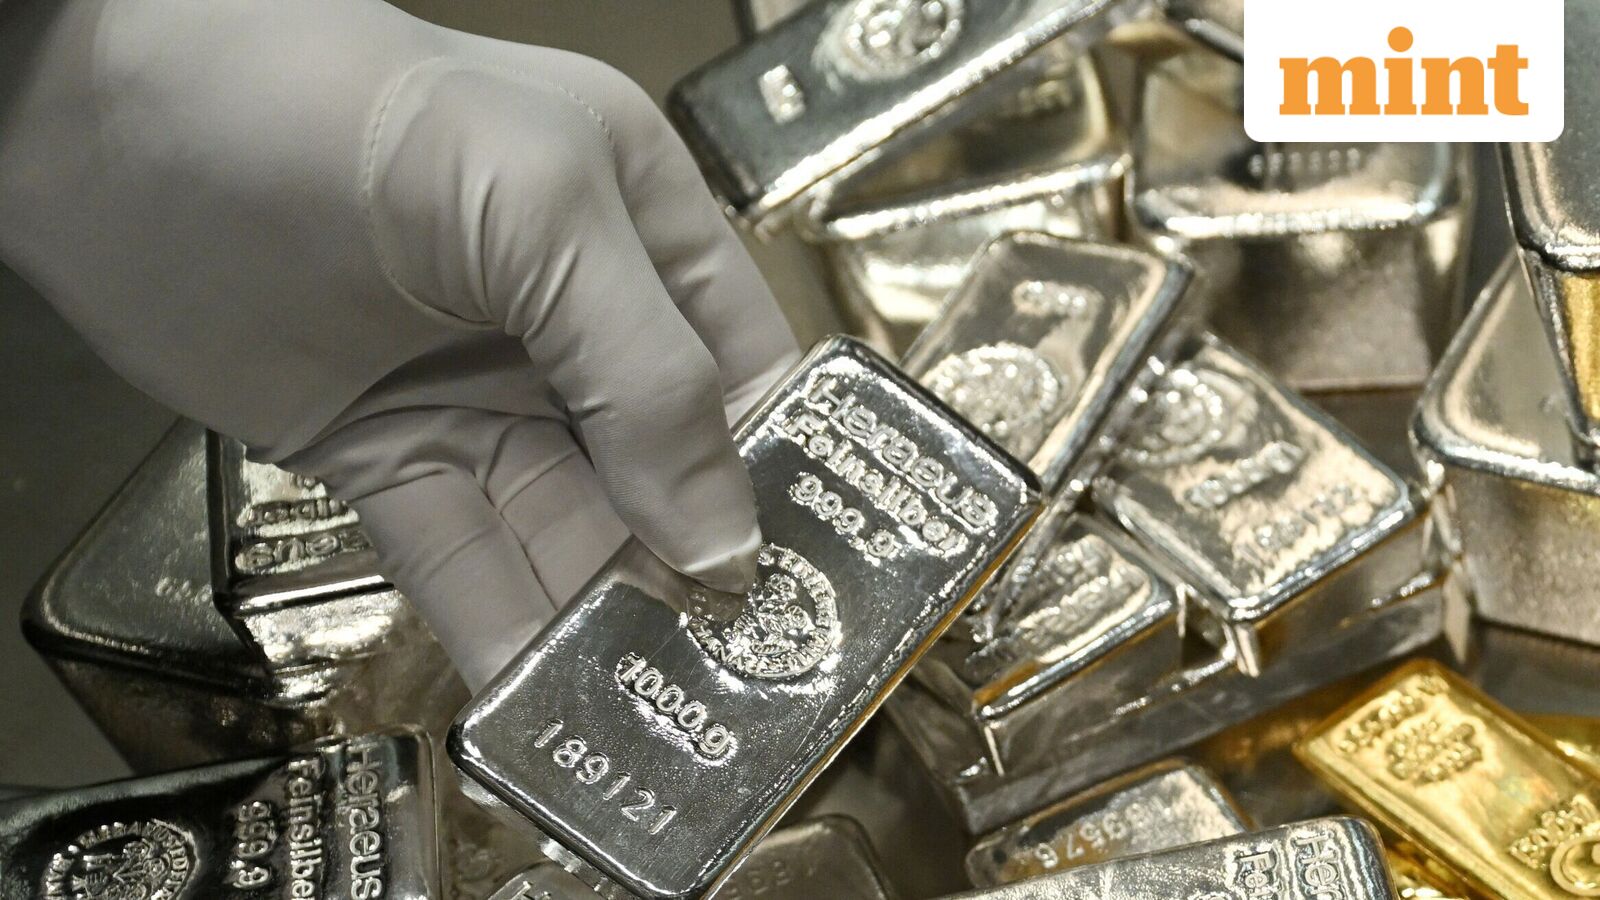
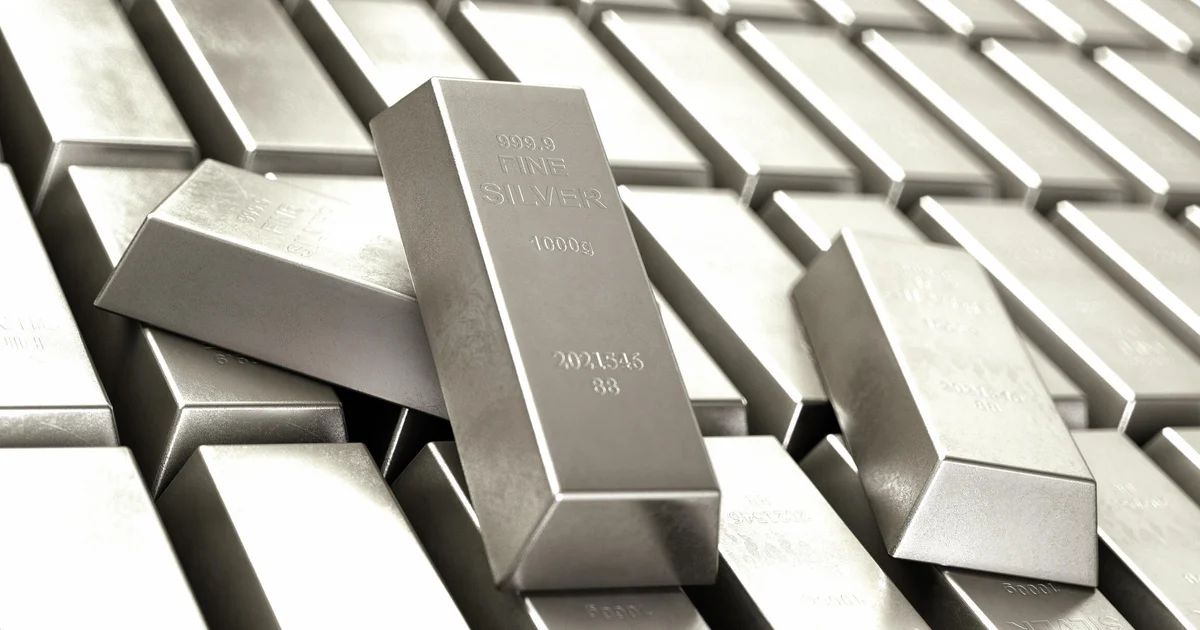
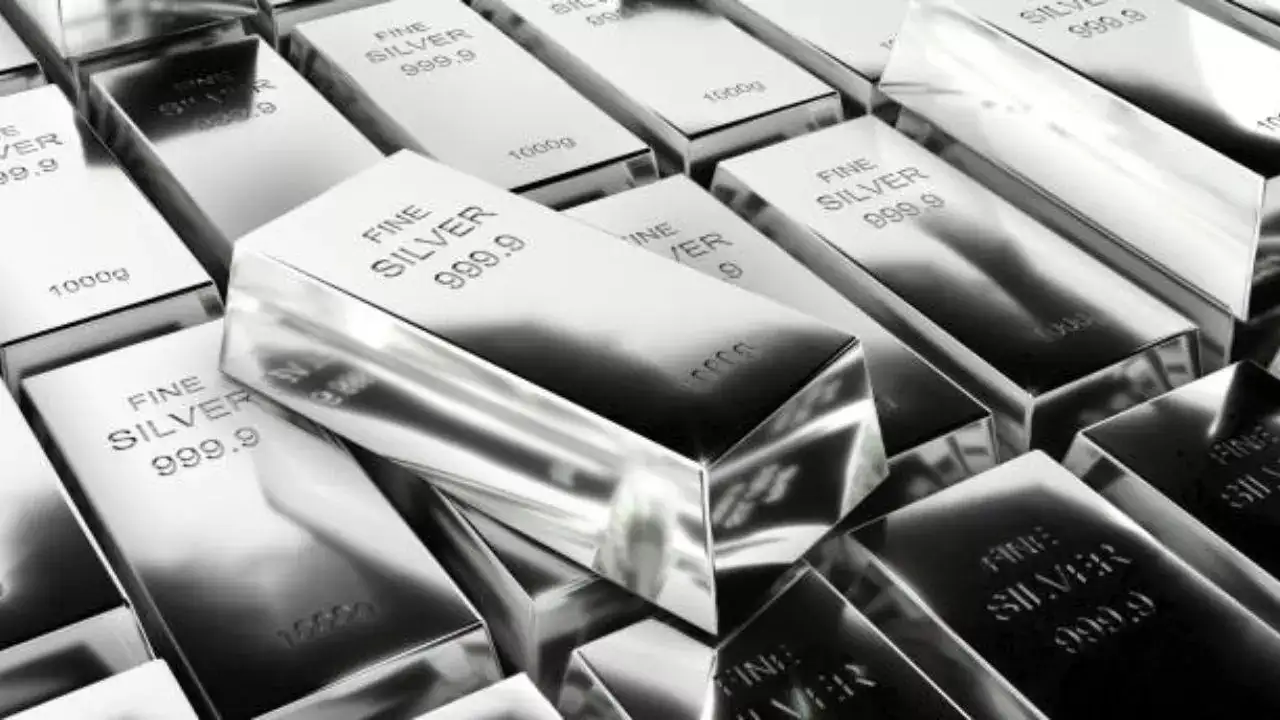
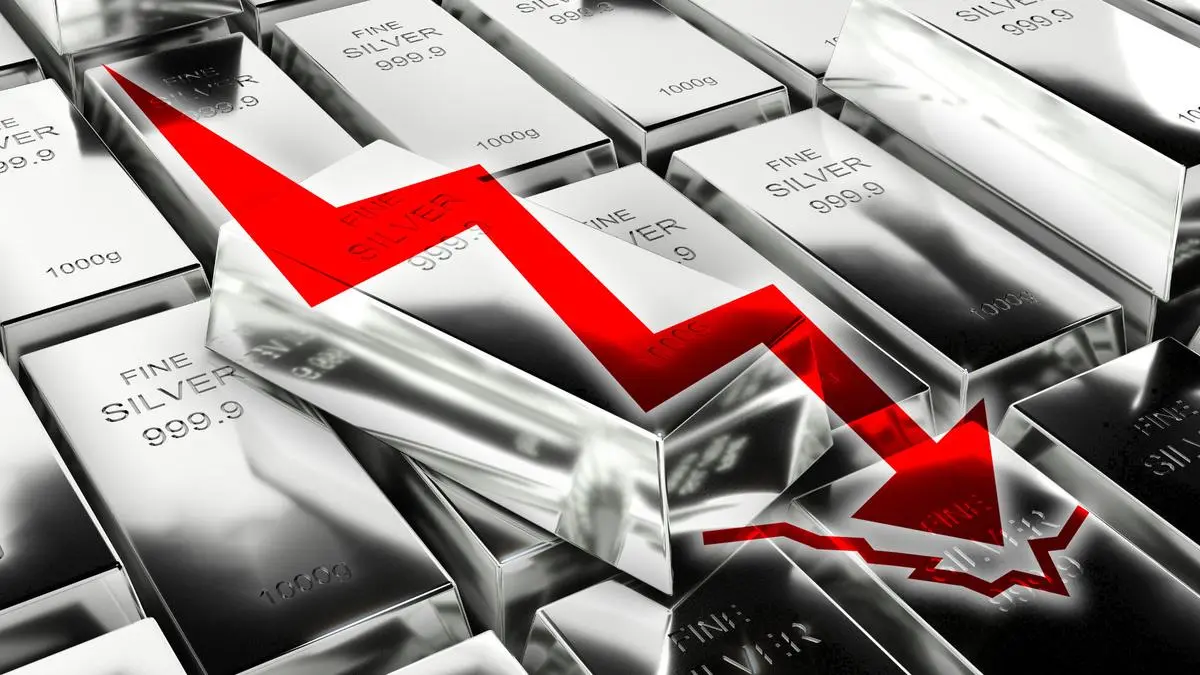
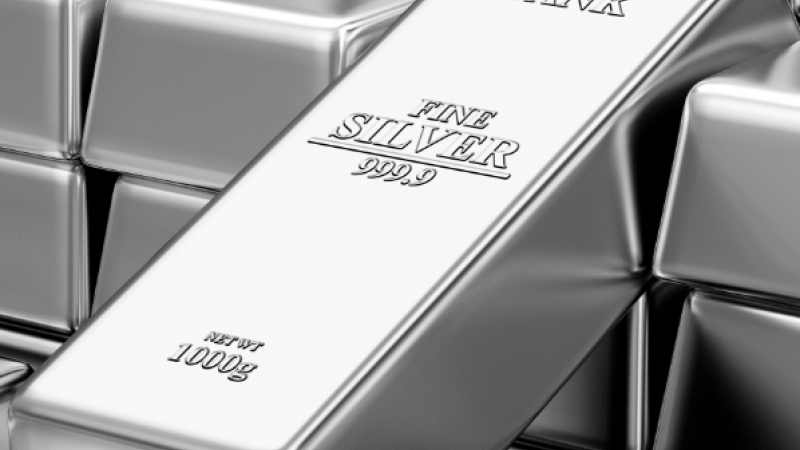
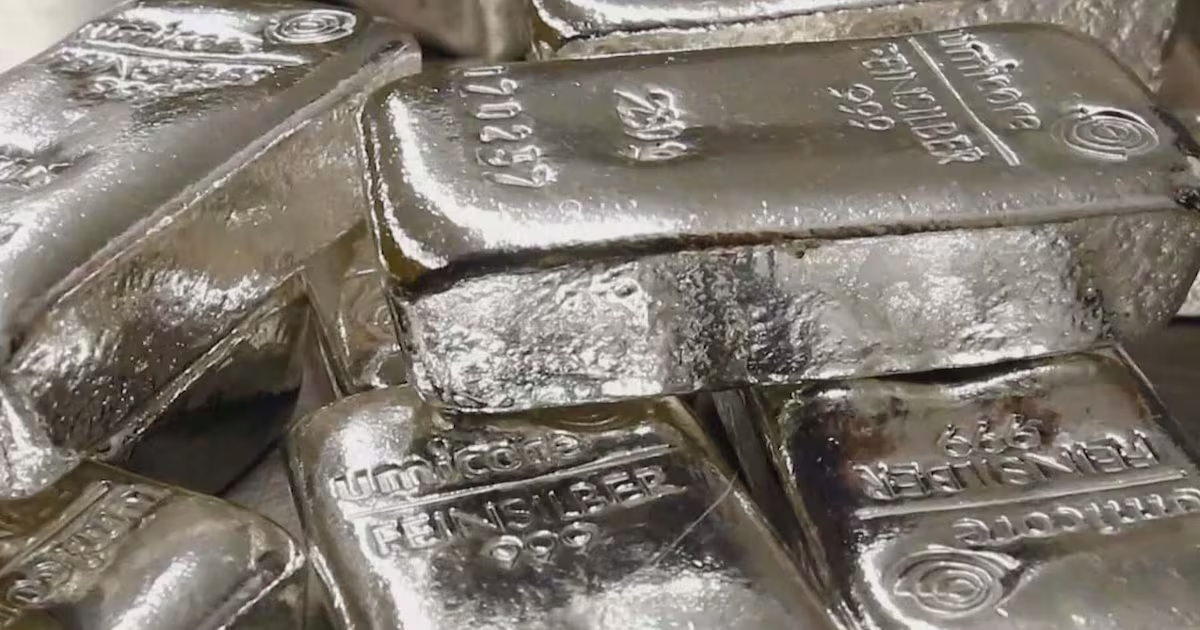
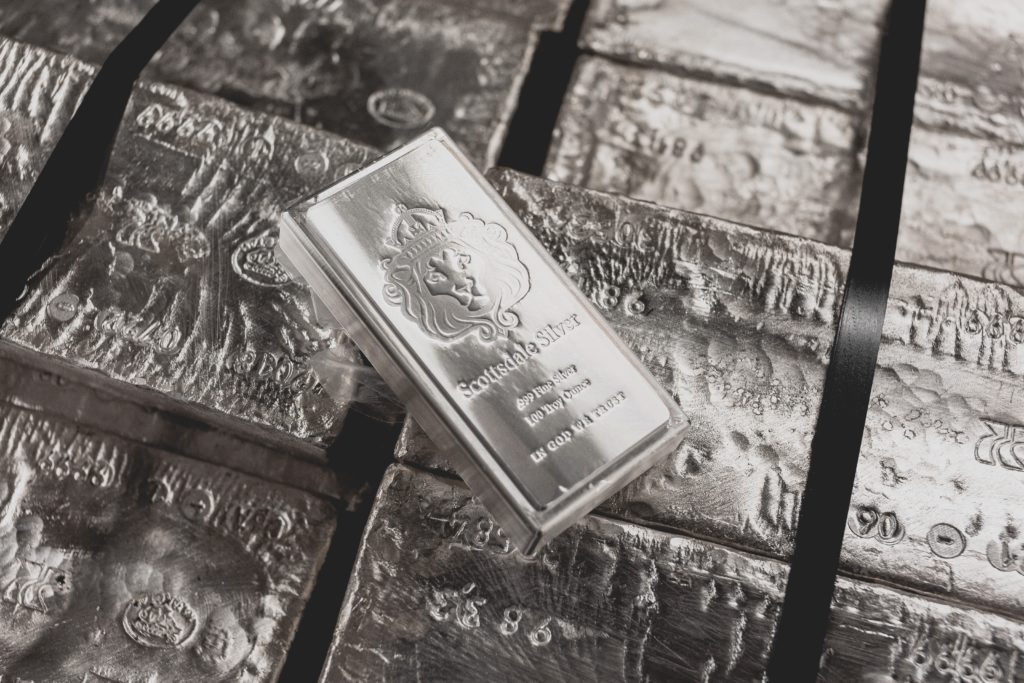
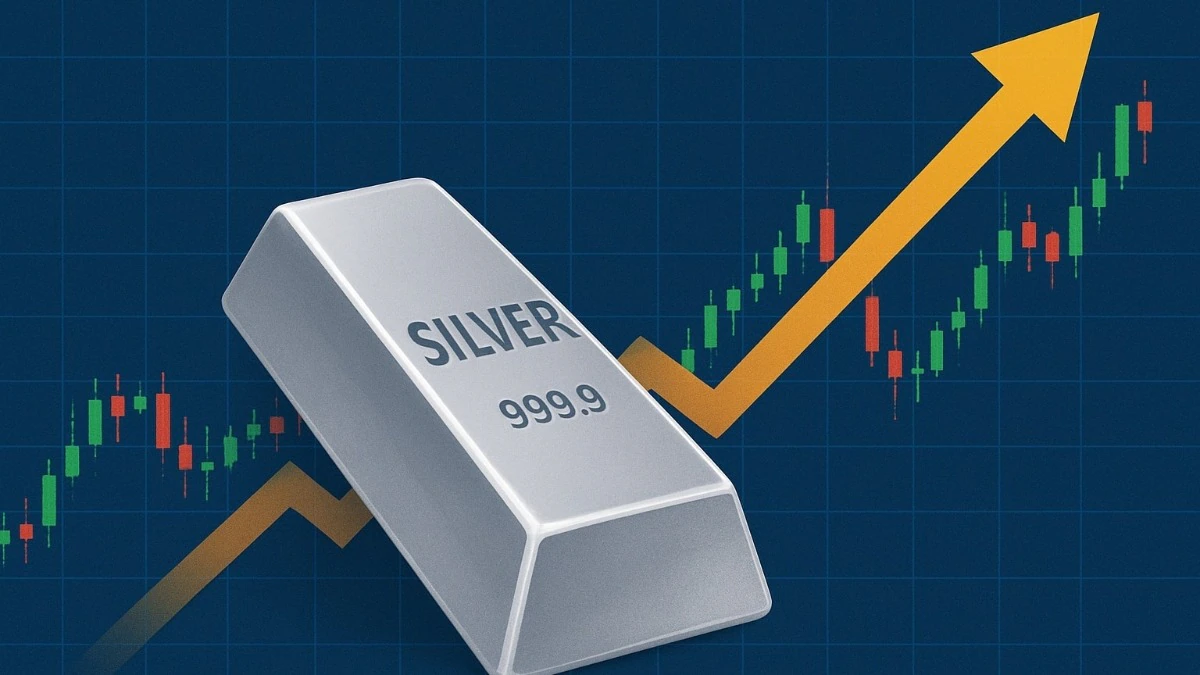
Silver’s underperformance reflects its dual dependence on investment demand and industrial consumption. Slowing global manufacturing activity and a cautious industrial demand outlook have weighed on sentiment. At the same time, the metal has remained susceptible to profit-taking following its strong rally in 2025.
Within equities, small-cap stocks have outperformed both mid-caps and large caps, indicating that the broader market recovery has been driven largely by smaller companies. Mid-caps have also generated healthy returns, whereas large-caps have lagged considerably. The trend suggests that strong domestic liquidity and improving earnings have supported the broader market, even as heavyweight stocks have remained under pressure. In the debt segment, long-duration government securities have trailed due to uncertainty surrounding inflation, interest rates and crude oil prices, which has reduced the appeal of duration-heavy strategies. In contrast, short-term debt instruments have fared better.
Long-term performance
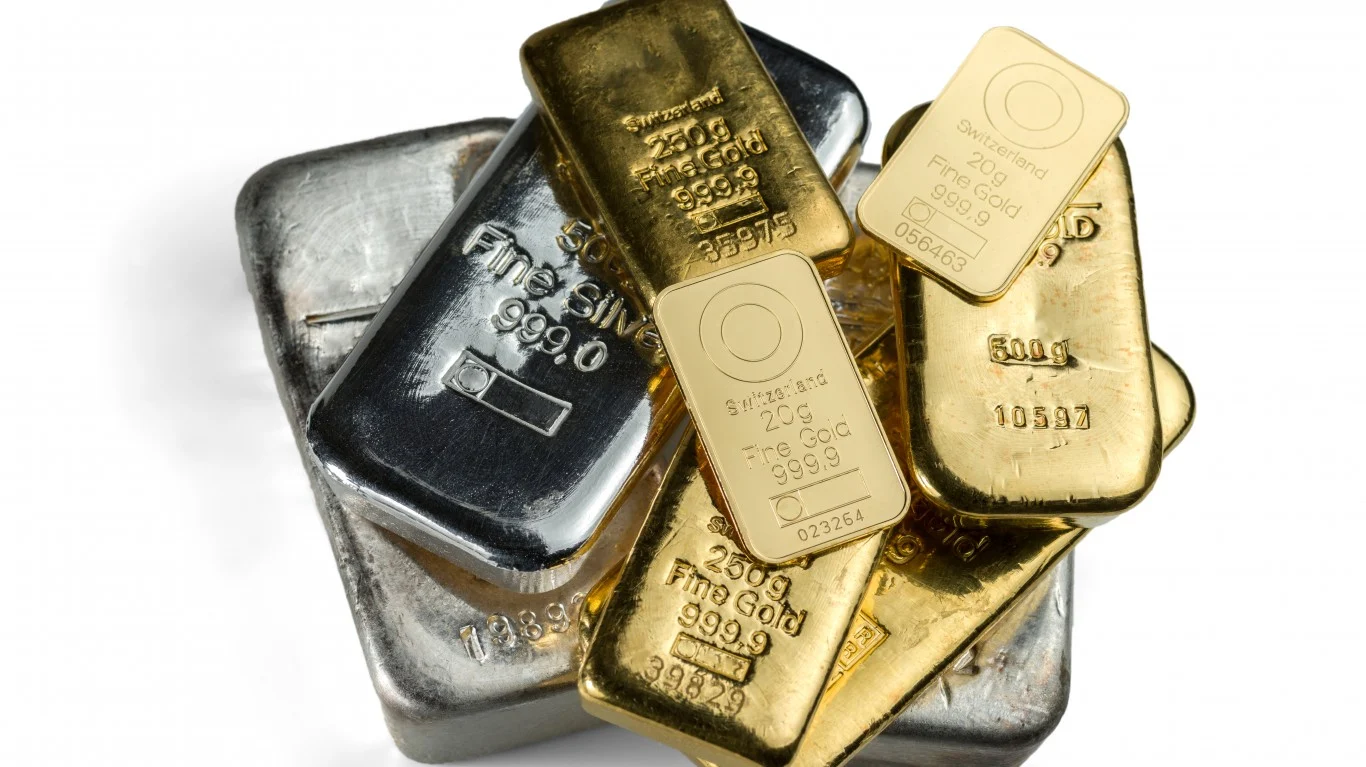
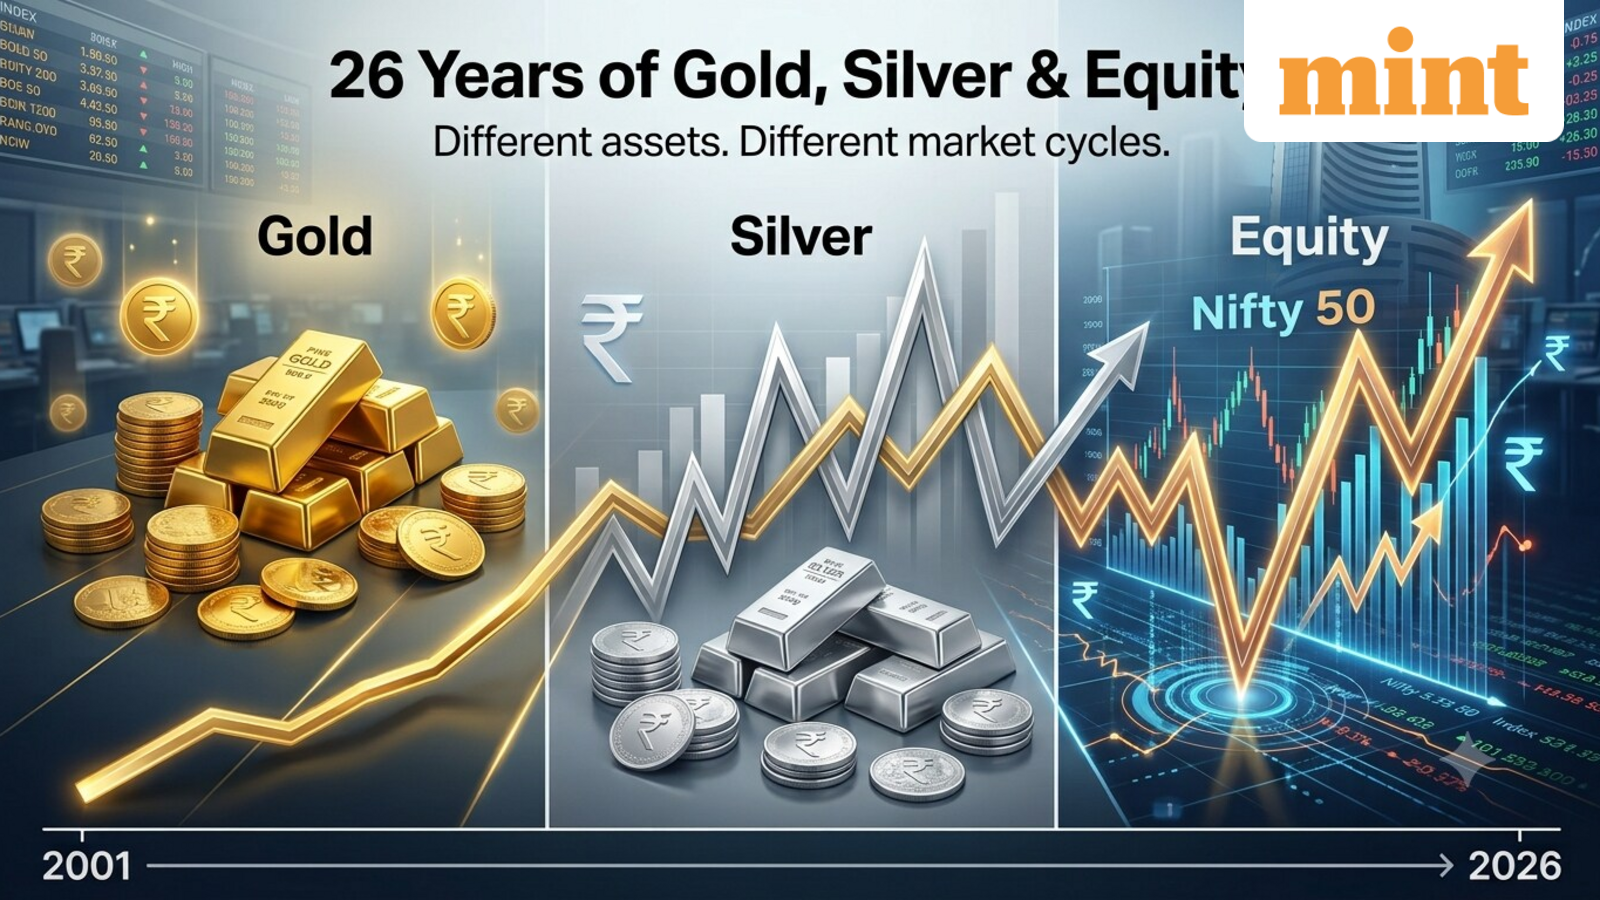
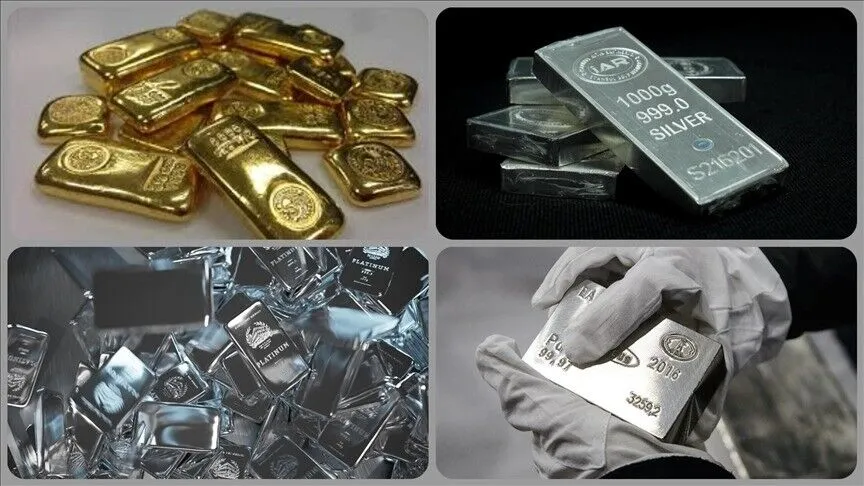
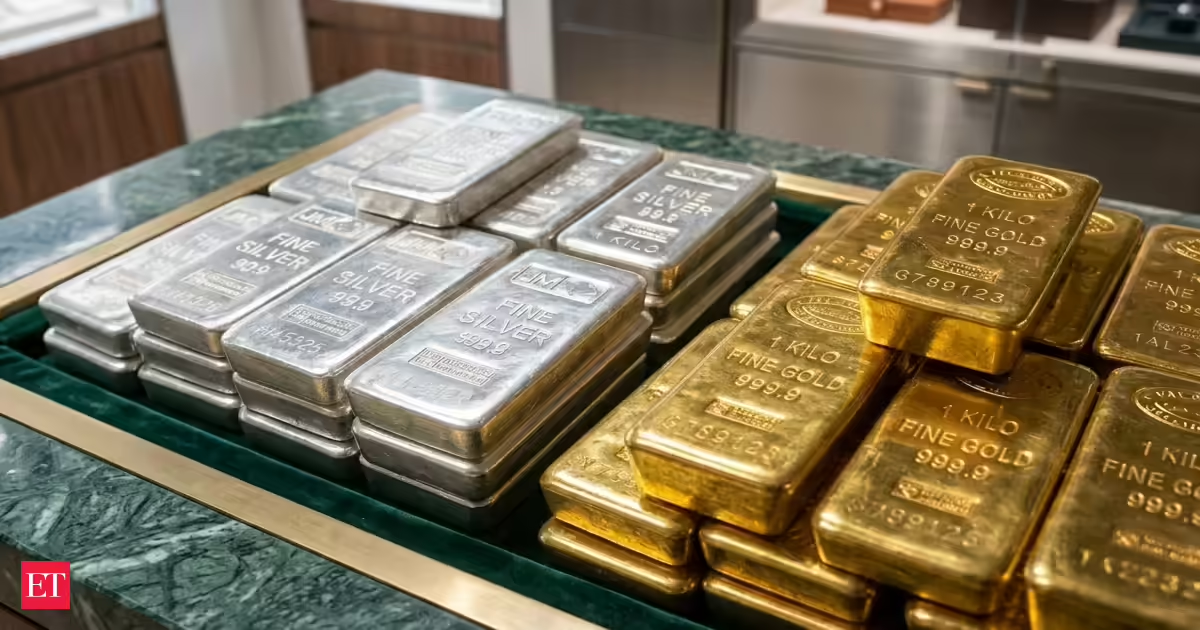
Over the past decade, precious metals have emerged as the strongest wealth creators, with silver outpacing gold in terms of returns. Equities have also delivered robust long-term performance, led by mid-cap stocks and followed by small-caps, reflecting the scalability of mid-sized businesses and the higher growth potential of smaller companies. Large-cap stocks, while trailing their smaller peers, have still generated meaningful wealth over the period.
In contrast, debt has stabilised portfolios, with short-term instruments offering steady, low-volatility returns, while long-duration government securities have fluctuated more with interest-rate movements.
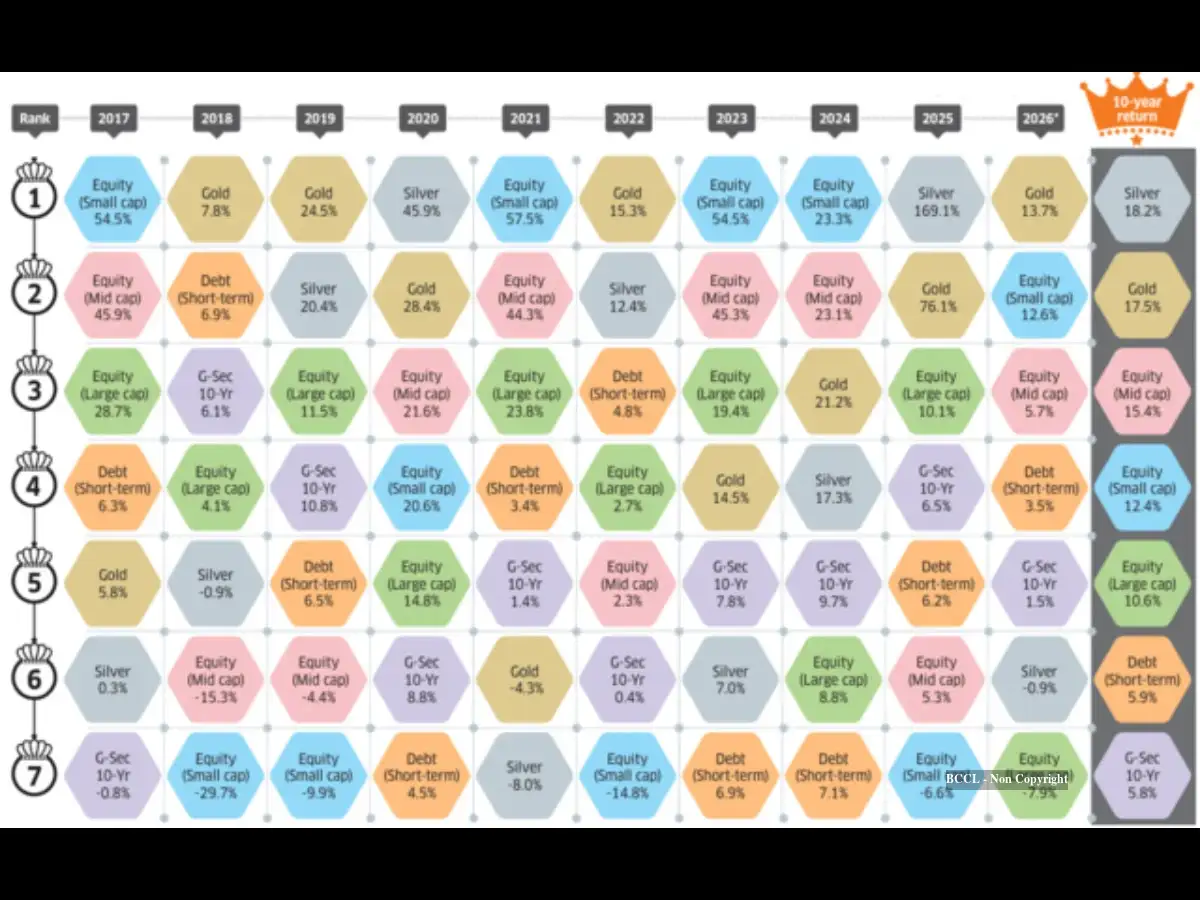
Source: Bloomberg & ACE MF. *2026 data is YTD based on 31 August 2026 closing values. Other year returns are calculated between the first and the last trading day closing values. Benchmarks used: Equity (Large cap) : Nifty 50, Equity (Midcap) : Nifty Midcap 100 Index, Equity (Small cap) : Nifty Smallcap 100 Index, Silver : MCX Silver futures, Gold : MCX Gold futures, G-Sec 10-Yr : Crisil 10 Yr Gilt Index, Debt (Short-term) : Crisil 91 Day T-Bill Index.