Just a few days ago, gold fell below $4,000, a level last seen in November 2025. While the start of 2026 was strong for gold, the scenario completely changed after the Iran war. Gold peaked at $5,602 in late January, its all-time high in history. It is now trading around $4,180, a 25% drop from its highest point.
But has gold hit a bottom? Should you buy the ‘dip’ now, or wait for any further correction? Let’s break it down.
What’s Pushing Gold Higher Right Now?
Gold prices surged by 2% on Thursday, driven by positive jobs data released the same day. In June, the US economy added 57,000 jobs, falling short of analysts’ predictions.
Immediately, the narrative changed. Asset prices, including gold, are influenced by various interrelated factors, but narratives also play a significant role in shaping them.
So, why would a weak jobs report push gold higher? A weak job market signals sluggish economic conditions, which reduces the risk of rising inflation. And if inflation isn’t a threat, there is no pressure on the US Fed to hike rates, as was being anticipated by the market.
This week, another event unfolded in favour of gold. Even though markets are currently pricing in a rate hike for September amid rising inflation, a comment from Kevin Warsh, the new US Fed chair, gave gold bulls some relief. Warsh said inflation expectations had cooled over the past month, meaning there was no rush to raise rates. His comments come at a time when potentially both inflation and rate hikes cannot be discounted.
Bottomline: Markets were expecting the US Fed to raise rates to fight rising inflation, but after the recent jobs data, that narrative has reversed, supporting gold prices, at least in the short-term.
Is It Time To Buy Gold Now?
“The short answer is not yet, at least not without conditions. Gold has corrected sharply, and the long-term case for the metal remains intact, but near-term headwinds are real, and emerging data could push prices lower before any meaningful dip-buying opportunity emerges,” says Kaynat Chainwala, AVP Commodity Research at Kotak Securities.
The gold market faces uncertainty primarily due to interest rates, which present a significant short-term challenge, yet central banks remain optimistic about the metal’s future.
Here’s the context. The recent gold bull run, which began in October 2022, drove gold prices from $1,666 to an all-time high of $5,602, primarily due to substantial gold purchases by central banks.
Global central banks purchased significant amounts of gold, with 1,082 tonnes in 2022, 1,037 tonnes in 2023, and a record 1,180 tonnes in 2024, marking a substantial increase from the average of 400-500 tonnes per year over the preceding decade, according to the World Gold Council. In 2025, banks bought about 850 tonnes, which was still above the historical average. The more recent data also shows continued buying support by central banks in 2026.
Dr. Renisha Chainani, Head of Research at Augmont, believes there’s still a case for buying gold. “Yes, but selectively. With central banks buying a net 244 tonnes in Q1 2026, exceeding the five-year average, and global gold demand at 1,231 tonnes in Q1 2026, the highest January–March figure on record, structural demand remains intact even as prices correct,” says Dr. Chainani.
On strategy, she recommends a cautious, phased approach rather than going all in at once. “The current $3,950–$4,110 band looks more like consolidation after a historic 2025 rally than the start of a bear market. However, this favours staggered, tranche-based accumulation near support rather than aggressive lump-sum buying, since a hawkish Fed surprise or renewed dollar strength could still extend the correction before a durable bottom forms,” adds Dr. Chainani.
Gold: What Do The Technical Charts Say?
When fundamental factors are throwing up mixed signals, investors and analysts often turn towards technical charts to supplement their investing decisions.
Earlier this month, gold had fallen below the 200-Day Moving Average (200 DMA), signaling a bearish outlook. Big buying volumes haven’t been seen since then.
Gold has been trading around $4,000 for over 3 months now, and year-to-date, returns have been negative 3%. “The pullback from January’s peak near $5,600 is best read as a corrective consolidation rather than a trend reversal. For the second half of 2026, spot gold is expected to trade broadly between $3,400 and $4,400.
On the downside, $3,900 is the first major support, followed by $3,600 and then $3,400. On the upside, gains are likely capped near $4,400, and a sustained close above that level would turn the medium-to-long-term bias decisively positive and confirm the correction is complete,” says Chainwala.
Gold In India: A Different Story
In the domestic market, the gold price in India has gained 11.5% YTD, thanks to the 9% duty hike and the rupee’s depreciation against the dollar.
From Rs 1,32,614 on January 1 to Rs 1,47,770 on July 3, 2026, MCX spot gold has increased by Rs 15,156 per ten grams (24 carat) so far in 2026.
On the domestic front, here’s where support and resistance stand for gold on MCX. “On MCX, gold has support around Rs 1,40,000, with resistance at Rs 1,50,000,” says Dr. Chainani.
Chainwala also flags the MCX triggers that could accelerate a move in either direction. “On MCX, a decisive move below Rs 1,37,550 would accelerate the corrective decline toward Rs 1,30,000–Rs 1,35,000. On the upside, Rs 1,45,000 is key resistance, and a sustained break above that level could open the path toward Rs 1,55,000–Rs 1,60,000,” adds Chainwala.
The Big Picture
Gold right now is being pulled in two directions at once. “At current levels, the headwinds and tailwinds are unusually balanced. Every major gold bull run has seen a 30–40% correction before the next leg higher, and the current decline from January’s peak sits within that range,” says Chainwala.
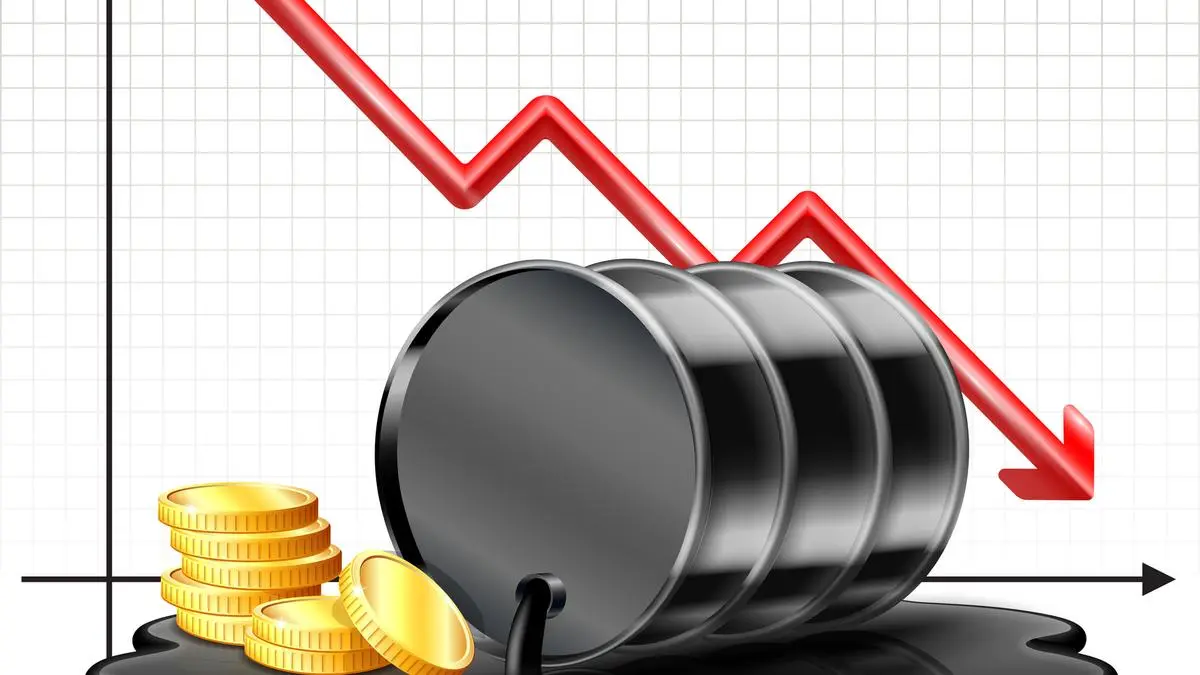
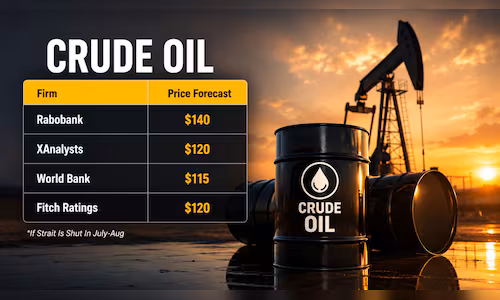
Beyond falling oil prices, the US Fed actions over the next few months, if not weeks, will play a big role in the direction of gold prices. The movement of the US dollar index will be the other dominant factor, which has already shown extraordinary strength over the last year, rising from the lows of 97.1 to nearly 101 now. A stronger dollar drives money out of gold, a non-yielding instrument, into dollar-backed assets.
For long-term investors: keep an exposure of 5-10% of your portfolio in gold, while traders continue to take cues from the technical factors. As far as the single most important indicator is concerned, the dollar index could be the one to watch.
And if you are looking for one big narrative that can change the scenario for gold, it is about interest rates remaining ‘higher for longer’. So far in 2026, gold has suffered heavily precisely because of this, and any change in that narrative, followed up with real economic data, could see valuable support for gold. Until then, the headwinds could keep the yellow metal from shining bright again.
Disclaimer: This article is for informational purposes only and should not be construed as investment advice. The views and recommendations expressed by experts quoted in this article are their own and do not represent the views of this publication. Gold and commodity prices are subject to market risks. Readers are advised to consult a certified financial advisor before making any investment decisions.