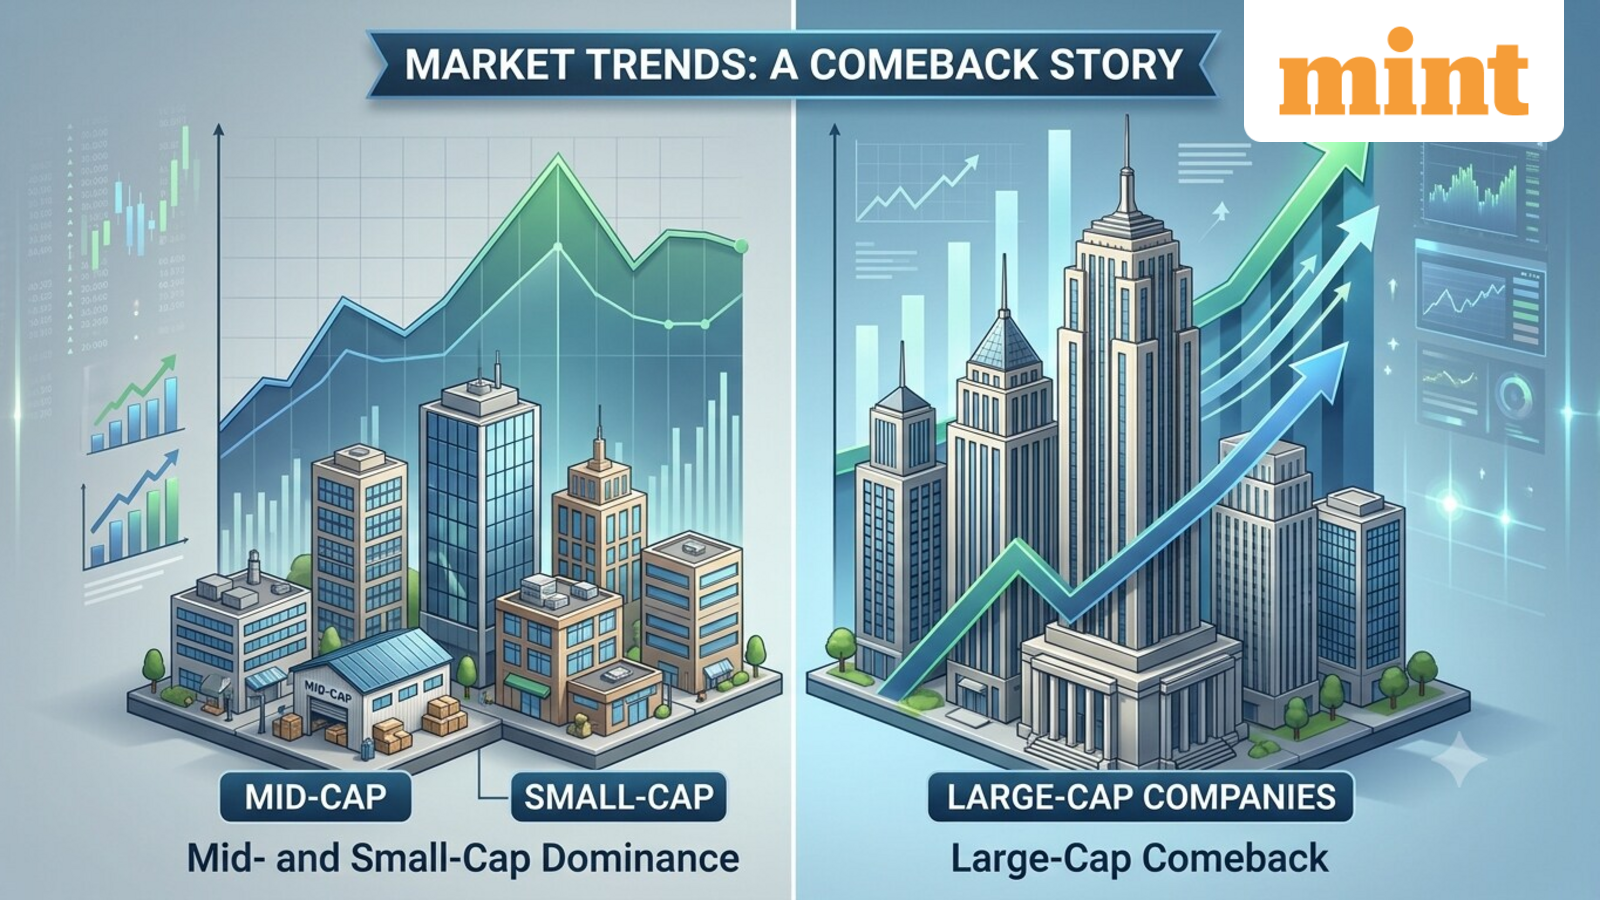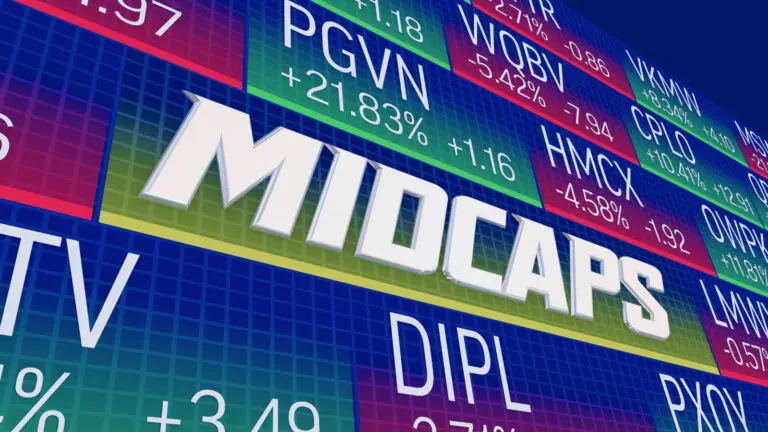

Factor strategies have often gravitated toward the upper end of the market, leaving the mid-cap segment comparatively underexplored. The John Hancock Multifactor Mid Cap ETF (ticker: JHMM), launched in 2015 and subadvised by Dimensional Fund Advisors for Manulife John Hancock Investments, applies a systematic, research-driven process to the U.S. companies sitting between the giants and the small caps.
Michael Marrkand, CFA, joined the fund’s management team at Dimensional in 2025 and now shares responsibility for a portfolio spanning several hundred mid-cap companies. “Our John Hancock multifactor mid-cap ETF buys mid-cap securities within the U.S., and we seek to capture the size, value and profitability premiums within the U.S. mid-cap space,” he tells The Wealth Advisor’s Scott Martin. “So, it’s a really great broadly diversified portfolio while we’re trying to implement a factor investment process to capture those size, value and profitability premiums.”
A Partnership Built for the ETF Wrapper
Dimensional and Manulife John Hancock have collaborated on a slew of products for roughly two decades, and the multifactor ETF suite arrived a little more than 10 years ago. According to Marrkand, the suite started with a knock on Dimensional’s door.
“John Hancock and Manulife have this really rich history of going out and finding investment managers to manage funds for them with different investment styles,” he says. “So Dimensional was very excited when [they] came to Dimensional and said, ‘Hey, we’re looking for a factor-based systematic investment manager. Would you be able to put all of your great investment processes and research into the ETF wrapper for us?’ Because it’s something clients were looking for at the time.”
The suite went on to serve as Dimensional’s first real foothold in exchange-traded funds, and Marrkand credits it with helping the firm earn the trust of a wide range of clients. “It’s been a fantastic relationship, I think for both of us,” he adds.
Four Decades of Research Behind the Process
Dimensional has managed portfolios for more than four decades, and the firm’s starting assumption has held throughout. Markets work, and prices absorb new information quickly. Any idea layered on top of that foundation, Marrkand notes, has to earn its place through rigorous empirical research, and the ideas able to clear the bar shape how each portfolio leans.
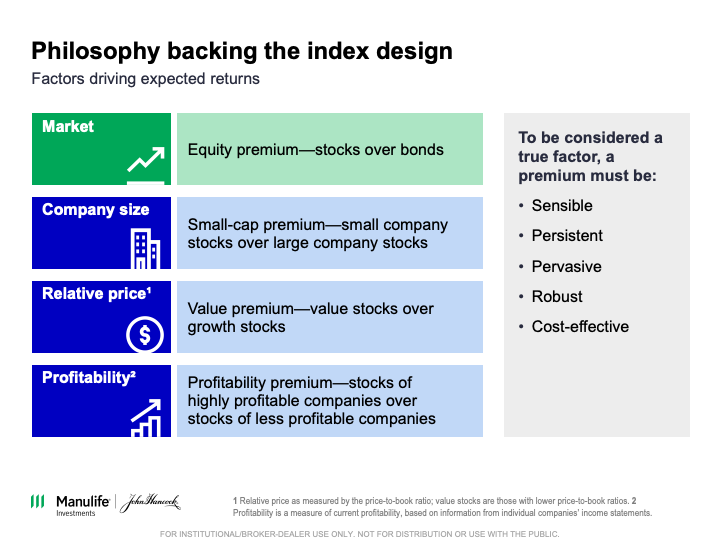
“The way we invest today is targeting smaller companies over larger companies, value companies over growth companies and higher-profitability companies over lower-profitability companies,” he explains. “And that’s because the empirical data that we’ve seen and the academic researchers have looked at over decades has shown that there are those areas of the market where we can expect and have seen higher returns over long periods of time across different markets, even across asset classes within market.”
Factor premiums have not appeared every year, however, and portfolios tilted toward them can trail the broader market for extended periods. Mid-cap stocks can also experience sharper price swings than their large-cap counterparts.
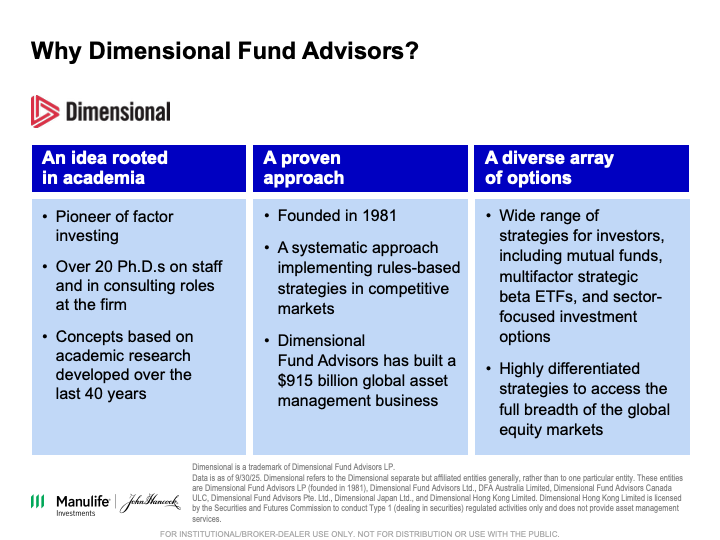
When the opportunity came to package the approach for Manulife John Hancock, the team leaned on hands-on trading experience as much as academic theory. “We were able to draw on all that academic heritage and research, and then also just our expertise managing factor funds and then also managing things like small-cap portfolios, micro-cap portfolios, and the lessons learned in managing those types of funds,” Marrkand says. “So, you’re getting the best of what Dimensional has to offer in these multifactor ETFs.”
Defining and Weighting the Mid-Cap Universe
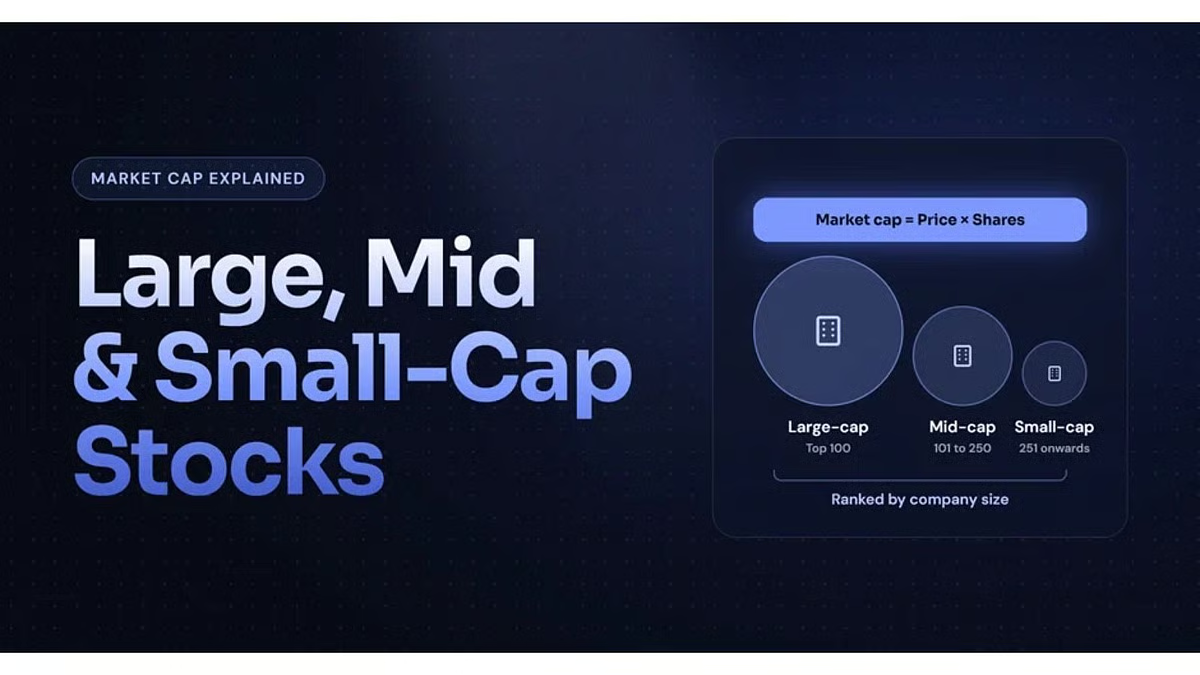
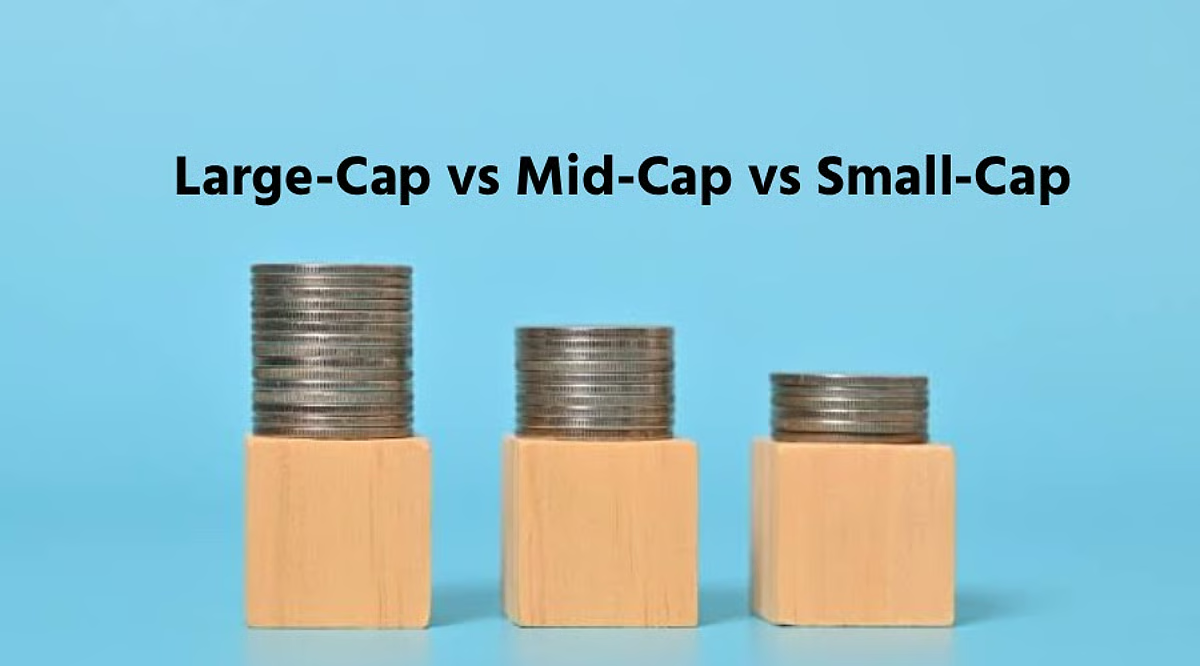
Portfolio construction begins by ranking every U.S. stock by market capitalization and carving out a target band. “We start with the 301st largest security and we go all the way down to the 900th largest security,” Marrkand explains. “So that 301st to 900th name is our target mid-cap space that we are going to own in this portfolio.”
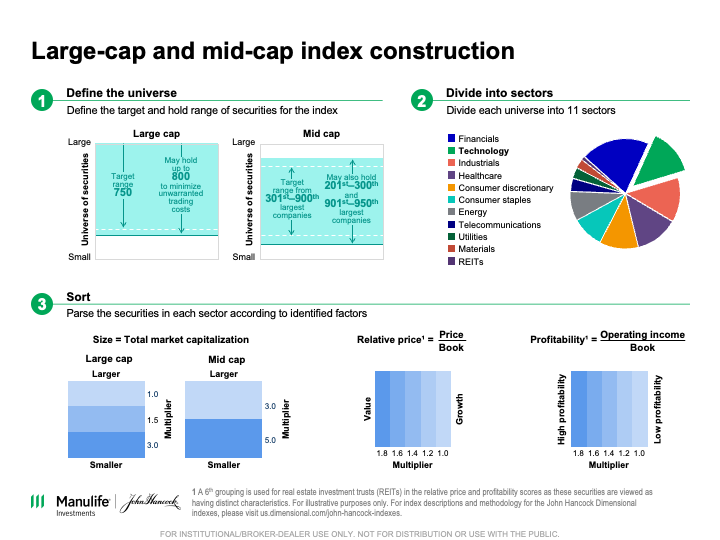
Each company in the band is then scored on size, price-to-book, and profitability, with the value and profitability rankings drawn only among companies in the same line of business. “So that way we’re able to compare a financial security to another financial security, for example, a technology security to another technology security,” he continues. “And in doing so, we’re able to make a portfolio with sector weights that looks a lot like the market because we’re not here to take idiosyncratic bets on different sectors.”
Every security lands in one of five buckets for each of the three characteristics, and its placement determines a multiplier applied to its market-cap weight. No company in the band gets dropped in the process; the multipliers simply shift emphasis toward the highest-scoring names, and Marrkand reaches for an item from the freezer to show how. “If you think of an ice cube tray with water in it and you tilt it, we’re just tilting towards different areas of the market where the water’s moving to, which by design takes some water away from other areas of the market,” he adds. “So, we’re overweighting those smaller value, higher-profitability securities and then underweighting those larger growthier lower-profitability securities.”
As of the most recent quarter end, the fund’s weighted-average market cap and price-to-book ratio both sit below those of its broad-based index, with industrials, information technology, and financials representing the largest sector allocations.
Index Memory and the Cost of Turnover
Owning the benchmark gives Dimensional’s team control over how and when the portfolio changes. “JHMM is an index-tracking ETF, but I think what’s different about it is it’s not tracking a commercial index like the Russell Midcap, for example,” Marrkand says. “It’s tracking a John Hancock Dimensional-owned index that we maintain and created.”
The index is reconstituted each March and September. Because heavy trading can erode returns, the team designed a set of rebalancing rules called Index Memory®, built on three pillars. The first creates buffer zones on either side of the target band. “From the 201st to the 300th name on the top and then the 901st to the 950th name on the bottom, we consider a hold range,” explains Marrkand. “So, if a security moves into one of those ranges on the top or the bottom, it still looks and feels a lot like a mid-cap security. So, we don’t just immediately kick it out of the index. We’ll keep it in the index. We just won’t add any extra weight to it.”
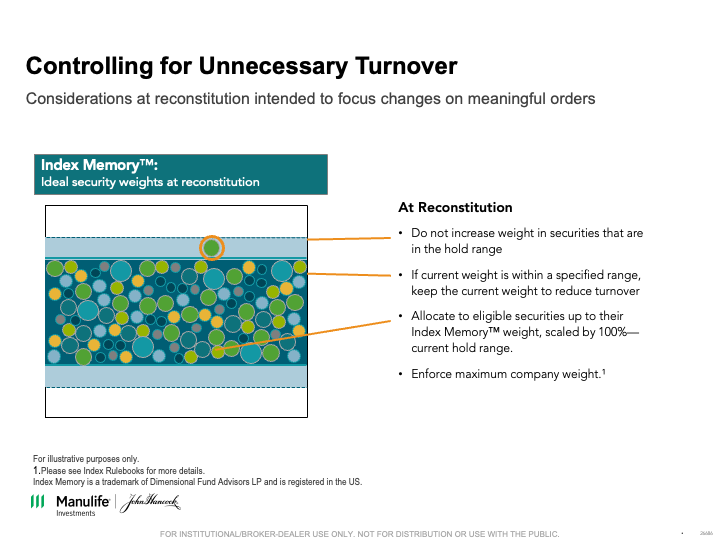
The second pillar accounts for momentum without paying the steep trading bill a pure momentum strategy can require. At each rebalance, the team reviews trailing returns and holds back on the weakest performers. “We just won’t add any weight to them because our expectation is if they’re a low-momentum security, they’ll continue to fall in price, at least in the short term relative to the rest of the market,” Marrkand notes.
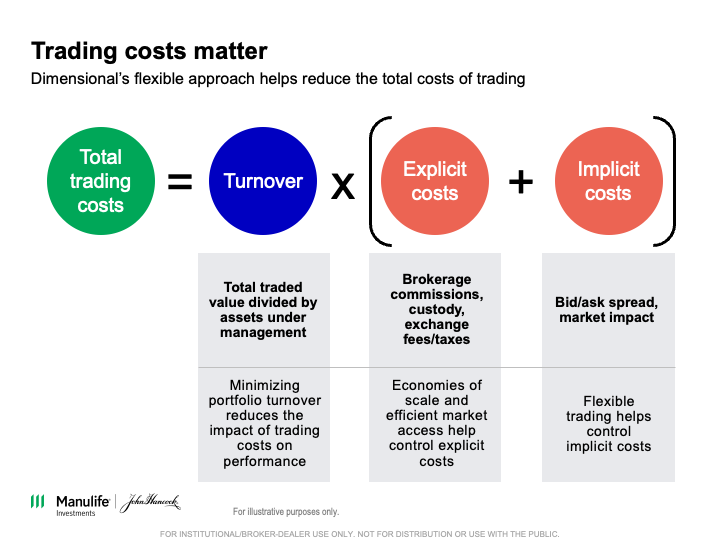
The third pillar skips minor weight increases the rebalancing math would otherwise call for. “We’ll just step away from the table and just not add any weight to it,” he adds. “So those three things combine our idea of Index Memory and they reduce turnover significantly for the fund, save on trading costs and still maintain those size value profitability exposures.”
A custom benchmark does not mean ignoring the broader mid-cap market. Sector allocations stay close to neutral, the hold ranges keep borderline names on the books, and holdings number in the hundreds. “We do want to give clients a market-like experience in this portfolio,” Marrkand says. “So, we’re not putting our heads in the sand necessarily, but we did construct our index from scratch.”
Three Paths to Adoption
JHMM has grown into a relatively large fund in the mid-cap space, and Marrkand identifies three groups of investors driving its adoption. The first holds conventional passive mid-cap ETFs and wants more from the allocation. “JHMM is a perfect product for them because we give them that index-like experience while capturing those size value profitability premiums or the opportunity to capture them when they materialize,” he says.
A second group arrives from concentrated, fundamentally driven active mid-cap strategies. “They have grown to like the idea of just getting more of a market-like return, which you can get with JHMM while also getting exposure to those three factors that we talked about,” Marrkand notes.
The third group has tried rotating among factors year to year, shifting assets toward whichever one appears poised to lead. “With JHMM, since it is a multifactor product and we’re giving you exposure to all three of those factors, you don’t have to figure out how to time those factors because it’s really difficult,” he continues. “You get exposure to size, value, profitability, and you just don’t have to worry about, ‘Is this the year for value or not,’ because we’re giving you that exposure along with size and profitability as well. So, I think clients who previously tried to time factors, this has been a great product for them as well.”
Additional Resources
Disclosures
Diversification does not guarantee a profit or eliminate the risk of a loss.
Index Memory® is a registered trademark of Dimensional Fund Advisors LP.
The John Hancock Dimensional Mid Cap Index is a rules-based index of mid-cap U.S. stocks that have been selected based on sources of expected returns. Securities eligible for inclusion in the index are classified according to their market capitalization, as defined by free-float market cap; relative price, as defined by price/book; and profitability, as defined by operating income over book, and are weighted accordingly in favor of smaller, less expensive, more profitable companies. The index is reconstituted and rebalanced on a semiannual basis. Index performance assumes reinvestment of dividends and, unless otherwise indicated, does not reflect the management fees, operating expenses, transaction costs, and other expenses that apply to an ETF. Past performance does not guarantee future results. The Russell Midcap Index tracks the performance of approximately 800 publicly traded mid-cap companies in the United States. It is not possible to invest directly in an index. The index shown demonstrates how the fund’s performance compares against the returns of similar investments, which may differ from the broad-based securities index shown in the fund’s prospectus.
Dimensional Fund Advisors LP receives compensation from John Hancock in connection with licensing rights to the John Hancock Dimensional indexes. Neither John Hancock Investment Management LLC nor Dimensional Fund Advisors LP guarantees the accuracy and/or completeness of an index (each an underlying index) or any data included therein, and neither John Hancock Investment Management LLC nor Dimensional Fund Advisors LP shall have any liability for any errors, omissions, or interruptions therein. Neither John Hancock Investment Management LLC nor Dimensional Fund Advisors LP makes any warranty, express or implied, as to results to be obtained by a fund, owners of the shares of a fund, or any other person or entity from the use of an underlying index, trading based on an underlying index, or any data included therein, either in connection with a fund or for any other use. Neither John Hancock Investment Management LLC nor Dimensional Fund Advisors LP makes any express or implied warranties, and expressly disclaims all warranties, of merchantability or fitness for a particular purpose or use with respect to an underlying index or any data included therein. Without limiting any of the foregoing, in no event shall either John Hancock Investment Management LLC or Dimensional Fund Advisors LP have any liability for any special, punitive, direct, indirect, or consequential damages, including lost profits, arising out of matters relating to the use of an underlying index, even if notified of the possibility of such damages.
For index descriptions and methodology for the John Hancock Dimensional indexes, please visit us.dimensional.com/john-hancock-indexes.
Professor Kenneth R. French, mba.tuck.dartmouth.edu/pages/faculty/ken.french/data_library.html, 2022. Professor French’s study on premiums examines the most reliable emerging-market long-term data available, which dates back to 1989 for market, company size, and relative price and 1991 for profitability metrics. This data does not portray results of indexes. Drs. Fama and French are directors of, and provide consulting services to, Dimensional Fund Advisors LP.
Investing involves risks, including the potential loss of principal. There is no guarantee that a fund’s investment strategy will be successful. The stock prices of midsize and small companies can change more frequently and dramatically than those of large companies, and value stocks may decline in price. Shares may trade at a premium or discount to their NAV in the secondary market, and a fund’s holdings and returns may deviate from those of its index. These variations may be greater when markets are volatile or subject to unusual conditions. Errors in the construction or calculation of a fund’s index may occur from time to time. Please see the fund’s prospectus for additional risks.
Clients should read and carefully consider a fund’s investment objectives, risks, charges, and expenses before investing. To request a prospectus or summary prospectus with this and other important information, call us at 800-225-6020, or visit us at jhinvestments.com/etf.
John Hancock ETFs are distributed by Foreside Fund Services, LLC in the United States, and are subadvised by Boston Partners, Dimensional Fund Advisors LP, Marathon Asset Management, or our affiliates Manulife Investment Management (US) LLC, and CQS (US), LLC. Foreside is not affiliated with John Hancock Investment Management Distributors LLC, Manulife Investment Management (US) LLC, CQS (US), LLC, Boston Partners, Dimensional Fund Advisors LP, or Marathon Asset Management.
NOT FDIC INSURED. MAY LOSE VALUE. NO BANK GUARANTEE. NOT INSURED BY ANY GOVERNMENT AGENCY.
THIS MATERIAL IS FOR INSTITUTIONAL/BROKER-DEALER USE ONLY. NOT FOR DISTRIBUTION OR USE WITH THE PUBLIC.
JHS-995997-2026-09-03 10/26