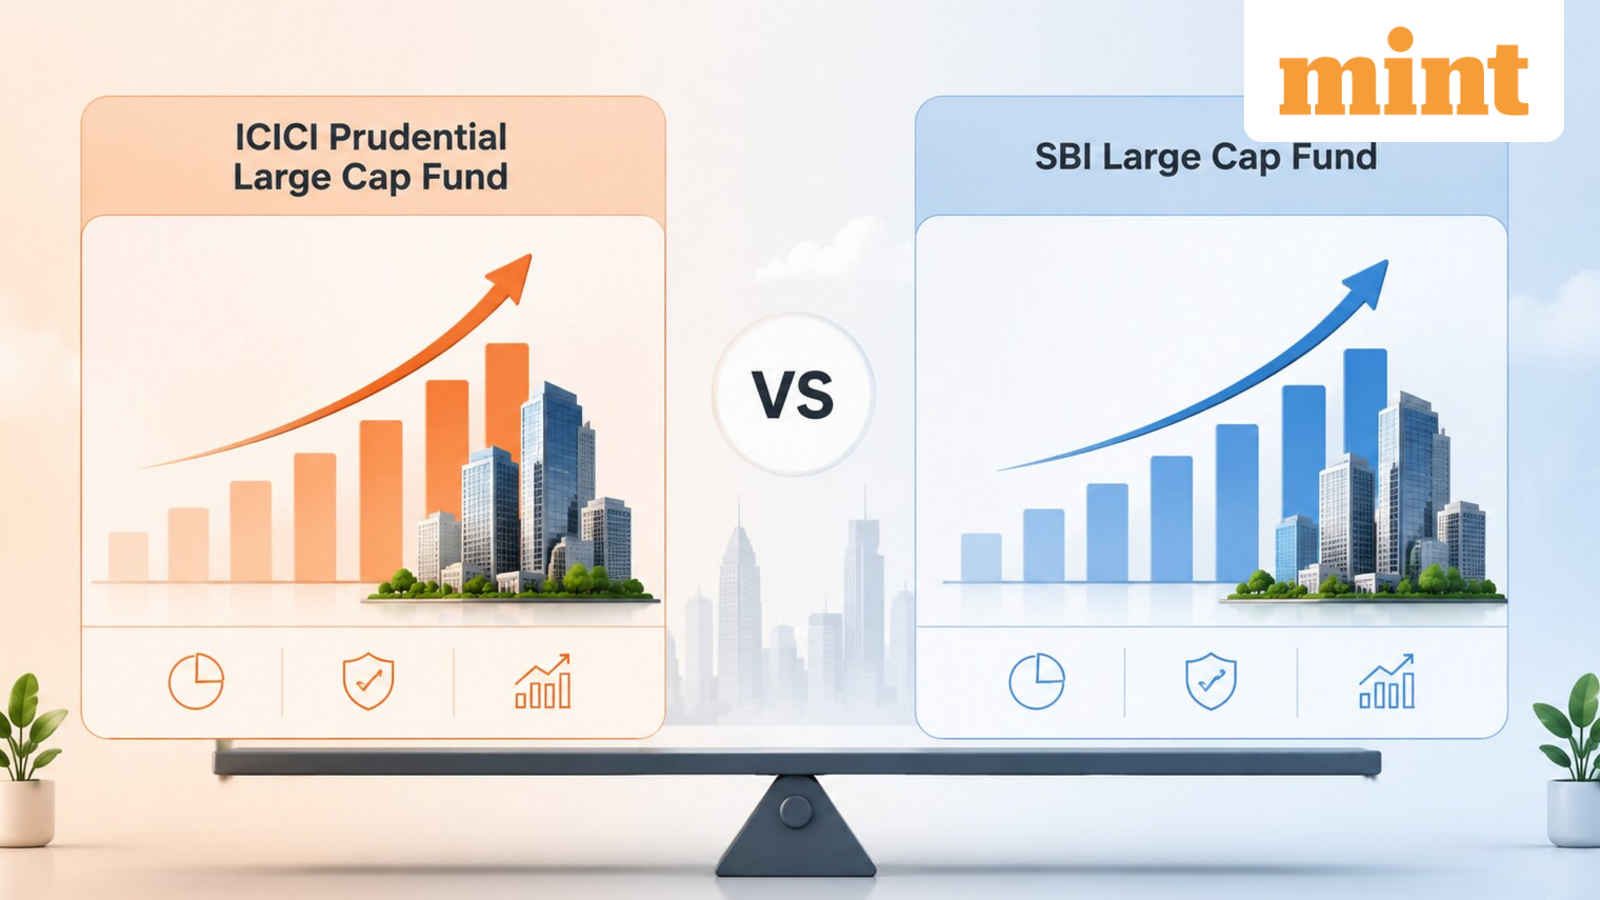

A good year can make almost any equity category look comfortable. That is partly why recent performance can be such a tempting place to begin when choosing a mutual fund. If one category has climbed faster than another, the obvious instinct is to pay attention to the one in front. The trouble is that the same comparison may look quite different a year or two later.
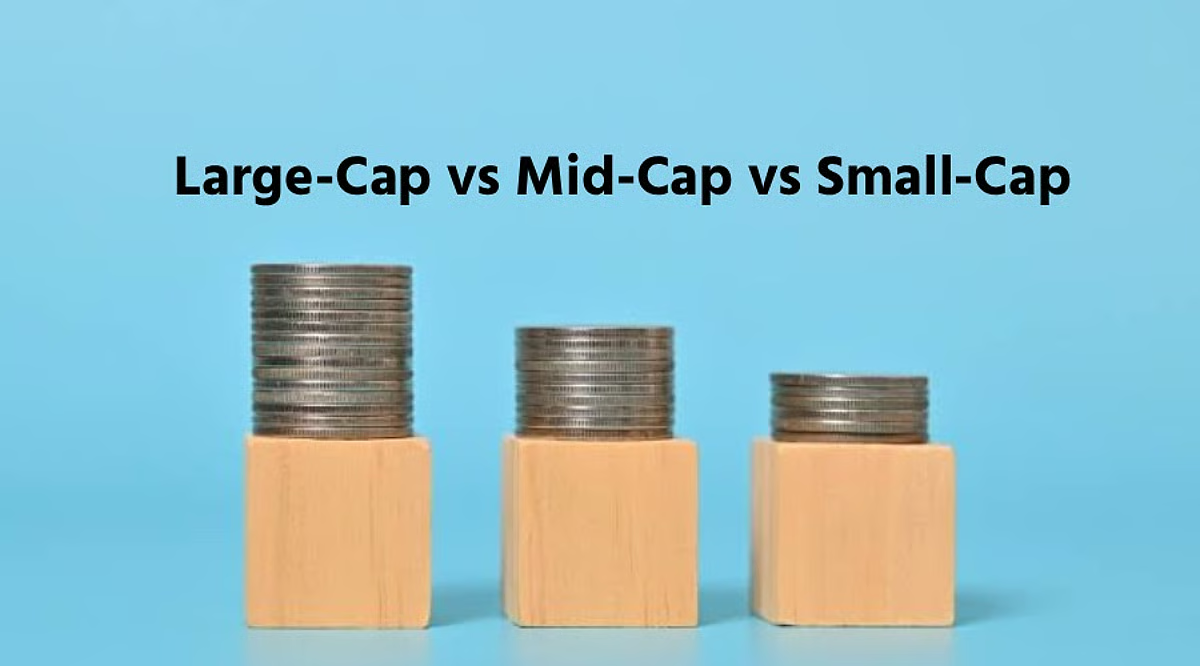
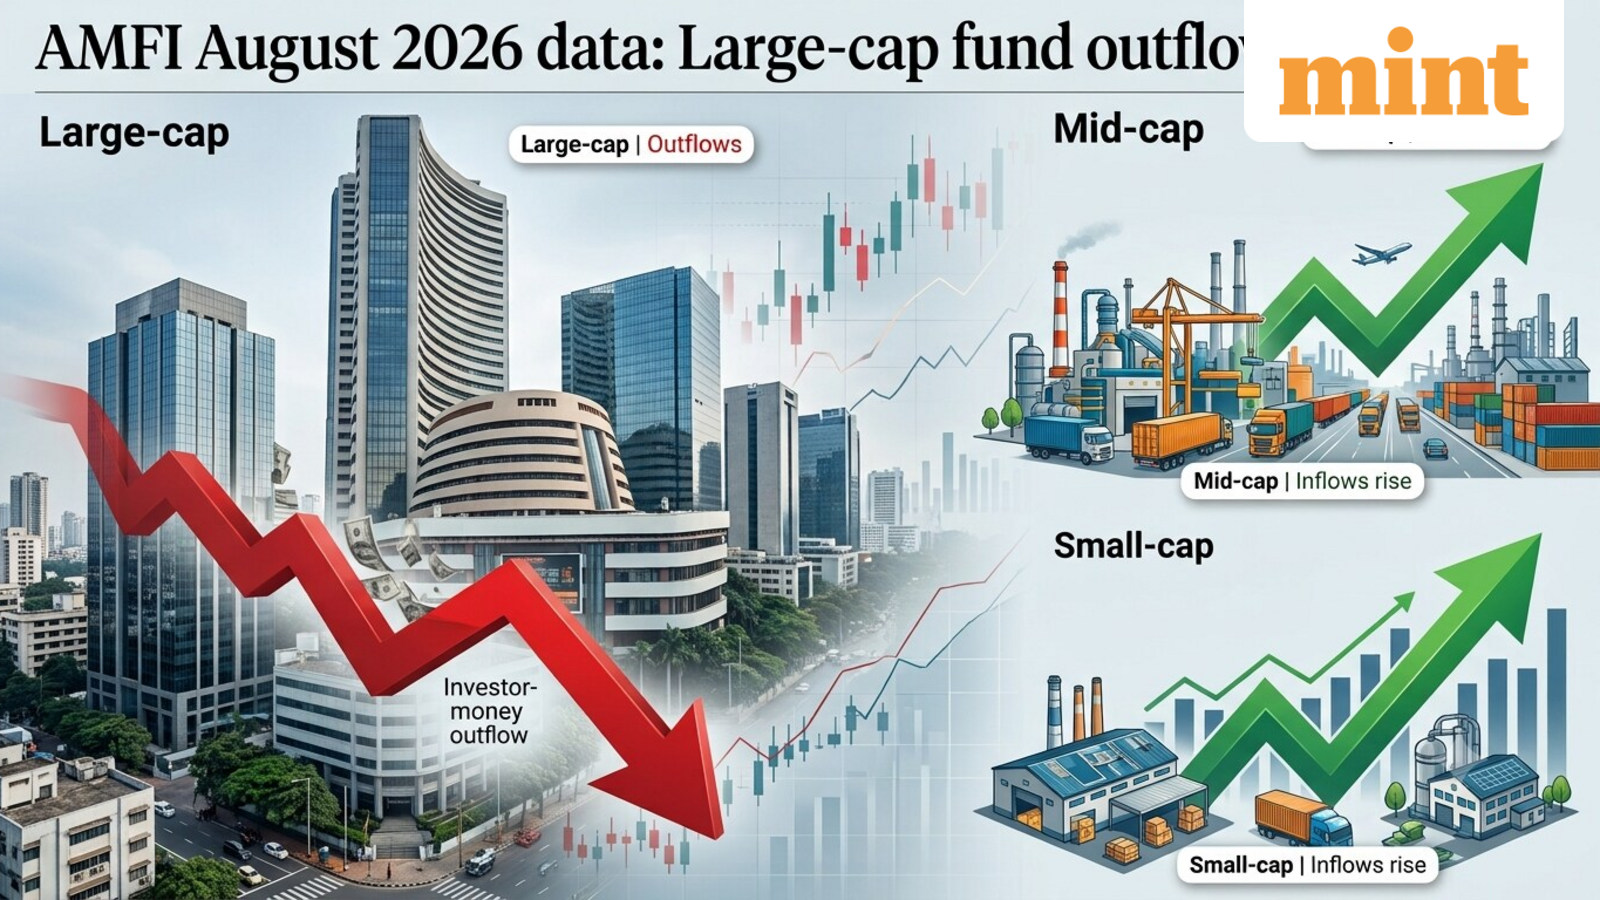
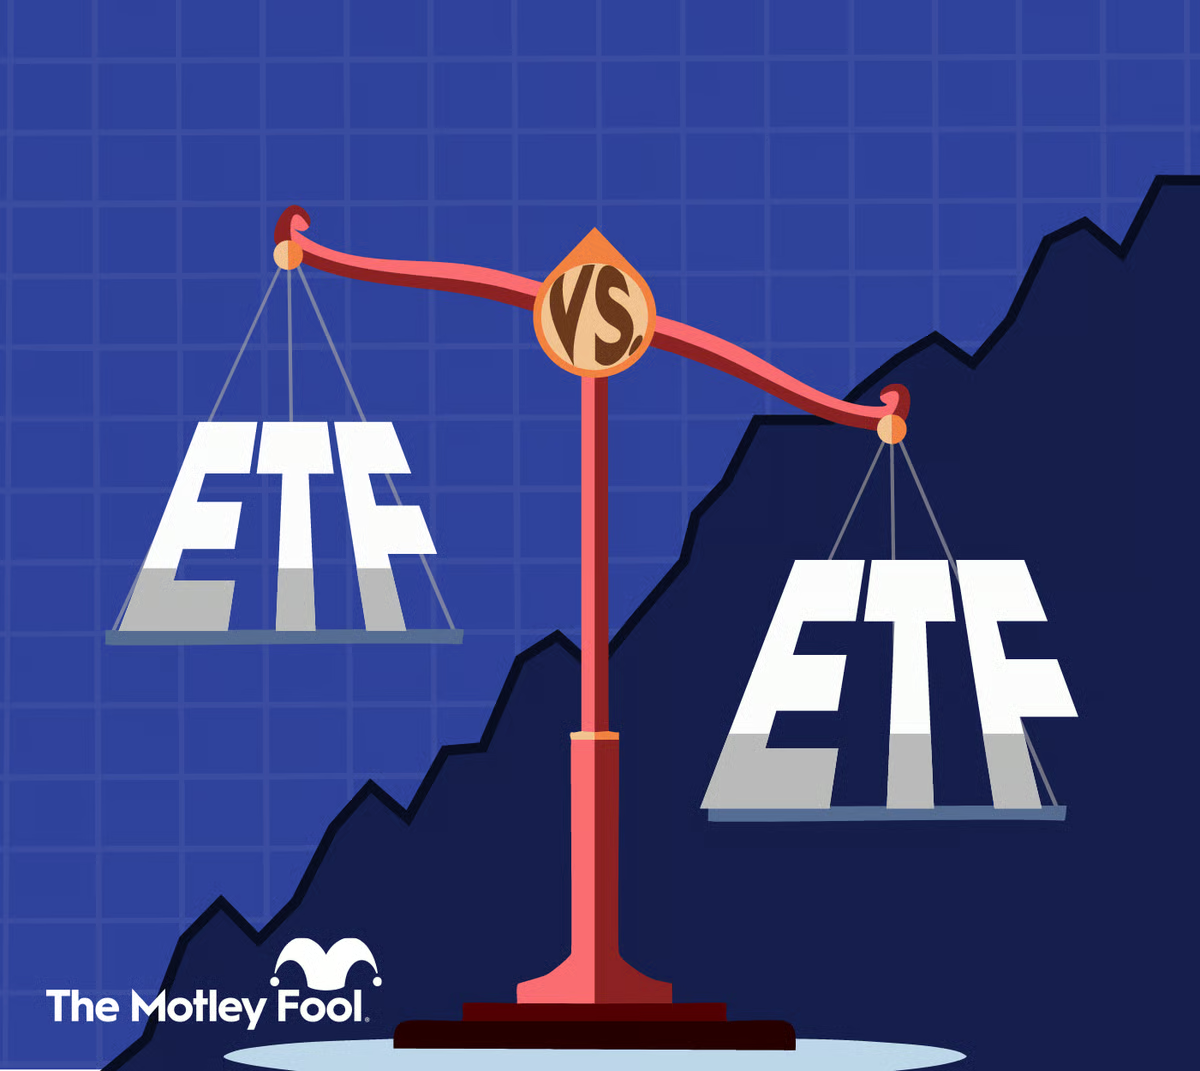
Large-cap and small-cap funds make this especially visible. They are both equity funds, but they do not fish in the same part of the market.
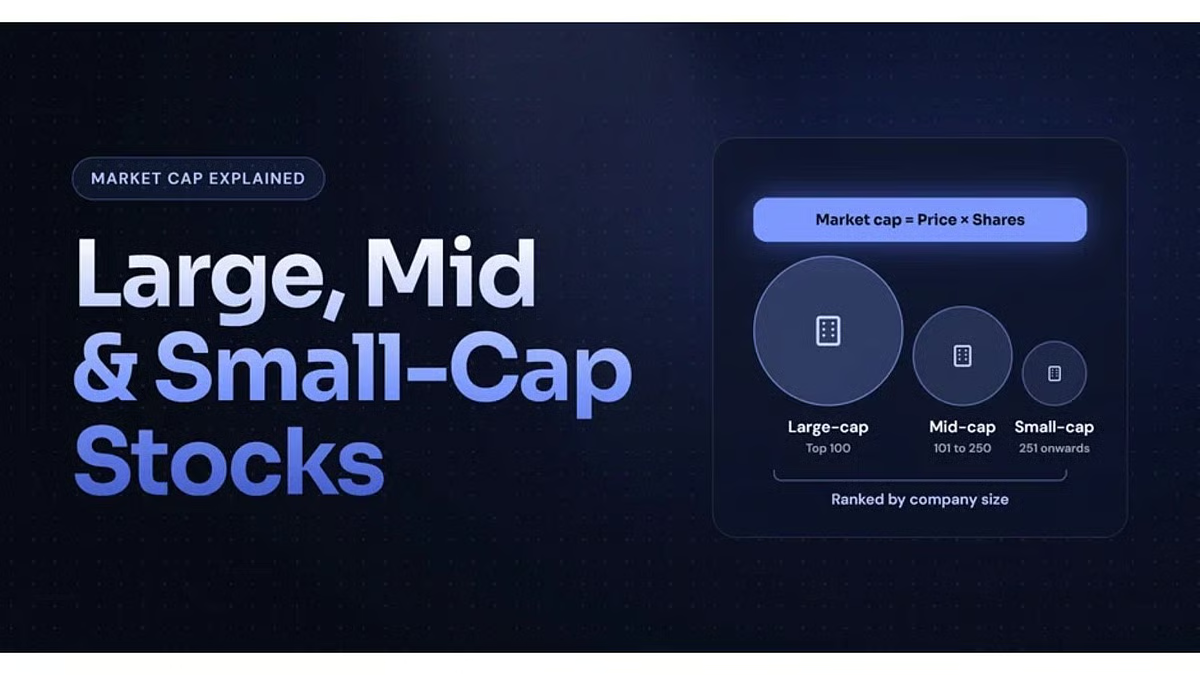
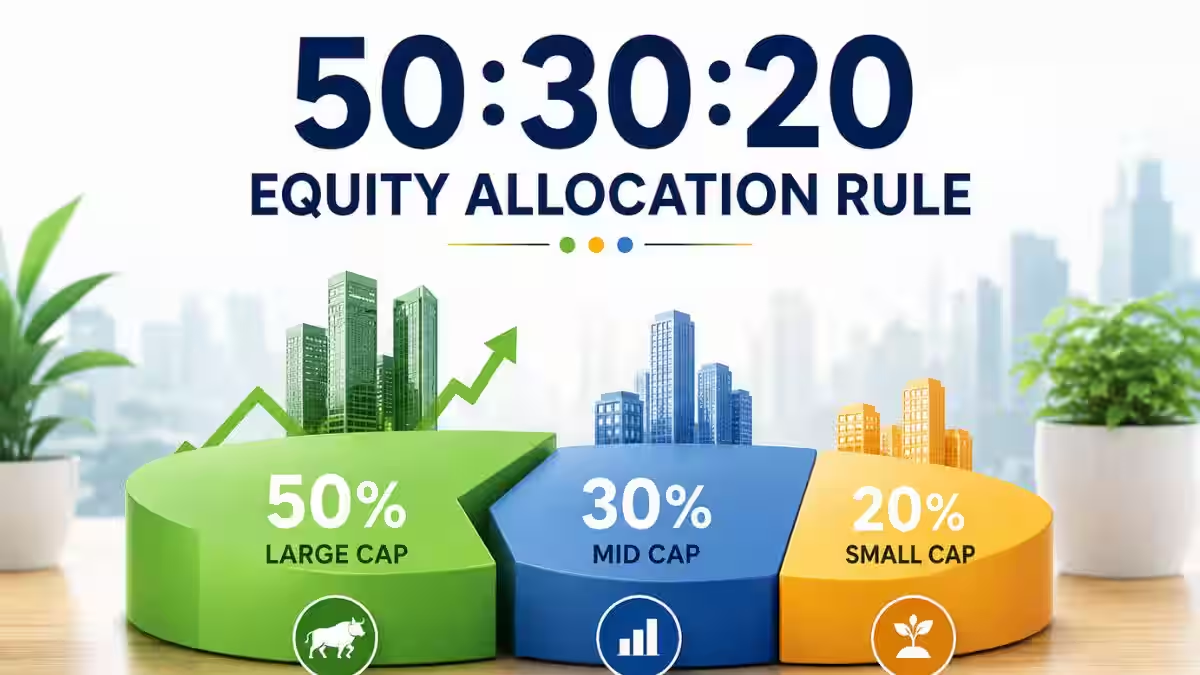
The formal boundary is based on market capitalisation. Under SEBI’s mutual fund categorisation framework, the first 100 companies by full market capitalisation are large caps, companies ranked 101st to 250th are mid caps and those ranked 251st onwards are small caps. AMFI publishes the stock categorisation used for this purpose. That tells an investor where the dividing line sits, however, it does not settle the investment decision.
Recent returns tell only one part of the story
Suppose an investor is looking at a large cap fund and a small cap fund after a particularly strong period for smaller companies. The performance gap is immediately visible. What is less visible is everything that happened on the way to those numbers.
Returns do not arrive evenly. Smaller-company shares can move sharply when enthusiasm is high, but they can also lose ground quickly when investors become cautious. Liquidity can become relevant during difficult periods too. Large-company shares are generally more widely traded, although their prices remain exposed to company-specific developments and wider market falls.
This is not a case of one category carrying risk and the other avoiding it. Both put money into equities.
The more revealing exercise may be to look beyond the final return and examine the uncomfortable stretches in between. An investor who finds large swings difficult to tolerate may discover that a promising long-term plan feels very different once actual money is involved.
Time on paper is not always time in practice
An investor may intend to leave money untouched for eight or ten years. Then life intervenes. A house purchase happens earlier than expected, or the income changes, maybe a financial goal moves closer? Sometimes an investor just realises that the original appetite for market fluctuations was overestimated.
Money with a genuinely long runway can usually accommodate a different kind of investment decision from money that may be needed sooner. This becomes particularly relevant when considering areas of the equity market capable of pronounced short-term movement.
The point is not that a particular number of years automatically makes a small-cap investment suitable. It does not. Time horizon has to sit alongside the investor’s financial circumstances and willingness to remain invested through difficult markets.
The rest of the portfolio changes the question
There is another reason a simple large-versus-small comparison can be unhelpful: very few investment decisions exist on their own.
Consider an investor who already owns an equity scheme spread across different market-cap segments. Adding another fund could increase exposure to companies that are already well represented. Someone else’s existing investments may look completely different. Looking inside the portfolio therefore matters.
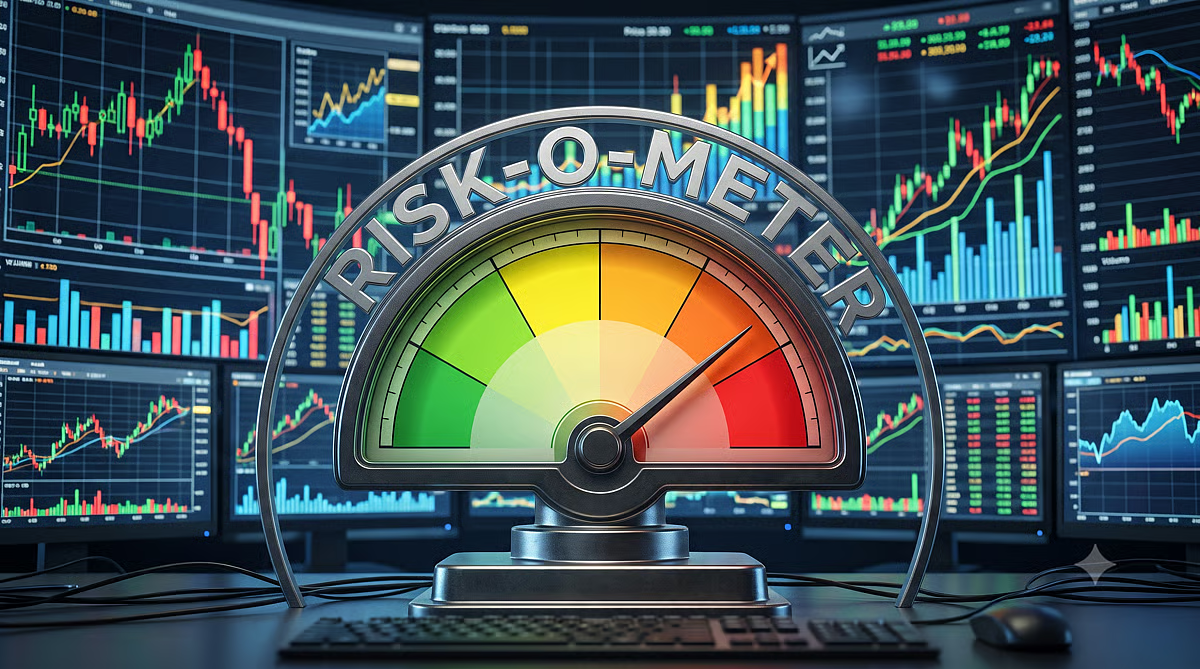
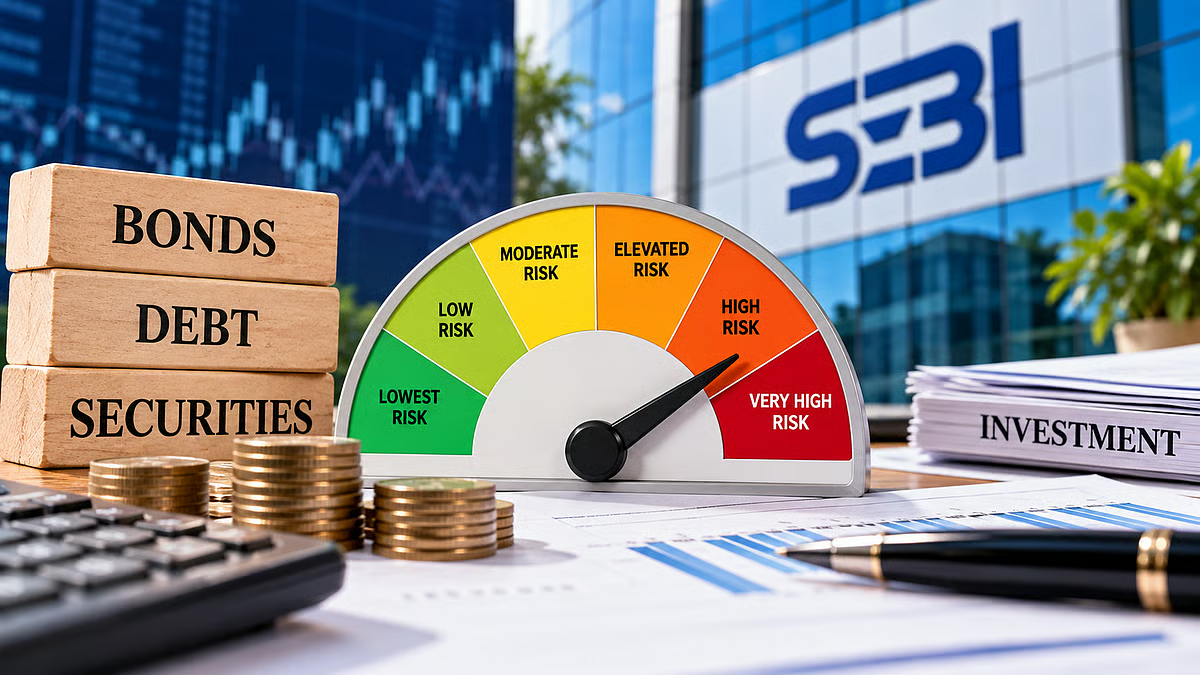
The scheme’s investment objective, portfolio disclosures and Riskometer can say more about the exposure being added than its recent ranking on a returns table. SEBI’s revised 2026 categorisation is intended to keep mutual fund categories and their characteristics clearly defined and true to label.
This is also where a balanced fund should not be confused with a halfway point between large and small caps. Hybrid schemes mix asset classes. SEBI’s current framework describes hybrid schemes as investing across a mix that can include equity, debt, InvITs and permitted commodity-related instruments. A move from large-cap to small-cap exposure remains a decision within equities; adding a hybrid fund changes the mix of assets itself.
And what about the SIP amount?
Once the investment itself has been considered, the monthly contribution is a separate decision.
A SIP calculator can be useful here because an investor can experiment with an amount, an assumed rate of return and a period to see how the illustration changes. It is planning arithmetic, not a preview of the market.
That distinction is particularly important when comparing equity categories. An assumed percentage entered into a calculator cannot capture future market cycles or tell an investor what a large-cap or small-cap fund will earn.
Choosing between the two does not have to begin with a hunt for the category capable of producing the larger number. There are more ordinary questions to answer first. When might this money be needed? What is already in the portfolio? How would the investor respond if the investment went through a prolonged weak spell?
Those answers are less exciting than a performance table. They are also much harder to borrow from somebody else’s portfolio.
Mutual fund investments are subject to market risks, read all scheme related documents carefully.
Note to the Reader: This article has been produced on behalf of the brand by HT Brand Studio and does not have journalistic/editorial involvement of Mint. The content may be for information and awareness purposes and does not constitute any financial advice.
This is an investor education and awareness initiative. All Mutual Fund investors have to go through a one-time KYC (know your Customer) process. Investors should deal only with registered mutual funds, to be verified on SEBI website under ‘Intermediaries/ Market Infrastructure Institutions’. For redressal of your complaints, you may please visit SEBI SCORES. This is an investor education and awareness initiative by Nippon India Mutual Fund.
The information herein is meant only for general reading purposes and the views being expressed only constitute opinions and therefore cannot be considered as guidelines, recommendations or as a professional guide for the readers. The document has been prepared on the basis of publicly available information, internally developed data and other sources believed to be reliable. The sponsor, the Investment Manager, the Trustee or any of their directors, employees, associates or representatives (“entities & their associates”) do not assume any responsibility for, or warrant the accuracy, completeness, adequacy and reliability of such information. Recipients of this information are advised to rely on their own analysis, interpretations & investigations. Readers are also advised to seek independent professional advice in order to arrive at an informed investment decision. Entities & their associates including persons involved in the preparation or issuance of this material shall not be liable in any way for any direct, indirect, special, incidental, consequential, punitive or exemplary damages, including on account of lost profits arising from the information contained in this material. Recipient alone shall be fully responsible for any decision taken on the basis of this document.