Peter Lynch is one of the best-known names in growth investing. His approach was simple. Look for companies that are growing well, but do not overpay for them. He believed investors should study the business, the numbers and the price together. A fast-growing company is not always attractive. It also has to be available at a reasonable valuation.
One of the tools often linked with Lynch is the PEG ratio. It compares a company’s price-to-earnings ratio with its profit growth. A lower PEG ratio can suggest that the stock is cheaper when measured against its growth rate. But the ratio needs context. A low PEG is useful only when the growth is real, steady and likely to continue.
After looking at mid-cap companies with strong capital efficiency, this article turns to Peter Lynch’s PEG ratio to find businesses where growth still appears reasonably priced. The aim is not to find the cheapest stocks on headline numbers alone. The focus is on companies where growth, valuation and balance sheet strength move in the same direction.
Inside the Peter Lynch Screen: Quantitative Filters
For the first screen, we used companies with a market capitalisation of more than Rs 5,000 crore and less than Rs 20,000 crore. We kept only companies with a positive price-to-earnings ratio. We also looked for three-year profit growth of more than 15% and three-year sales growth of more than 10%. Debt-to-equity was kept below 1. Return on equity had to be above 15%. Latest profit growth also had to be positive. Finally, we used a PEG-style filter by keeping companies where price-to-earnings divided by three-year profit growth was below 1.5.
This screen gave 68 candidates. We then added another layer of checks. We did not simply pick the three stocks with the lowest PEG ratio. Very low PEG numbers can sometimes come from a weak base year or a one-off profit jump. So we looked for cleaner growth. We preferred companies where the PEG ratio was reasonable, but not unusually low.
We checked whether profit growth was supported by sales growth. We also looked at the latest quarterly numbers to see if both sales and profit were still growing. Finally, we considered capital efficiency by looking for return on capital employed above 18%. After these checks, only 13 companies remained. From that shortlist, the final three names were selected based on growth consistency, valuation comfort and capital efficiency.
#1 Sky Gold & Diamonds: Converting a 112% Profit Surge Into a Net-Debt Free Balance Sheet by FY30
Sky Gold & Diamonds is engaged in the business of designing, manufacturing, and marketing gold jewellery. The company follows a B2B model where the products are mainly sold to mid-range jewellers and boutique stores who sell these products through online platforms and retail stores.
Sky Gold & Diamonds reported a strong March quarter, helped by its B2B jewellery manufacturing model and wedding-season demand. For FY26, revenue grew 77.4% year-on-year (YoY) to Rs 6,294.9 crore, while net profit rose 112.4% YoY to Rs 281.8 crore.
Capital Efficiency Optimization: Reducing Working Capital Cycle to 59 Days via B2B Transition
Growth was supported by higher production volumes, deeper relationships with organised jewellery retailers and a shift towards lightweight and studded jewellery. Management said the company benefited from festive demand around Gudi Padwa and Akshaya Tritiya. It also highlighted partnerships with large retail chains such as Reliance Jewels, CaratLane, Malabar Gold, Kalyan Jewellers and Senco Gold.
The company is also working to improve the quality of growth. Its advanced gold business increased to 11.5% in FY26, from 5.7% in FY25. This model needs less working capital, as the company does not fund the full gold value in the same way as the traditional model. Working capital days reduced to 59 days in March 2026, from 71 days in March 2025.
Regional Concentration Mitigation: Scaling Export Footprint Beyond 12% to Secure Non-Festive Revenue
Sky Gold’s next phase is focused on three levers. It plans to increase wallet share with existing corporate clients, expand its distributor network and scale exports. Exports contributed around 12% of revenue, and management expects this share to move closer to 20% over time. The company is already present in markets such as Dubai, UAE, Singapore and Malaysia. It is also exploring the UK market through an exhibition in London.
Balance sheet discipline remains a key part of the strategy. Management said it plans to cut net debt by more than 50% in FY27, helped by land monetisation and operating improvements. It is also targeting a net debt-free balance sheet by FY30. Agencies have been appointed for the proposed land sale, with monetisation expected around August or September.
From a PEG-ratio lens, Sky Gold fits the screen because profit growth is backed by sales growth and recent quarterly momentum. Its RoCE stands at 27% and RoE at 29.2%, showing healthy capital efficiency. The stock trades at an EV/EBITDA of 18.8 times, above the industry median of 11.7 times. So the case is not based on a cheap sector multiple. It rests on whether earnings growth can continue to justify the premium.
The main risk is execution. Jewellery manufacturing is working-capital intensive. Gold price volatility can also affect reported revenue. Sky Gold is trying to reduce these risks through advanced gold, exports, lightweight jewellery and debt reduction. If these levers hold, the company may continue to fit the growth-at-reasonable-valuation theme. But investors will need to watch whether growth stays consistent beyond the festive and wedding-season boost.
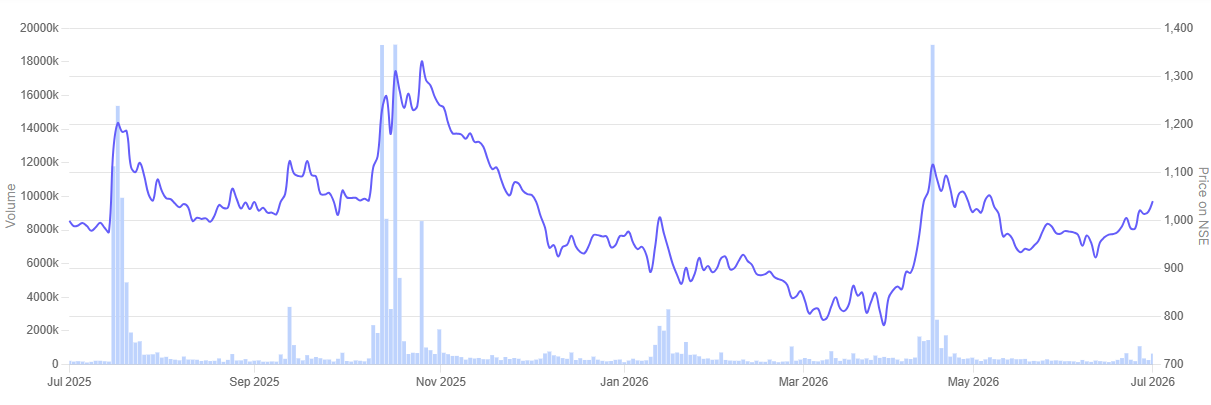
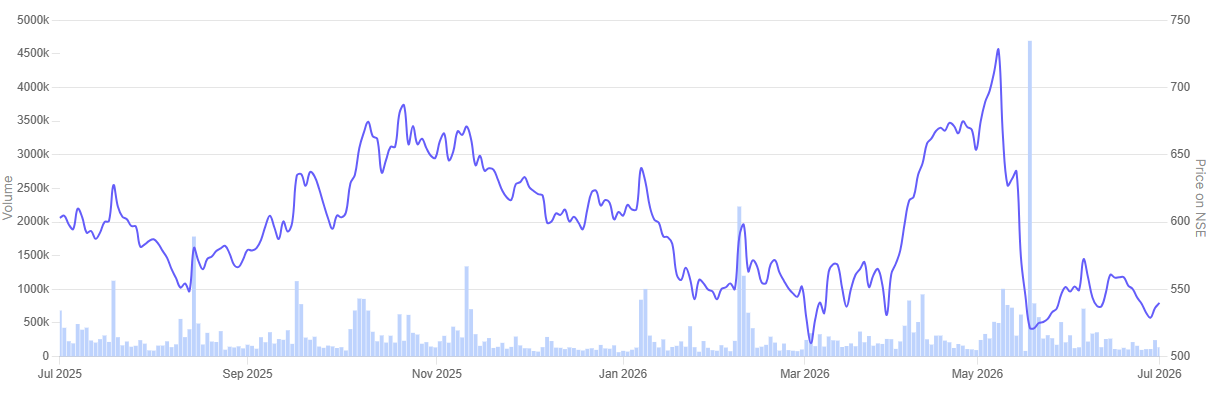
In the past year, the share price of Sky Gold & Diamonds rallied 68.3%.
Sky Gold & Diamonds 1 Year Share Price Chart

#2 Waaree Renewable Technologies: Leveraging an 85.4% RoCE to Execute a 2.83 GWp Solar EPC Order Book
Incorporated in 1999, Waaree Renewables Technologies is engaged in the business of generation of power through renewable energy sources and also provides consultancy services in this regard.
Waaree Renewable Technologies reported a sharp rise in Q4 FY26 earnings, helped by strong execution in solar EPC projects. For FY26, revenue increased 108.5% YoY to Rs 3,331.4 crore, while profit grew 109.1% YoY to Rs 478.6 crore.
Backlog Execution Visibility: Converting a 2.83 GWp Order Pipeline to Safeguard Operational Margins
The company’s growth was led by scale in project execution. Waaree Renewable executed 2,727 MWp of projects during FY26, its highest annual execution so far. Its unexecuted order book stood at 2.83 GWp at the end of the year. This gives the company revenue visibility for the coming quarters. Its O&M portfolio also stood at 1.18 GWp, adding a recurring revenue layer to the core EPC business.
Management said India’s solar market remains supported by policy push and capacity additions. Solar accounted for a large share of renewable installations in FY26. This has kept demand strong for EPC players. Waaree Renewable said it is also looking at opportunities in battery energy storage systems. The company is executing a smaller BESS project and expects this revenue stream to open up during FY27.
The order book is spread across key solar states such as Rajasthan, Gujarat, Madhya Pradesh, Andhra Pradesh and Maharashtra. Rajasthan remains a large contributor. Management said projects in the existing order book are not facing major evacuation-related hurdles, as EPC contracts are typically awarded after developers’ complete key checks on land and connectivity.
Operational Revenue Diversification: Building a 54 MWp IPP Portfolio for Long-Term Cash Generation
Waaree Renewable is also building a limited independent power producer portfolio. It currently has around 54 MWp of operational IPP assets. Another 227 MWp is under development. Management said these projects are being funded through internal accruals and are meant to provide steady revenue over the long term. However, EPC will remain the main business.
On global expansion, the company said it is not executing overseas EPC projects yet. But it is chasing an international pipeline. Management mentioned a total order pipeline of around 36 GW, including about 23 GW domestic and 12 GW international opportunities. Conversion will depend on customer discussions, margins and risk-reward fit.
From a PEG-ratio lens, Waaree Renewable fits the screen because profit growth has moved broadly in line with strong sales growth. The latest quarter also showed continued momentum, rather than a reversal in trend. The business has high capital efficiency, with RoCE at 85.4% and RoE at 69.1%. Its EV/EBITDA of 15.9 times is below the industry median of 18.5 times. This supports the PEG argument, as the stock is trading below the sector median despite strong earnings growth and high return ratios.
The main risk is execution and order conversion. Solar EPC is competitive. Margins can also move with project mix, especially where module supply is included. Still, Waaree Renewable enters FY27 with a large order book, expanding EPC capabilities and early steps in BESS. For investors, the key monitorable will be whether the company can convert its pipeline while maintaining margins and cash discipline.
In the past year, the share price of Waaree Renewable Technologies is up 4%.
Waaree Renewable Technologies 1 Year Share Price Chart
#3 P N Gadgil Jewellers: Translating an 86% Q4 SSSG Into a 78-Store Pan-India Retail Footprint
Established in 1832, P N Gadgil Jewellers is in the retail business of gold, silver, and diamond jewellery.
P N Gadgil Jewellers reported a strong March quarter, helped by wedding demand, festive buying and higher consumer interest in gold. For FY26, revenue increased 40% YoY to Rs 10,739 crore, crossing the Rs 10,000-crore mark for the first time. Profit rose 88% YoY to Rs 410 crore.
The quarter was supported by strong event-led sales. The company recorded sales of Rs 365 crore on Foundation Day. It also reported Rs 171 crore of sales during Gudi Padwa and Rs 225 crore through its Gratitude Day offer. Management said demand remained healthy across retail, franchise and e-commerce channels.
Network Footprint Aggression: Deploying 25 New Showrooms to Penetrate Non-Maharashtra Markets
Store expansion remained a key growth driver. P N Gadgil added 12 stores in Q4 FY26, including company-owned and franchise-operated formats. For the full year, it added 25 stores, taking the network to 78 stores across 36 cities as of March 2026. The company also entered new markets such as Uttar Pradesh, with stores in Gorakhpur and Banaras.
Retail remained the main business engine. Retail revenue grew 51% YoY to Rs 8,131 crore in FY26, helped by wedding and festival demand, improved product mix and new store contribution. Same-store sales growth stood at 43% for FY26 and 86% in Q4 FY26. Franchise revenue rose 83% YoY to Rs 1,292 crore, while e-commerce revenue grew 105% YoY to Rs 529 crore.
Product Mix Stabilization: Rebalancing Studded Jewellery Ratios to Counter 40% Bullion Margin Compression
Margins, however, came under pressure in the March quarter. Management said this was mainly due to a higher share of gold bars and coins, lower studded jewellery mix and trade discounts during promotional events. Gold bars and coins increased to 40% of Q4 revenue, from 28% a year earlier. The company said this was a temporary shift towards gold as an investment, rather than a structural weakness in jewellery demand.
For FY27, management guided for revenue of Rs 13,500 crore, EBITDA margin of 7% to 7.5% and PAT margin of 4%. Expansion will remain focused outside Maharashtra. The company plans around 25 stores, with five to seven company-owned stores and the balance through the franchise model. Target markets include Uttar Pradesh, Bihar, Madhya Pradesh, Gujarat and Gurgaon.
From a PEG-ratio lens, P N Gadgil fits the screen because profit growth has come with strong revenue growth and store-led expansion. Its RoCE stands at 20.9% and RoE at 23.4%, showing reasonable capital efficiency. The stock trades at an EV/EBITDA of 12.2 times, slightly above the industry median of 11.7 times. So the valuation is not deeply cheap. The PEG case depends on whether the company can sustain earnings growth as new stores mature.
The key risk is margin volatility. High gold prices can lift revenue, but they can also push customers towards lower-margin bars and coins. Expansion outside Maharashtra also needs careful execution. Still, P N Gadgil enters FY27 with a larger store base, stronger regional reach and healthy recent growth. Investors will need to watch whether this growth remains broad-based beyond the festive quarter.
In the past year, the share price of P N Gadgil is down 10%.
P N Gadgil 1 Year Share Price Chart
Conclusion
The PEG ratio is only a starting point. It helps investors see whether a stock’s price makes sense when compared with its growth. This is useful in mid-cap stocks, where growth can be fast, but valuations can also move quickly.
Still, investors need to be careful. A low PEG ratio does not always mean a stock is cheap. Sometimes, growth looks high only because the base year was weak. In some cases, margins may not stay at the same level. In others, working capital or execution may become a challenge.
That is why the latest quarter matters. Return ratios matter too. A company should not only grow fast. It should also show that growth through better profits, healthy returns and clear execution.
You can track how these are progressing by adding stocks to your watchlist.
Disclaimer:
Note: We have relied on data from www.Screener.in throughout this article. Only in cases where the data was not available, have we used an alternate, but widely used and accepted source of information.
The purpose of this article is only to share interesting charts, data points and thought-provoking opinions. It is NOT a recommendation. If you wish to consider an investment, you are strongly advised to consult your advisor. This article is strictly for educative purposes only.
Ekta Sonecha Desai has a passion for writing and a deep interest in the equity markets. Combined with an analytical approach, she likes to deep dive into the world of companies, studying their performance, and uncovering insights that bring value to her readers.
Disclosure: The writer and her dependents do not hold the stocks discussed in this article.
The website managers, its employee(s), and contributors/writers/authors of articles have or may have an outstanding buy or sell position or holding in the securities, options on securities or other related investments of issuers and/or companies discussed therein. The content of the articles and the interpretation of data are solely the personal views of the contributors/ writers/authors. Investors must make their own investment decisions based on their specific objectives, resources and only after consulting such independent advisors as may be necessary.