Find winning stocks in any market cycle. Join 7 million investors using Simply Wall St’s investing ideas for FREE.
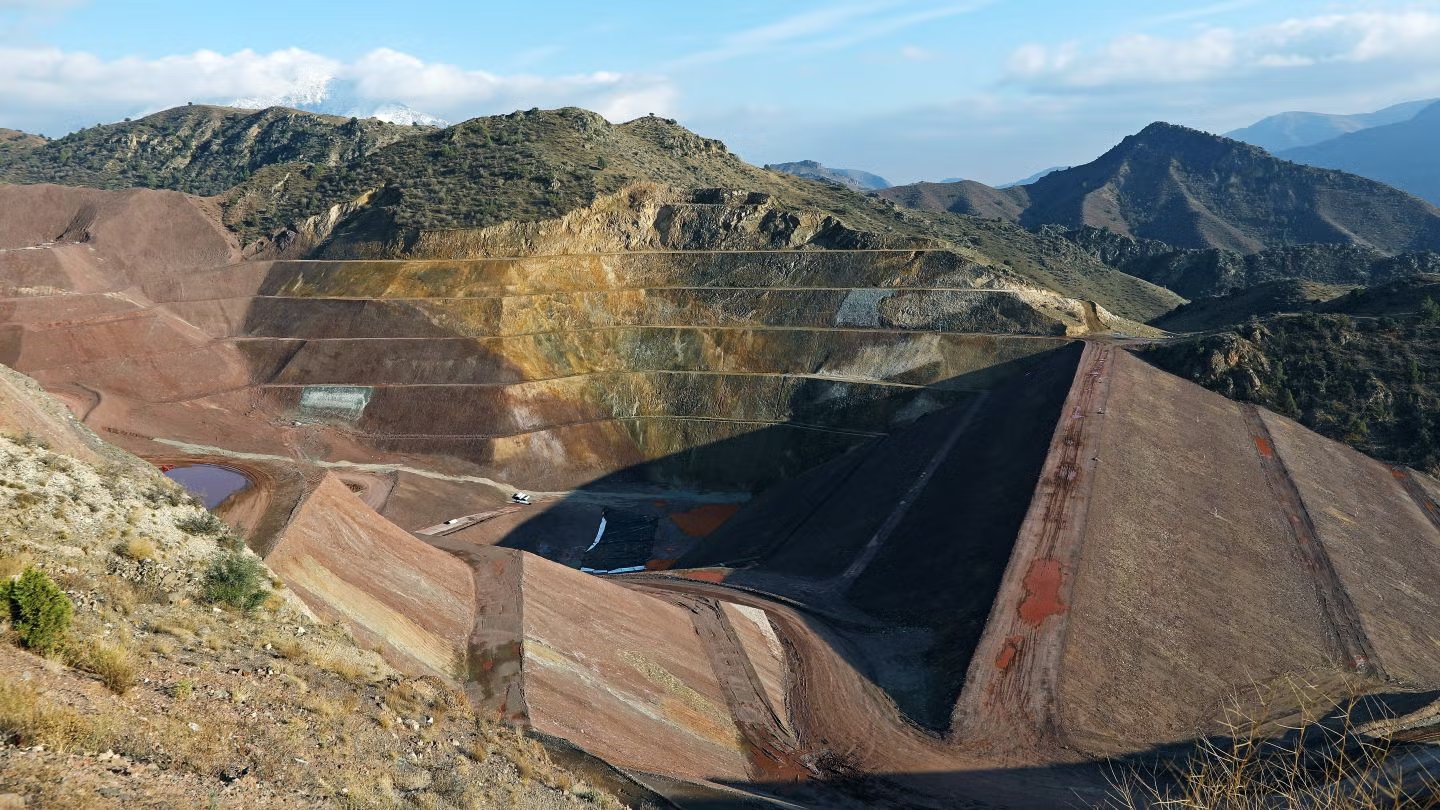
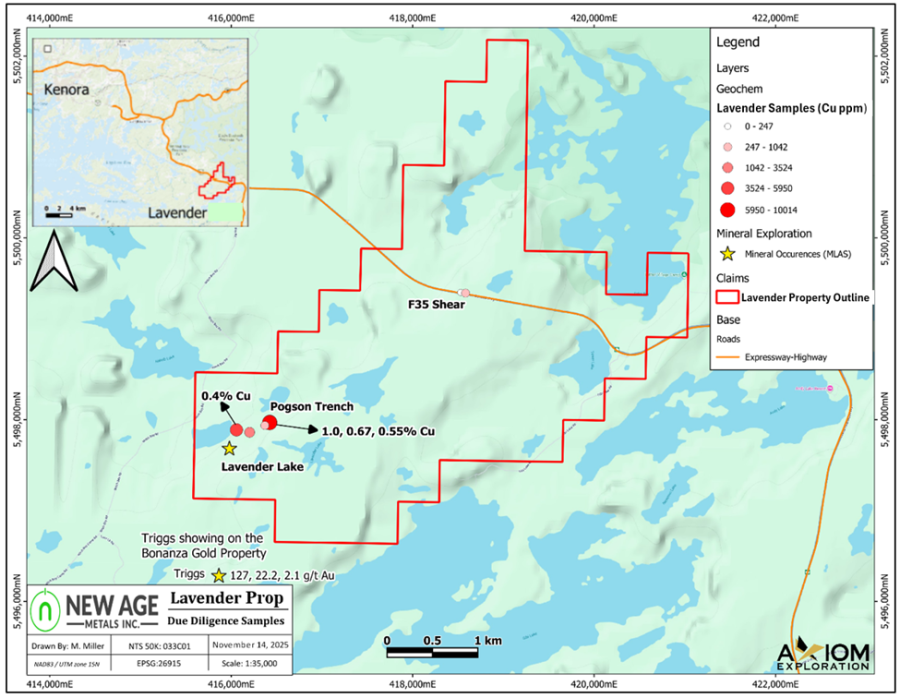
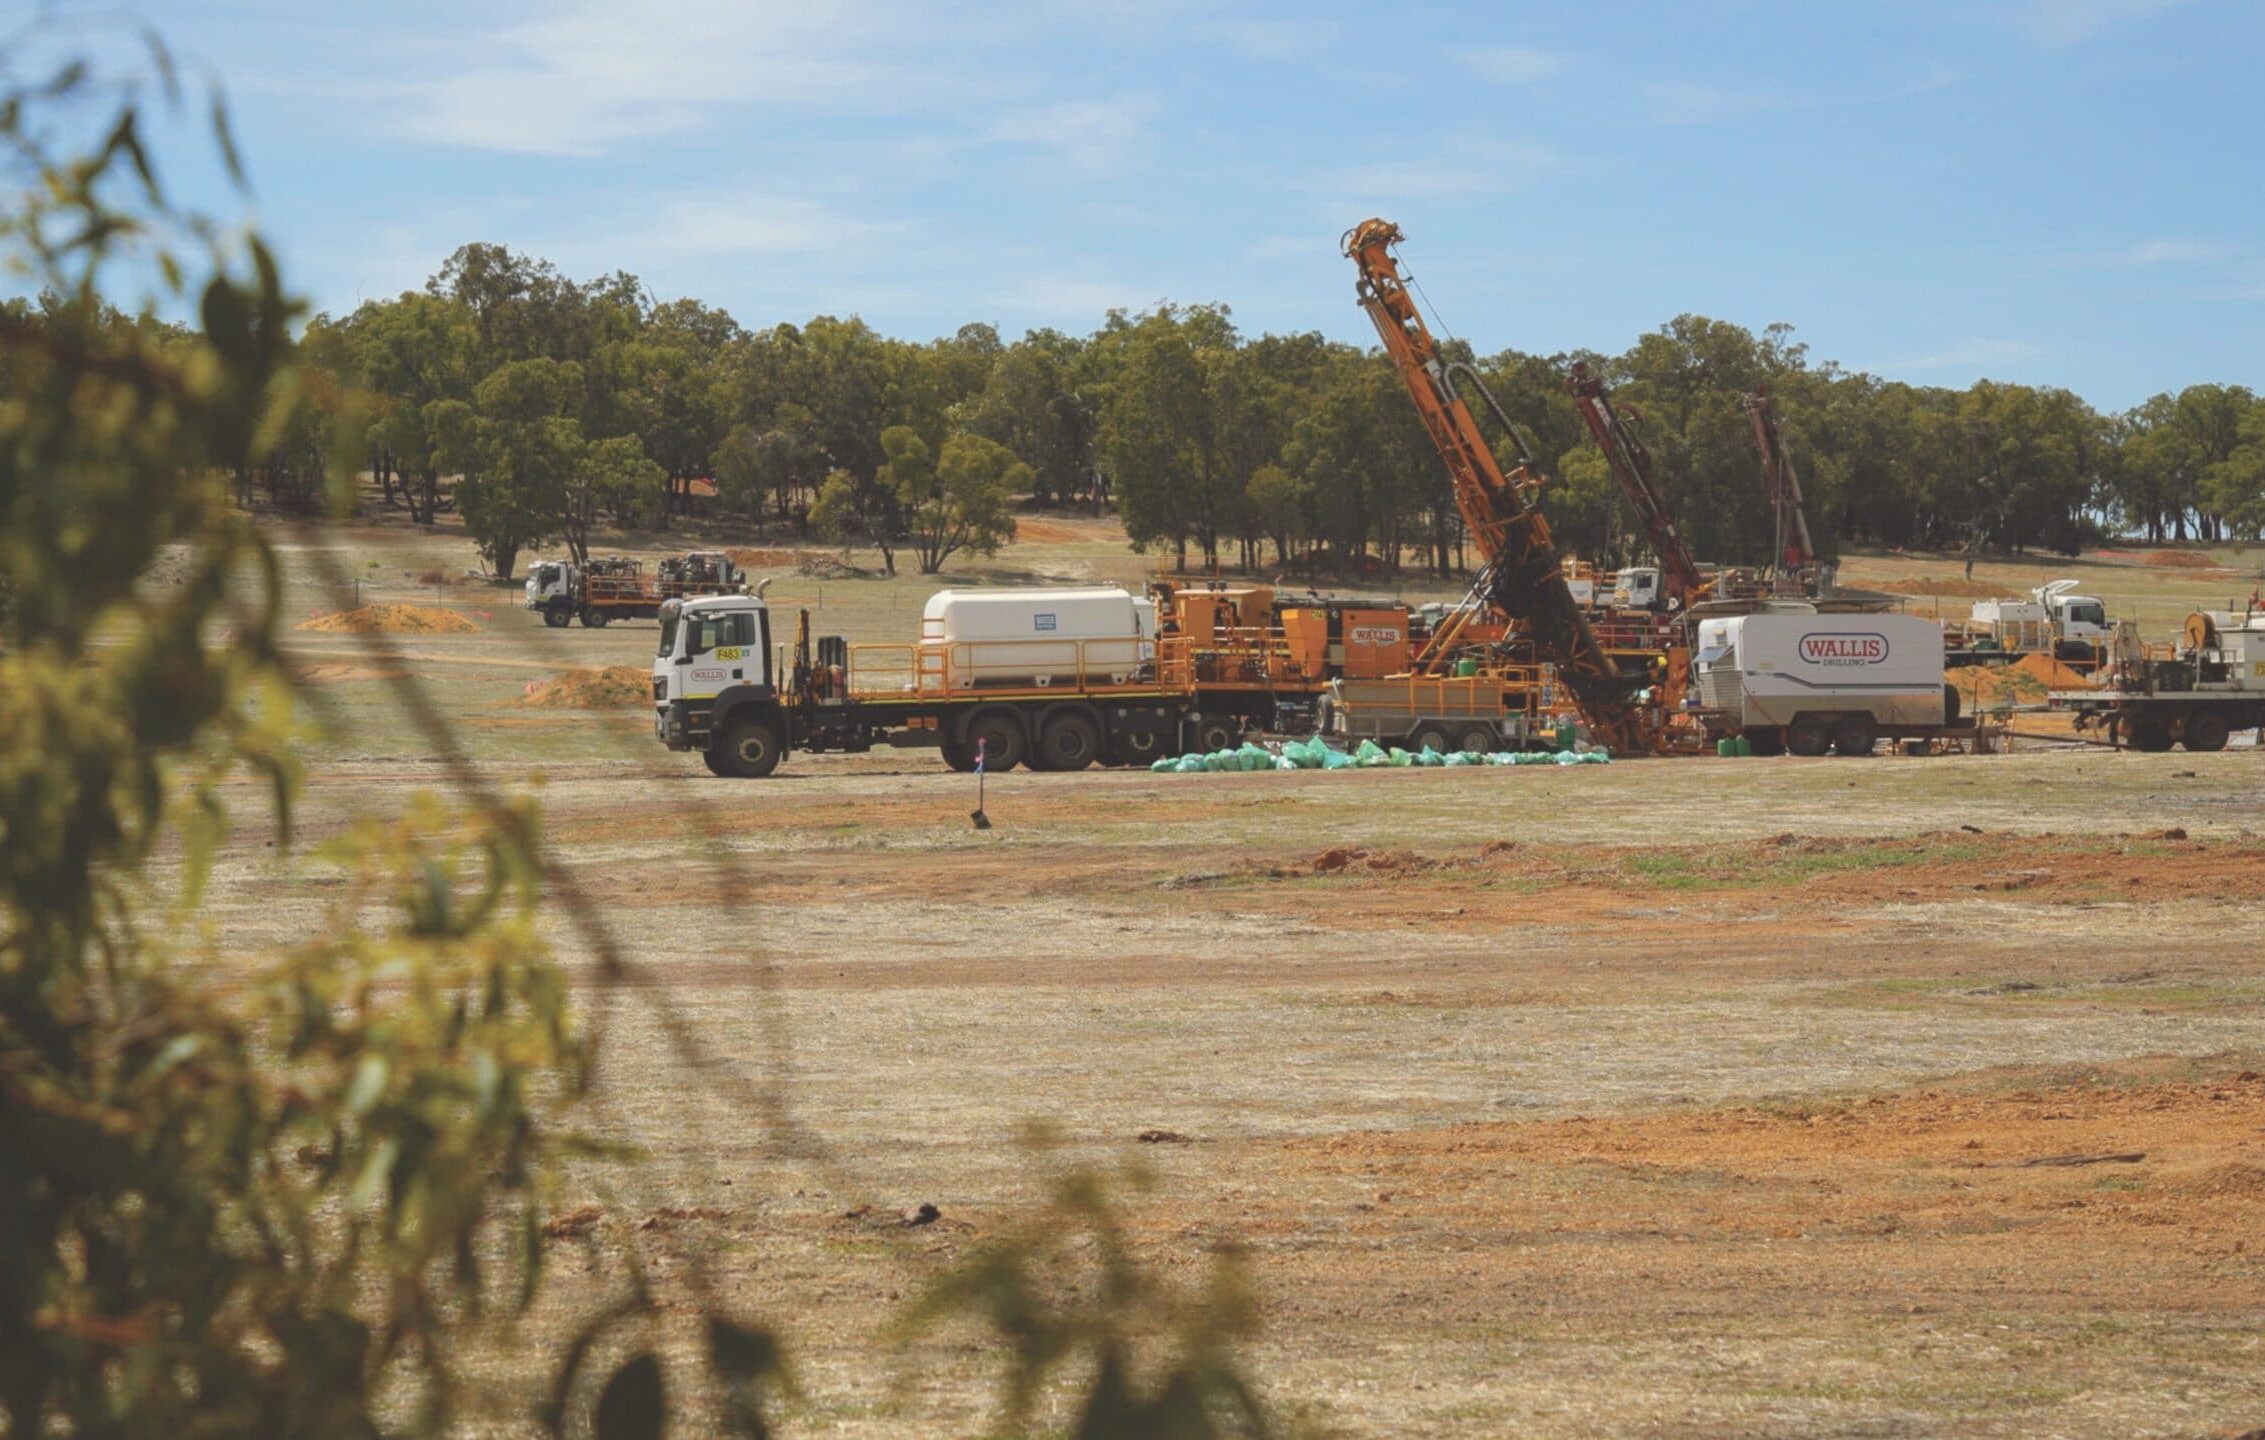
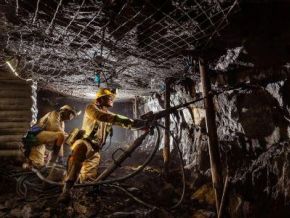
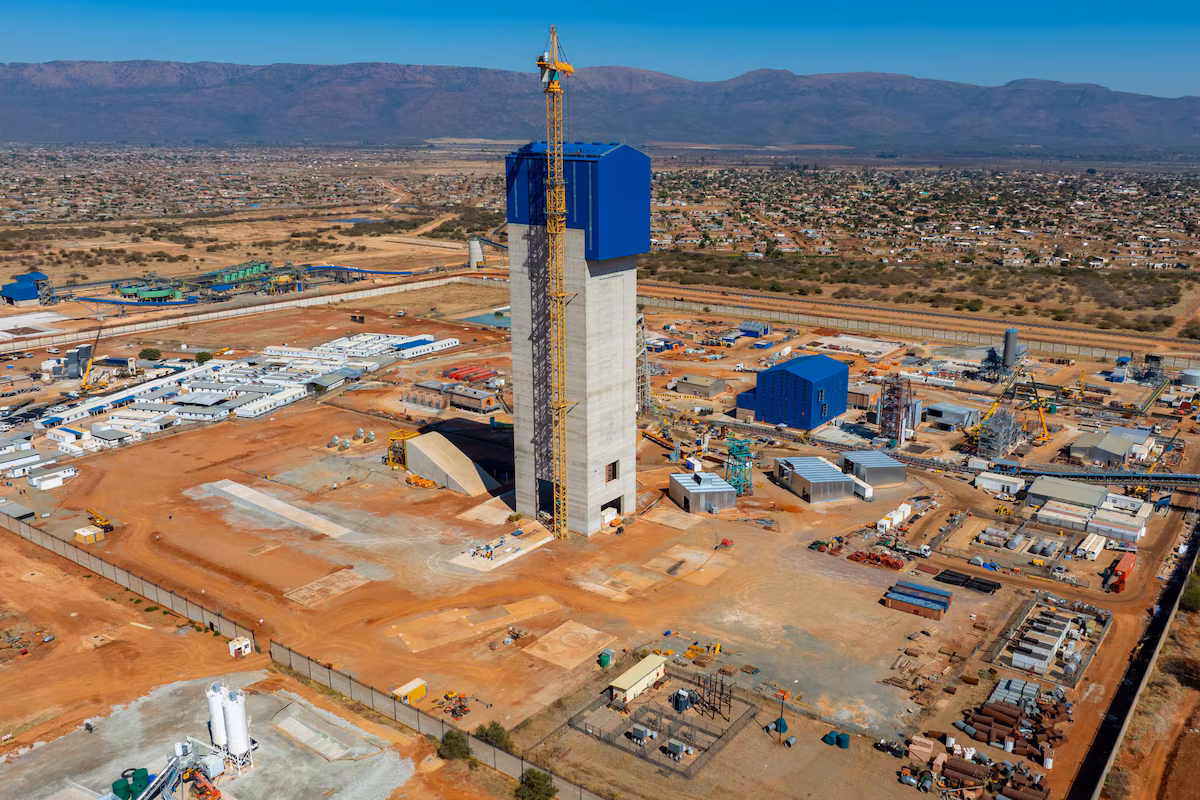
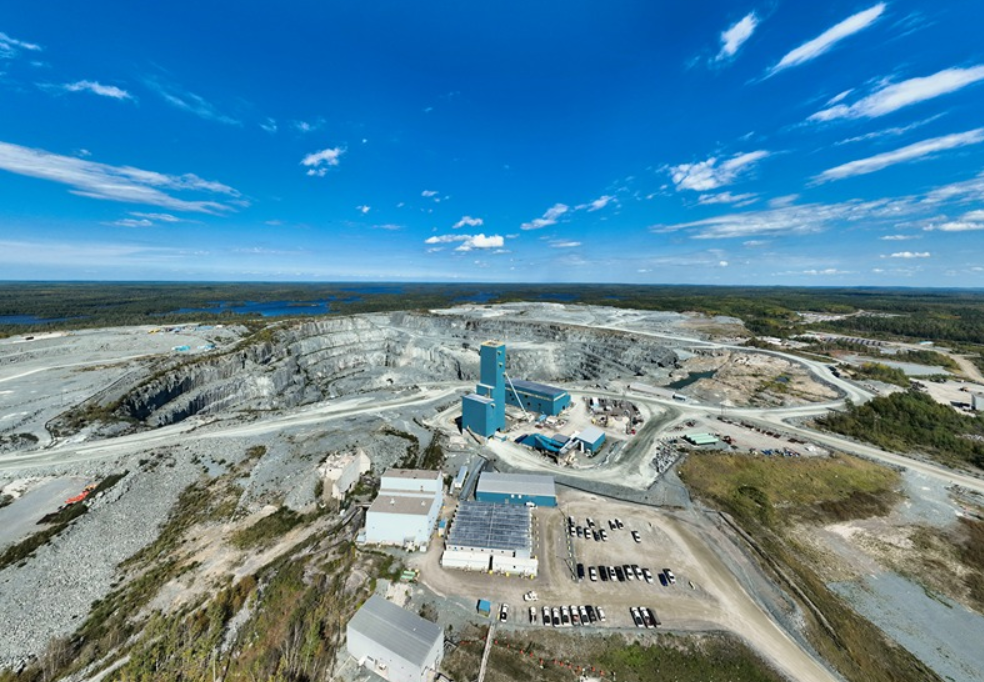
Americas Gold and Silver (TSX:USA) shares were in focus after the company reported the discovery of eight new high grade splay veins at the Galena Complex, along with record 2025 consolidated silver production of 2.65 million ounces.
See our latest analysis for Americas Gold and Silver.
The recent exploration news and record 2025 production appear to have fed into strong momentum, with a 70.04% 3 month share price return and a very large 1 year total shareholder return of 436.50% suggesting sentiment has strengthened over both shorter and longer periods.
If this kind of move in precious metals piques your interest, it could be a useful moment to broaden your watchlist with fast growing stocks with high insider ownership.
With the shares up sharply over the past year and analysts’ average price target sitting above the latest CA$9.59 close, the key question now is whether Americas Gold and Silver still trades below its potential or if the market is already pricing in future growth.
On the numbers, Americas Gold and Silver trades on a P/S of 20.3x, which sits well above both its peers and the wider Canadian metals and mining group.
P/S compares the company’s market value to its revenue and is often used for businesses that are not profitable yet. A higher P/S can signal that investors are already factoring in strong future revenue and earnings improvements, so a lot of expectation may already be in the price.
Here, the gap is wide. The current 20.3x P/S stands against an 8.5x average for the Canadian metals and mining industry and a 15.4x peer average. It also exceeds an estimated fair P/S of 2.2x, which points to a level the market could move toward if sentiment or growth expectations cool.
Explore the SWS fair ratio for Americas Gold and Silver
Result: Price-to-sales of 20.3x (OVERVALUED)
However, there are still clear risks if revenue growth stalls or if the company’s CA$61.301 million net loss continues, which could challenge such a rich P/S ratio.
Find out about the key risks to this Americas Gold and Silver narrative.
Our DCF model paints a more measured picture than the rich 20.3x P/S might suggest. On this approach, Americas Gold and Silver is trading a little above our estimate of future cash flow value, with the current CA$9.59 price slightly higher than the CA$9.48 fair value.