The Indian equity market continues to be bogged down by the effects of the US-Iran war and consequent rise in inflation. Further, an expectation of a weak monsoon has dampened the spirits.
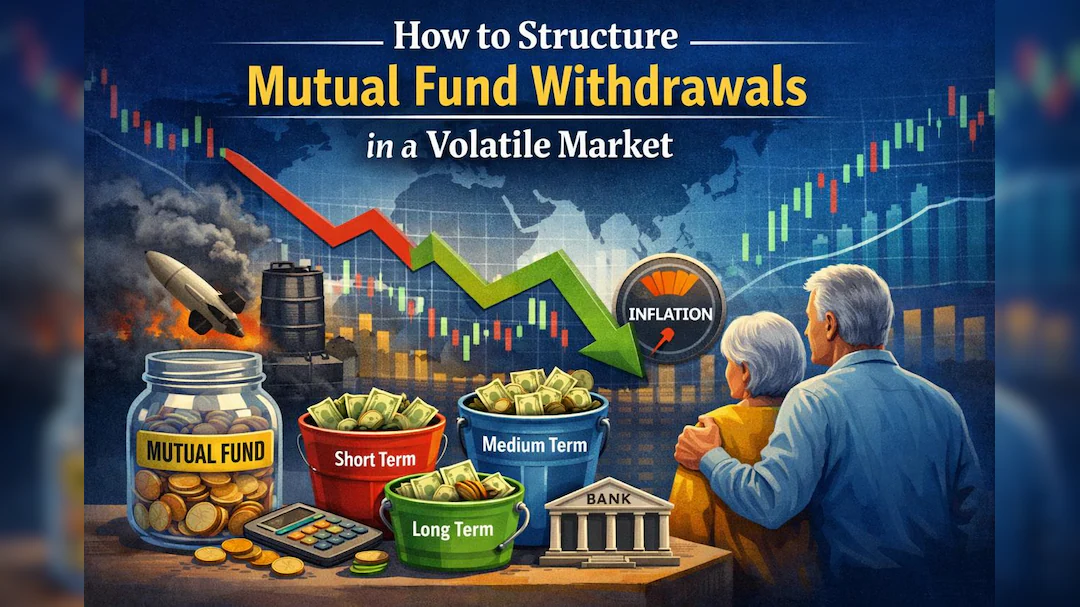
For investors aiming to use the recent correction to gradually increase equity exposure for long-term wealth creation, value investing can be an effective route.
Value-oriented funds can capitalise on short-term market pessimism by investing in fundamentally strong businesses at attractive valuations, which gives them the potential to generate superior risk-adjusted returns across a full market cycle.
As you may be aware, value investing is a proven approach that involves seeking fundamentally strong stocks trading at a discount to their intrinsic value.
These stocks can rebound when market sentiment improves, aligning with their fair valuation.
Value funds seek opportunities in such undervalued stocks temporarily discounted by the market but those that have strong prospects and the potential for recovery.
In this editorial, we will look at the top 3 value funds based on risk-adjusted returns.
We have shortlisted these schemes based on a combined quantitative score which includes 6-month, 1-year, 3-year, and 5-year rolling returns along with risk-reward ratios such as standard deviation, sharpe, sortino, and up/down capture ratio.
#1 ICICI Pru Value Fund
Launched in August 2004, ICICI Pru Value Fund, earlier known as ICICI Pru Value Discovery Fund, has consistently shown strong long-term performance, which has helped it become the largest scheme in its category.
The fund’s strategy of avoiding momentum-driven investments and focusing on large-cap stocks helps lower risk and allows it to outperform the benchmark and majority of its peers.
It also benefits from the expertise of veteran fund manager, Sankaran Naren, who is well-known for his contrarian investment style and skill in identifying value.
In the last 5 years, ICICI Pru Value Fund generated returns at a CAGR of 24.2% on a rolling return basis compared to 18.1% generated by the Nifty 500 – TRI index.
The fund has registered one of the lowest volatilities in the category while its Sharpe and Sortino ratios rank among the best in the category and is much ahead of the benchmark.
Performance Snapshot – ICICI Pru Value Fund
| Scheme Name | 5-Yr CAGR (%) | Risk Ratios | ||
| Std Dev | Sharpe | Sortino | ||
| ICICI Pru Value Fund | 24.18 | 11.32 | 0.31 | 0.59 |
| Category Average | 21.00 | 13.94 | 0.26 | 0.49 |
| NIFTY 500 – TRI | 18.14 | 13.56 | 0.20 | 0.37 |
Source: ACE MF
ICICI Pru Value Fund’s portfolio is usually diversified across 60 to 70 stocks. As of 30 April 2026, the fund held 63 stocks with the top 10 holdings accounted for nearly 51.3% of its total assets.
HDFC Bank is currently the top equity holding in the fund’s portfolio, followed by ICICI Bank, Infosys, ITC, and Reliance Industries.
It holds most of its stocks with a long-term view and has recorded a moderate turnover rate of 45-50% in recent months.
Its top sector allocation includes bank, infotech, and healthcare that collectively form 47% of its assets.
In the last one year, ICICI Pru Value Fund maintained an exposure of around 77-85% in large caps, along with 10-13% in mid and small caps.
#2 HSBC Value Fund
Launched in January 2010, HSBC Value Fund, earlier known as L&T Value Fund, aims to pursue quality businesses using a blend of value and growth investing and a bottom-up approach to generate alpha.
Further, the fund benefits from the continuity of its fund manager, Venugopal Manghat, who has been managing the schemes since 2014.
It has established a track record of generating robust returns across most time frames and rewarding investors with meaningful gains over the long run.
In the last 5 years, HSBC Value Fund generated returns at a CAGR of 24.7% on a rolling return basis compared to 18.1% generated by the Nifty 500 – TRI index.
While the fund’s volatility is higher than the benchmark and category average, it stands out in terms of risk-adjusted returns, thereby rewarding investors for the level of risk taken.
Performance Snapshot – HSBC Value Fund
| Scheme Name | 5-Yr CAGR (%) | Risk Ratios | ||
| Std Dev | Sharpe | Sortino | ||
| HSBC Value Fund | 24.68 | 15.41 | 0.31 | 0.60 |
| Category Average | 21.00 | 13.94 | 0.26 | 0.49 |
| NIFTY 500 – TRI | 18.14 | 13.56 | 0.20 | 0.37 |
Source: ACE MF
HSBC Value Fund holds a well-diversified portfolio of 75-80 stocks spread across sectors.
As of 30 April 2026, the fund held 81 stocks in its portfolio, with the top 10 stocks forming 30.2% of its assets. The fund has limited exposure in each to under 5%.
The top holdings in the portfolio comprise SBI, HDFC Bank, NTPC, Reliance Industries, and Karur Vysya Bank.
The fund holds most of its stocks with a long-term view and carries a moderate turnover ratio of around 30%.
Sector wise, the fund holds about one third of its assets in banking & finance sector while crude oil, metals, IT, and FMCG are the other core sectors.
Over the last one year the fund’s combined exposure towards mid and small-caps stood in the range of about 50-55% of its assets, while it held an exposure of around 42-46% in large caps.
#3 HDFC Value Fund
Launched in February 1994, HDFC Value Fund, earlier known as HDFC Capital Builder Fund, follows a multi cap strategy with a value bias.
The fund invests at least 60% of the portfolio in companies which are trading at multiples lower than Median PE (Price to Earnings) or Median PB (Price to Book Value) of NIFTY 500 Index or below 5-year historical average of own trailing PE or PB.
The fund has outpaced the benchmark on several occasions, helping it deliver strong returns over the long run.
In the last 5 years, HDFC Value Fund generated returns at a CAGR of 21.2% on a rolling return basis compared to 18.1% generated by the Nifty 500 – TRI index.
It has displayed volatility in line with the category average and has outpaced the benchmark and the category average on risk-adjusted returns.
Performance Snapshot – HDFC Value Fund
| Scheme Name | 5-Yr CAGR (%) | Risk Ratios | ||
| Std Dev | Sharpe | Sortino | ||
| HDFC Value Fund | 21.17 | 14.04 | 0.27 | 0.51 |
| Category Average | 21.00 | 13.94 | 0.26 | 0.49 |
| NIFTY 500 – TRI | 18.14 | 13.56 | 0.20 | 0.37 |
Source: ACE MF
As of 30 April 2026, HDFC Value Fund held 71 stocks with the top 10 stocks accounting for 36.7% of its assets.
ICICI Bank, HDFC Bank, Axis Bank, SBI, and Bharti Airtel, currently figure among its top portfolio holdings.
Its top sectors are bank, auto & ancillaries, and IT.
It has a low turnover ratio of around 20-30%, which reflects the strong long-term conviction the fund manager has in the stocks.
The fund has currently allocated 62.5% to large caps, 16.2% to mid caps, and 17.1% to small caps.
Conclusion
Value funds offer an opportunity to benefit from the growth potential of financially sound but undervalued stocks.
As these funds invest in undervalued stocks, they can potentially offer better margin of safety compared to growth-oriented funds.
However, since undervalued stocks tend to remain out of favour for a reasonable amount of time, the fund managers’ bets may take time to pay off.
Therefore, value funds may underperform in the short to medium term, particularly when market rallies are momentum-driven.
However, over the long term, value funds may generate returns in line with growth-oriented funds or even outperform them.
#Table Note: Data as of 31 May 2026
Rolling period returns are calculated using the Direct Plan-Growth option.
Returns over 1 year are compounded annually.
Standard Deviation indicates risk, while the Sharpe ratio and Sortino ratios measure risk-adjusted return.
They are calculated over 3 years, assuming a risk-free rate of 6% p.a.
Past performance is not an indicator of future returns.
The securities quoted are for illustration only and are not recommendations.
Happy Investing.
Disclaimer: This article is for information purposes only. It is not a stock recommendation and should not be treated as such. Learn more about our recommendation services here…
The website managers, its employee(s), and contributors/writers/authors of articles have or may have an outstanding buy or sell position or holding in the securities, options on securities or other related investments of issuers and/or companies discussed therein. The content of the articles and the interpretation of data are solely the personal views of the contributors/ writers/authors. Investors must make their own investment decisions based on their specific objectives, resources and only after consulting such independent advisors as may be necessary