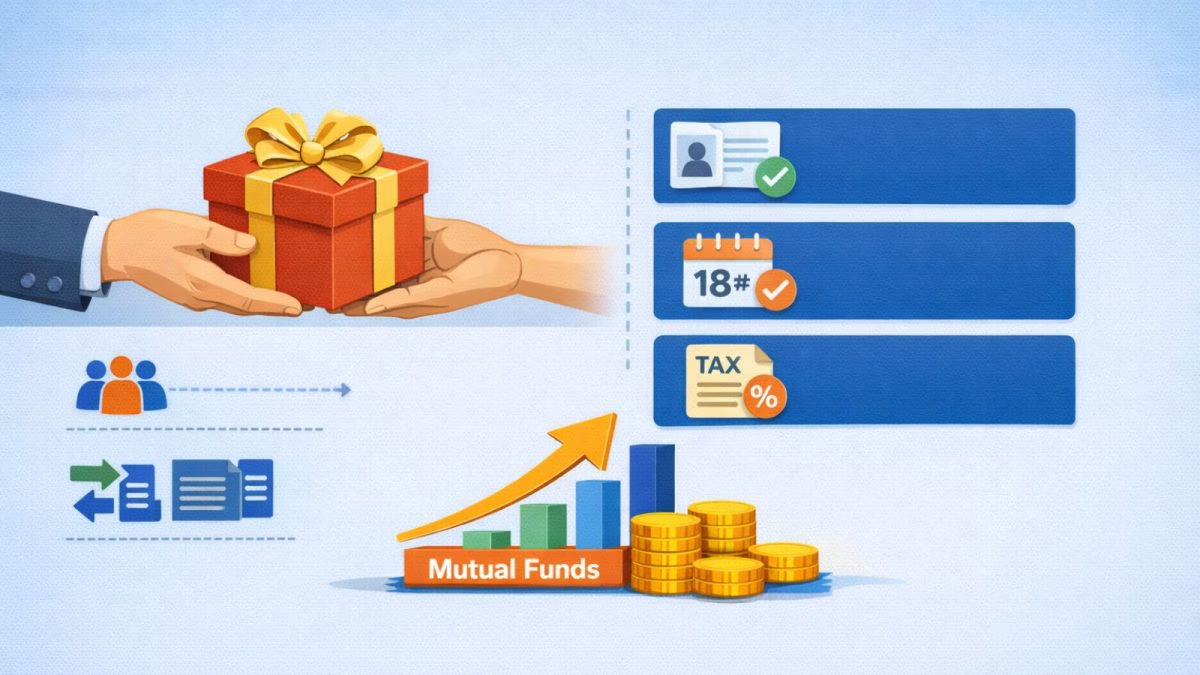
Tax-saving mutual funds, also known as ELSS funds, are equity-oriented schemes that invest a major portion of their corpus in equities and offer tax deduction of up to Rs 1.5 lakh under Section 80C of the Income Tax Act.
In this editorial, we look at the top-performing tax-saving mutual funds to watch in 2026, based on their 3-year and 5-year CAGR returns compared with benchmarks like the Nifty 500 TRI and Nifty 50 TRI.
Tax-Saving Mutual Funds vs Benchmark Returns (3 & 5 Years)
| Entity | 3-Year Return (CAGR %) | 5-Year Return (CAGR %) |
| SBI ELSS Tax Saver Fund | 24.30% | 21.69% |
| Motilal Oswal ELSS Tax Saver Fund | 23.57% | 20.58% |
| HDFC ELSS Tax Saver | 21.63% | 21.91% |
| Nifty 500 TRI (Benchmark) | 16.52% | 15.60% |
| Nifty 50 TRI (Additional Benchmark) | 14.52% | 14.24% |
Source: Fund Factsheet
At first glance, these funds have delivered higher returns than their benchmarks over the past three to five years. However, performance numbers alone do not give the complete picture.
Let us now take a closer look at each tax-saving mutual fund in detail.
#1 SBI ELSS Tax Saver Fund
First is the SBI ELSS Tax Saver Fund, an open-ended equity-linked saving scheme designed to provide long-term capital appreciation along with tax benefits.
The fund maintains a minimum exposure of 80% to equity and equity-related instruments. As an ELSS fund, it comes with a mandatory three-year lock-in period from the date of investment.
As of January 2026, the fund manages Assets Under Management (AUM) of Rs 318.6 billion (bn).
On a risk-adjusted basis, the fund shows relatively stable characteristics. Volatility (standard deviation) stands at 12.9%, indicating moderate fluctuations in returns.
A Sharpe ratio of 1.28 suggests strong risk-adjusted performance over time. With a beta of 0.96, the fund has been slightly less volatile than its benchmark.
Where Does the Fund Invest?
The fund follows a diversified, multi-sector allocation strategy with a strong presence in core sectors of the economy.
Sector Allocation (January 2026)
| Sector | Allocation % |
| Financial Services | 36.22% |
| Oil, Gas & Consumable Fuels | 10.74% |
| Information Technology | 8.35% |
| Healthcare | 5.69% |
| Capital Goods | 5.39% |
| Metals & Mining | 5.26% |
Source: Fund Factsheet
A major portion of the portfolio is invested in largecap companies (62.81%), providing relative stability. The remaining allocation is distributed across midcaps (18.73%) and smallcaps (14.68%), which may offer additional growth potential.
How the Fund Has Grown Over Time
The fund is benchmarked against the BSE 500 TRI, with the BSE Sensex TRI as the additional benchmark.
Rs 10,000 Investment Growth Comparison (January 2026)
| Particulars | 1 Year CAGR (%) | 1 Year Value | 3 Years CAGR (%) | 3 Years Value | 5 Years CAGR (%) | 5 Years Value |
| SBI ELSS Tax Saver Fund (Direct-G) | 7.64% | Rs 10,764 | 24.30% | Rs 19,215 | 21.69% | Rs 26,712 |
| BSE 500 TRI (Benchmark) | 7.76% | Rs 10,774 | 16.41% | Rs 15,773 | 16.42% | Rs 21,401 |
| BSE Sensex TRI (Additional Benchmark) | 7.44% | Rs 10,742 | 12.77% | Rs 14,342 | 13.54% | Rs 18,882 |
Source: Fund Factsheet
In the short term, the one-year return of 7.64% was marginally lower than the benchmark return.
Over longer periods, performance has been stronger. An investment of Rs 10,000 would have grown to Rs 19,215 in three years and Rs 26,712 in five years in the Direct Plan, outperforming both benchmarks over these periods.
#2 Motilal Oswal ELSS Tax Saver Fund
Next is the Motilal Oswal ELSS Tax Saver Fund, which follows a relatively concentrated stock strategy and typically invests 65% or more of its assets in equities.
Like other ELSS funds, it comes with a mandatory three-year lock-in period and offers tax benefits under Section 80C of the Income Tax Act.
As of January 2026, the fund manages AUM of Rs 41.9 bn.
On a risk-adjusted basis, standard deviation stands at 18.8%, indicating higher fluctuations in returns compared to diversified large-cap oriented funds.
The Sharpe ratio of 0.9 suggests moderate risk-adjusted performance. With a beta of 1.2, the fund has been more volatile than the broader market benchmark, meaning it tends to move more sharply during market ups and downs.
Where Does the Fund Invest?
The fund follows a focused, multi-cap investment approach with exposure to sectors linked to financial services, industrial growth, and emerging technologies.
Sector Allocation (January 2026)
| Sector | Allocation % |
| Finance | 16.50% |
| Capital Markets | 14.70% |
| Electrical Equipment | 12.60% |
| Aerospace & Defense | 9.90% |
| Industrial Products | 6.50% |
| Financial Technology (Fintech) | 5.40% |
Source: Fund Factsheet
The portfolio is structured as ‘multi-cap blend’, with significant exposure to both largecaps and midcaps.
How the Fund Has Grown Over Time
In the short term, one-year returns were lower than the benchmark.
However, over three and five years, the fund has delivered stronger returns compared to both benchmarks.
Rs 10,000 Investment Growth Comparison (January 2026)
| Particulars | 1 Year CAGR (%) | 1 Year Value | 3 Years CAGR (%) | 3 Years Value | 5 Years CAGR (%) | 5 Years Value |
| Motilal Oswal ELSS (Direct-G) | 3.51% | Rs 10,351 | 23.57% | Rs 18,870 | 20.58% | Rs 25,487 |
| Nifty 500 TRI (Benchmark) | 7.98% | Rs 10,798 | 16.72% | Rs 15,902 | 16.54% | Rs 21,493 |
| Nifty 50 TRI (Additional Benchmark) | 8.97% | Rs 10,897 | 14.08% | Rs 14,848 | 14.54% | Rs 19,714 |
Source: Fund Factsheet
An investment of Rs 10,000 would have grown to Rs 18,870 in three years and Rs 25,487 in five years in the Direct Plan.
#3 HDFC ELSS Tax Saver Fund
Next is the HDFC ELSS Tax Saver Fund, which follows a quality-focused investment approach.
It invests in companies with sustainable growth potential, strong competitive positioning, and sound corporate governance.
As of January 2026, the fund manages AUM of Rs 167.5 bn.
On a risk-adjusted basis, the standard deviation stands at 10.8%, indicating lower fluctuations in returns compared to many diversified equity funds.
A Sharpe ratio of 1.3 suggests strong risk-adjusted performance. With a beta of 0.79, the fund has historically been less volatile than its benchmark, indicating lower sensitivity to market movements.
Where Does the Fund Invest?
The fund maintains a diversified portfolio with a strong allocation toward core sectors of the Indian economy.
Sector Allocation (December 2025)
| Sector | Allocation % |
| Financial Services | 43.70% |
| Automobile and Auto Components | 13.70% |
| Healthcare | 7.00% |
| Fast Moving Consumer Goods | 3.80% |
| Consumer Durables | 2.00% |
Source: Fund Factsheet
The portfolio is heavily anchored in large-cap stocks, which account for 83.5% of total exposure. Smaller allocations to midcaps (4.8%) and smallcaps (9.7%) provide additional growth potential while maintaining stability.
How the Fund has Grown Over Time
In the short term, the fund delivered stronger one-year returns compared to both benchmarks.
Rs 10,000 Investment Growth Comparison (January 2026)
| Particulars | 1 Year CAGR (%) | 1 Year Value | 3 Years CAGR (%) | 3 Years Value | 5 Years CAGR (%) | 5 Years Value |
| HDFC ELSS Tax Saver | 10.84% | Rs 11,081 | 21.63% | Rs 17,994.86 | 21.91% | Rs 26,960.16 |
| NIFTY 500 TRI (Benchmark) | 7.98% | Rs 10,795.54 | 16.72% | Rs 15,902.41 | 16.52% | Rs 21,492.59 |
| NIFTY 50 TRI (Additional Benchmark) | 8.97% | Rs 10,894.86 | 14.08% | Rs 14,848.13 | 14.52% | Rs 19,714.03 |
Source: Fund Factsheet
Over three to five years, performance remained ahead of the benchmark indices. An investment of Rs 10,000 would have grown to Rs 17,994.86 in three years and Rs 26,960.16 in five years.
Conclusion
Tax-saving mutual funds offer an opportunity to save tax under Section 80C while aiming for long-term capital appreciation.
However, they come with a mandatory three-year lock-in period. Investors should evaluate their risk appetite, financial objectives, and investment horizon before investing.
Happy investing.
Disclaimer: This article is for information purposes only. It is not a stock recommendation and should not be treated as such. Learn more about our recommendation services here…
The website managers, its employee(s), and contributors/writers/authors of articles have or may have an outstanding buy or sell position or holding in the securities, options on securities or other related investments of issuers and/or companies discussed therein. The content of the articles and the interpretation of data are solely the personal views of the contributors/ writers/authors. Investors must make their own investment decisions based on their specific objectives, resources and only after consulting such independent advisors as may be necessary