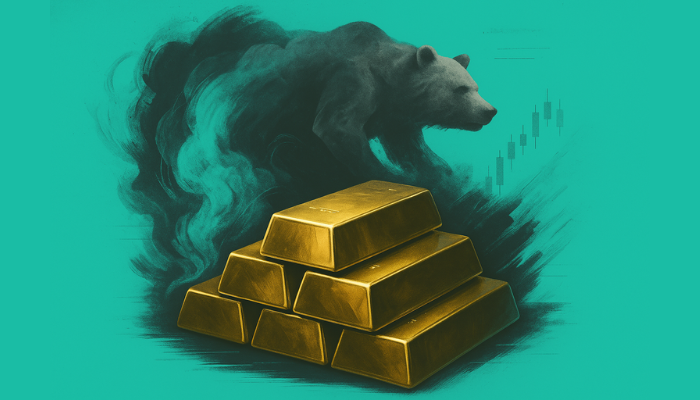
Gold is reversing the early dip to near $5,000 on Monday, setting off the week on a bearish note amid relentless US Dollar (USD) demand and soaring Oil prices.
Gold suffers from oil-driven global sell-off
Gold is bearing the brunt of the unprecedented surge in Oil prices this Monday, as markets brace for intensifying energy supply disruption amid a protracted war in the Middle East.
Some of the Gulf countries have scaled back oil production as the Strait of Hormuz is under the Iranian siege, disrupting safe passage of oil cargoes.
Saad Sherida Al‑Kaabi, Qatar’s Energy Minister, told the Financial Times on Friday he expects all Gulf energy producers to shut down exports within weeks, a move he said could drive oil to $150 a barrel.
Kuwait, a member of the Organization of the Petroleum Exporting Countries (OPEC), announced precautionary production cuts, while Iraq’s southern oil output dropped to 1.3 million barrels per day from 4.3 million.
Markets are fretting that the energy crisis-driven inflation could dissuade the US Federal Reserve (Fed) from lowering interest rates in the coming months.
This hawkish narrative is weighing negatively on the non-yielding Gold even as the bright metal is considered as an inflation hedge and a traditional store of value.
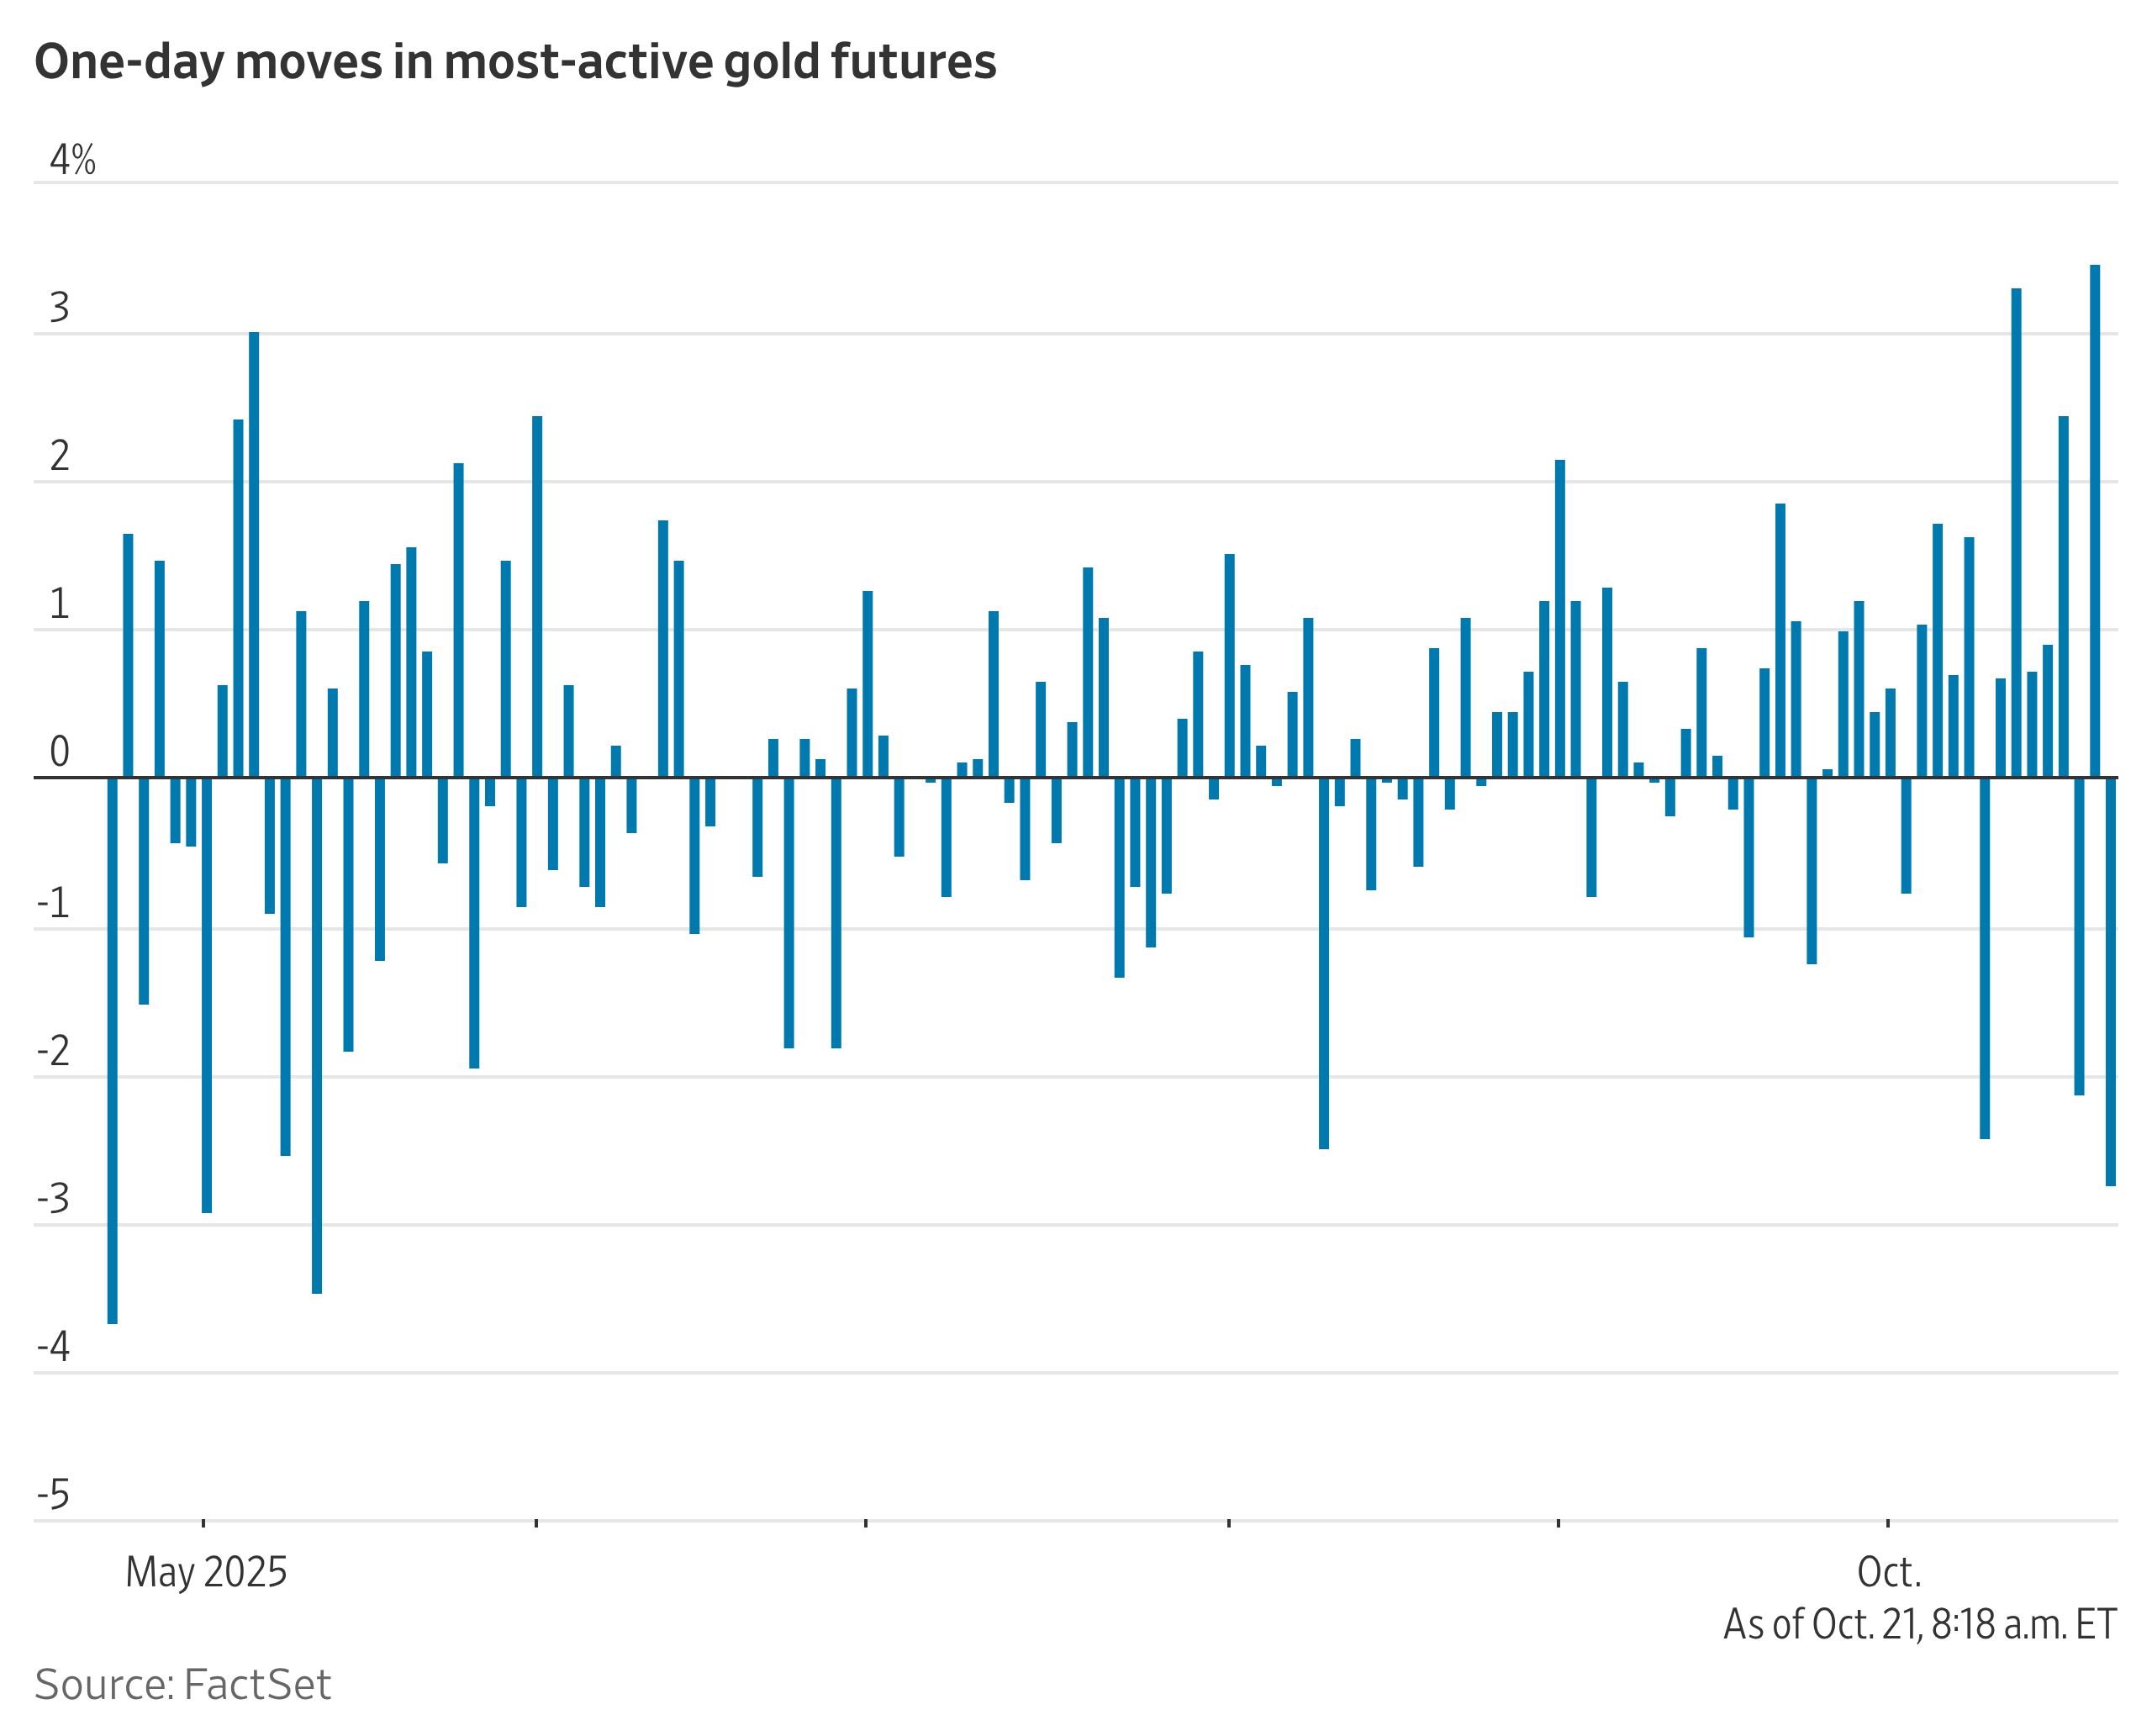
Meanwhile, traders are booking profits on the metal’s parabolic rise to cover losses incurred due to the war-led meltdown in the global stocks.
All eyes remain glued to the developments in the Middle East war, especially after US President Donald Trump said Sunday the new leader “is not going to last long”.
“Iran named Mojtaba Khamenei to succeed his father Ali Khamenei as supreme leader, signalling that hardliners remained firmly in charge in Tehran a week into its conflict with the US and Israel,” per Reuters.
Further, signals on any near-term de-escalation that will open the Strait of Hormuz will also be on market’s radar for further trading impetus in Gold.
Gold price technical analysis: Daily chart
The near-term bias is cautiously bullish as price holds above the 21-, 50-, 100- and 200-day Simple Moving Averages (SMAs), with the shorter averages clustered well above the longer ones, reinforcing an established uptrend. The metal has bounced from the 38.2% Fibonacci retracement at $4,858.82 measured from the $4,401.99 low to the $5,597.89 high, underscoring the significance of that pullback floor. The Relative Strength Index (RSI) hovers just above 50, showing moderated momentum after prior overbought readings, yet still aligned with a gentle upside bias while the recent series of higher closes remains intact.
Initial resistance emerges at the 61.8% retracement near $5,141.05, where a daily close above would open the way toward the 78.6% level at $5,341.96, and beyond that the record high zone around $5,598. On the downside, immediate support is seen at the 50% retracement at $4,999.94, which converges with the rising 21-day SMA to create a nearby demand area; a break below would expose the 38.2% level at $4,858.82. Further weakness from there would bring the rising 50-day SMA around the $4,880 area into focus as the next key trend support, with the 100-day SMA much lower, reinforcing the broader bullish structure even in the event of a deeper correction.
(The technical analysis of this story was written with the help of an AI tool.)
Inflation FAQs
Inflation measures the rise in the price of a representative basket of goods and services. Headline inflation is usually expressed as a percentage change on a month-on-month (MoM) and year-on-year (YoY) basis. Core inflation excludes more volatile elements such as food and fuel which can fluctuate because of geopolitical and seasonal factors. Core inflation is the figure economists focus on and is the level targeted by central banks, which are mandated to keep inflation at a manageable level, usually around 2%.
The Consumer Price Index (CPI) measures the change in prices of a basket of goods and services over a period of time. It is usually expressed as a percentage change on a month-on-month (MoM) and year-on-year (YoY) basis. Core CPI is the figure targeted by central banks as it excludes volatile food and fuel inputs. When Core CPI rises above 2% it usually results in higher interest rates and vice versa when it falls below 2%. Since higher interest rates are positive for a currency, higher inflation usually results in a stronger currency. The opposite is true when inflation falls.
Although it may seem counter-intuitive, high inflation in a country pushes up the value of its currency and vice versa for lower inflation. This is because the central bank will normally raise interest rates to combat the higher inflation, which attract more global capital inflows from investors looking for a lucrative place to park their money.
Formerly, Gold was the asset investors turned to in times of high inflation because it preserved its value, and whilst investors will often still buy Gold for its safe-haven properties in times of extreme market turmoil, this is not the case most of the time. This is because when inflation is high, central banks will put up interest rates to combat it.
Higher interest rates are negative for Gold because they increase the opportunity-cost of holding Gold vis-a-vis an interest-bearing asset or placing the money in a cash deposit account. On the flipside, lower inflation tends to be positive for Gold as it brings interest rates down, making the bright metal a more viable investment alternative.