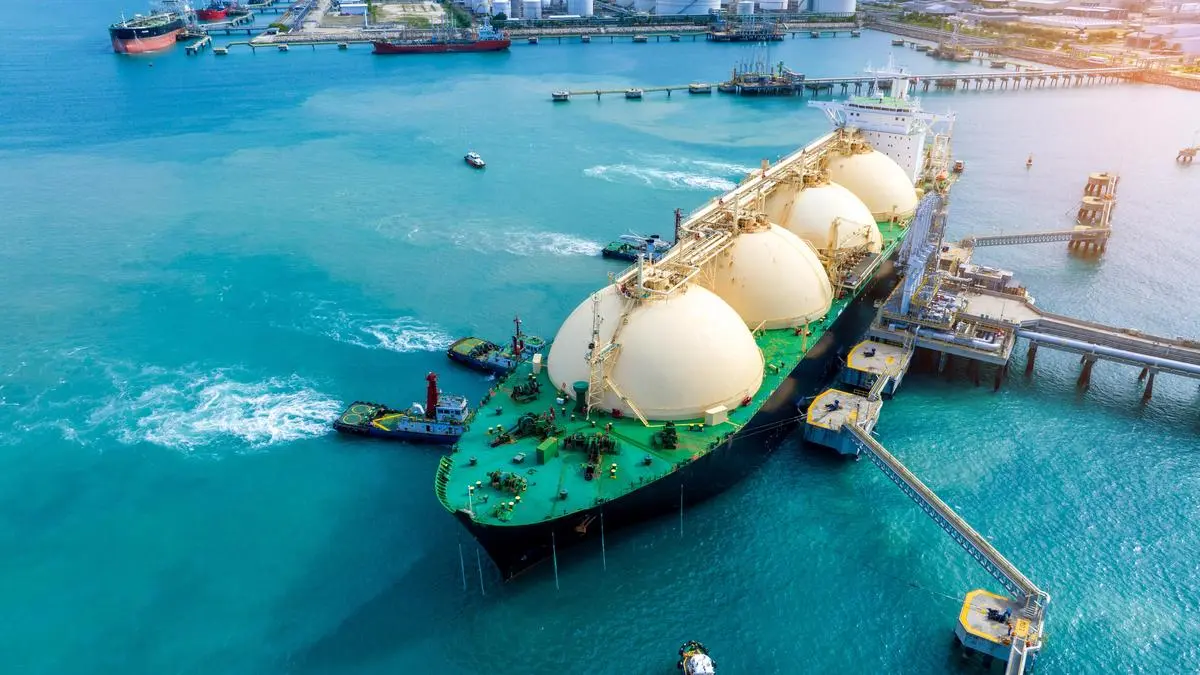
The Commodities & Natural Resources sector is the best performer of 2025, data from the Association of Investment Companies (AIC) has revealed. The sector produced a return of 44% in the 11 months to the end of November.
It was closely followed by China / Greater China, with a 43% return. The third best performing AIC sector was Global Emerging Markets, returning 34% (see full tables below of top performing sectors and trusts).
The average investment trust excluding VCTs has returned 10% in the year to date.
Annabel Brodie-Smith, Communications Director of the Association of Investment Companies (AIC), said: “After two years of negative returns, the commodities sector has come roaring back to top the performance table, with an outstanding 156% return from Golden Prospect Precious Metals, the best performing investment trust of the year. CQS Natural Resources Growth & Income was the fourth best performing trust with a 69% return, and another commodities trust, BlackRock World Mining, made it into the top ten returning 52% to investors.
“Emerging markets trusts also put in a strong performance this year, despite worries about Trump’s tariffs. The China sector delivered 43% and the Global Emerging Markets sector 34% – a result that might have been hard to predict at the start of the year.
“It’s always interesting to look at what sectors and trusts have done best over the short term, but no sector performs best every year. Taking a long-term view and having a properly diversified portfolio is the key to investment success.”
Ten best performing sectors in the year to date
| AIC sector | Share price total return (%) | ||||
| YTD* | 1 year | 3 years | 5 years | 10 years | |
| Average investment trust ex VCTs | 10.27 | 9.98 | 37.67 | 45.60 | 183.10 |
| Commodities & Natural Resources | 43.87 | 35.63 | 22.00 | 117.25 | 214.72 |
| China / Greater China | 42.76 | 50.96 | 41.90 | -15.17 | 156.56 |
| Global Emerging Markets | 33.79 | 36.86 | 57.10 | 38.30 | 187.44 |
| Growth Capital | 30.20 | 35.02 | 96.69 | -25.51 | N/A |
| Technology & Technology Innovation | 28.30 | 33.39 | 142.26 | 102.62 | 623.23 |
| Japan | 28.13 | 29.08 | 45.70 | 17.37 | 151.91 |
| European Smaller Companies | 26.80 | 31.31 | 47.61 | 44.78 | 209.21 |
| Asia Pacific Equity Income | 24.60 | 25.93 | 40.20 | 45.01 | 167.62 |
| Biotechnology & Healthcare | 21.52 | 16.74 | 10.16 | -5.45 | 93.72 |
| Europe | 21.43 | 21.54 | 36.19 | 43.46 | 145.58 |
Source: theaic.co.uk / Morningstar (to 30/11/25). N/A means there is no performance history for the period. Excludes VCTs. * Year to date = 11 months to 30/11/25.
Ten best performing trusts in the year to date
| Investment trust | AIC sector | Share price total return (%) | ||||
| YTD* | 1 year | 3 years | 5 years | 10 years | ||
| Golden Prospect Precious Metals | Commodities & Natural Resources | 156.34 | 134.84 | 172.86 | 91.58 | 385.33 |
| DP Aircraft I | Leasing | 130.00 | 136.91 | 245.00 | 176.00 | -80.73 |
| Gresham House Energy Storage | Renewable Energy Infrastructure | 75.64 | 59.64 | -48.35 | -13.94 | N/A |
| UIL | Flexible Investment | 68.89 | 65.14 | 25.97 | 27.92 | 157.73 |
| CQS Natural Resources Growth & Income | Commodities & Natural Resources | 68.83 | 55.25 | 65.56 | 250.85 | 469.73 |
| Marwyn Value Investors | UK Smaller Companies | 58.80 | 70.35 | 88.05 | 83.21 | 14.83 |
| Molten Ventures | Growth Capital | 54.04 | 55.75 | 26.00 | -24.86 | N/A |
| BlackRock Latin American | Latin America | 52.37 | 45.56 | 30.98 | 49.55 | 127.23 |
| BlackRock World Mining Trust | Commodities & Natural Resources | 52.27 | 43.90 | 19.86 | 103.29 | 535.43 |
| Biotech Growth Trust | Biotechnology & Healthcare | 50.29 | 33.16 | 36.27 | -12.70 | 79.72 |
Source: theaic.co.uk / Morningstar (to 30/11/25). N/A means there is no performance history for the period. Excludes VCTs and companies undergoing liquidation. * Year to date = 11 months to 30/11/25.